Trading Ideas – Position Updates
We start the week with three open positions, note the stops have been raised:

20 minute delayed
Join Market Matters and get full access to all our Opinion + Action
Fairly valued
Morningstar Quantitative Rating as of 13 NOV 2026.
Quantitative Equity Rating Methodology – view here
Five-star price 2.71 Fair value 3.01 One-star price 3.34
Morningstar Quantitative Rating as of 13 NOV 2026.
Morningstar Quantitative Rating as of 13 NOV 2026. The slider runs from the five-star price (2.71) to the one-star price (3.34).
| Ratios |
|---|
| Currency (Price/reporting): AUD/AUD |
| Exchange Rate: 1.0000 |
| Price - closing or last bid | 3.01 |
| Price - 12 month high | 3.02 |
| Price - 12 month low | 2.14 |
| Pricing date | 13 NOV 2026 |
| Volume - avg. trading volume for the last ten days | 21.06 |
| Market capitalization | 6,749.85 |
| 12 Month High price date | 6 NOV 2026 |
| 12 Month Low price date | 18 MAY 2026 |
| Volume - avg. trading volume for the last 3 months | 28.92 |
| Price - 1 Day % Change | 0.00% |
| Price - 13 week price percent change | 11.07% |
| Price - 26 week price percent change | 33.78% |
| Price - 5 Day % Change | 0.00% |
| Price - 52 week price percent change | 19.92% |
| Price - YTD price percent change | 16.22% |
| Price % Change Month To Date | 14.45% |
| EPS excluding extraordinary items - most recent fiscal year | 0.044 |
| EPS excluding extraordinary items - trailing 12 month | 0.044 |
| EPS Normalized - most recent fiscal year | 0.100 |
| Revenue/share - most recent fiscal year | 1.921 |
| Revenue/share - trailing 12 month | 1.921 |
| Book value per share - most recent fiscal year | 1.346 |
| Book value per share - most recent half-year | 1.346 |
| Book value (tangible) per share - most recent fiscal year | -0.201 |
| Book value (tangible) per share - most recent half-year | -0.201 |
| Cash per share - most recent fiscal year | 0.052 |
| Cash per share - most recent half-year | 0.052 |
| Cash Flow per share - most recent fiscal year | 0.236 |
| Cash Flow per share - trailing 12 month | 0.236 |
| Dividend per share - most recent fiscal year | — |
| Dividends per share - trailing 12 month | 0.069 |
| EBITD per share - trailing 12 month | 0.326 |
| EPS Basic excluding extraordinary items - most recent fiscal year | 0.044 |
| EPS Basic excluding extraordinary items - trailing 12 month | 0.044 |
| EPS including extraordinary items - most recent fiscal year | 0.044 |
| EPS including extraordinary items - trailing 12 month | 0.044 |
| Free Cash Flow per share - trailing 12 month | 0.090 |
| P/E excluding extraordinary items, most recent fiscal year | 68.41 |
| P/E Normalized, most recent fiscal year | 30.20 |
| Price to sales - most recent fiscal year | 1.57 |
| Price to Tangible Book - most fiscal year | — |
| Price to Free Cash Flow per Share - most recent fiscal year | 33.51 |
| Price to Cash Flow per share - trailing 12 month | 12.76 |
| Price to Book - most recent fiscal year | 2.24 |
| P/E excluding extraordinary items high, trailing 12 months | 68.41 |
| P/E excluding extraordinary items low, trailing 12 months | 33.86 |
| Net Debt, LFI | 2,274.30 |
| Net Debt, LFY | 2,218.60 |
| Dividend Yield - 5 Year Average | 1.94% |
| Dividend Yield - indicated annual dividend divided by closing price | 2.28% |
| Current Dividend Yield - Common Stock Primary Issue, LTM | 2.28% |
| Free Cash Flow - most recent fiscal year | 201.00 |
| LT debt/equity - most recent fiscal year | 73.29% |
| Payout ratio - most recent fiscal year | — |
| Total debt/total equity - most recent fiscal year | 77.36% |
| LT debt/equity - most recent half-year | 74.27% |
| Total debt/total equity - most recent half-year | 78.44% |
| Free Cash Flow - trailing 12 month | 201.00 |
| Payout ratio - trailing 12 month | — |
| Revenue - most recent fiscal year | 4,299.90 |
| Revenue - trailing 12 month | 4,299.90 |
| EBITD - most recent fiscal year | 730.30 |
| EBITD - trailing 12 month | 730.30 |
| Earnings before taxes - most recent fiscal year | 146.20 |
| Earnings before taxes - trailing 12 month | 146.20 |
| Net Income available to common - most recent fiscal year | 98.50 |
| Net Income available to common - trailing 12 months | 98.50 |
| Earnings before taxes Normalized - most recent fiscal year | 159.60 |
| Net Income Available to Common, Normalized - most recent fiscal year | 223.10 |
| Earnings per Share, Normalized, Excluding Extraordinary Items, Avg. Diluted Shares Outstanding, TTM | 0.10 |
| Net Profit Margin % - 1st historical fiscal year | 2.28% |
| Net Profit Margin % - trailing 12 month | 2.28% |
| Operating margin - 1st historical fiscal year | 5.64% |
| Operating margin - trailing 12 month | 5.64% |
| Pretax margin - trailing 12 month | 3.40% |
| Pretax margin - 1st historical fiscal year | 3.40% |
| Operating Margin - 5 year average | 5.80% |
| Pretax Margin - 5 year average | 4.10% |
| Free Operating Cash Flow/Revenue, 5 Year Average | 4.23% |
| Free Operating Cash Flow/Revenue, TTM | 4.67% |
| Net Profit Margin - 5 year average | 2.83% |
| Return on average assets - most recent fiscal year | 1.41% |
| Return on average assets - trailing 12 month | 1.41% |
| Return on average equity - most recent fiscal year | 3.24% |
| Return on average equity - trailing 12 month | 3.24% |
| Return on average assets - 5 year average | 1.73% |
| Return on average equity - 5 year average | 3.60% |
| Net Income/employee - most recent fiscal year | — |
| Revenue/employee - most recent fiscal year | — |
| Revenue growth rate, 5 year | 12.64% |
| EPS growth rate, 5 year | -8.87% |
| Growth rate% - dividend, 3 year | 10.16% |
| Revenue/share (5 yr growth) | 10.96% |
| Growth rate% - Revenue, 3 year | 7.03% |
| Growth rate% - EPS, 3 year | 63.86% |
| Book value per share growth rate, 5 year | 1.03% |
| Capital Spending growth rate, 5 year | 5.83% |
| Earnings Before Interest, Taxes, Depreciation & Amortization, 5 Year CAGR | 7.07% |
Financial forecast (AUD, millions except per share)
| Actuals | Estimates | |||||||
| 2026 | 2027 | 2028 | ||||||
| Estimate breakdown | ||||||||
Financials (AUD, millions)
| Period end: | JUN 22 | JUN 23 | JUN 24 | JUN 25 | JUN 26 |
| Fiscal year: | 2022 | 2023 | 2024 | 2025 | 2026 |
| Period length: | 12 months | 12 months | 12 months | 12 months | 12 months |
Announcements
| DATE | TIME | HEADING | PAGES |
| Price sensitive |
We start the week with three open positions, note the stops have been raised:
The Cleanaway board has said it will recommend shareholders accept the ~$6.9bn bid by Swedish private equity firm EQT and has granted EQT up to nine weeks of exclusive due diligence access. The deal is at an early, non-binding stage and is subject to due diligence, financing, regulatory clearance, and shareholder approval.
With investors looking to diversify their market exposure this morning, we’ve revisited an old market favourite which is now trading on the inexpensive side after a rough 12 months. So far in 2026, CWY is underperforming the ASX, trading down almost 8%, although it has bounced well off its lows more recently.
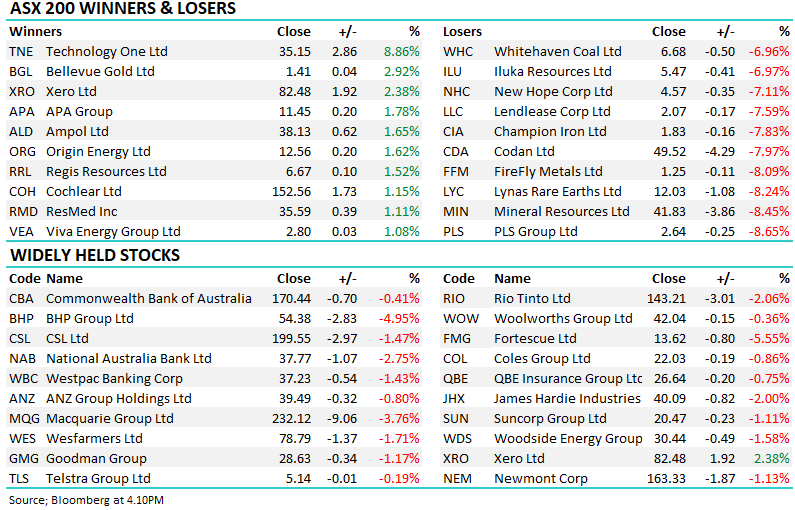
CWY +0.78%: The waste management company had a volatile session following the release of the 1H24 results this morning, which were slightly below expectations for the half, however, they maintained medium-term guidance which the market eventually took as a positive.
CWY has tracked lower over the last few months for no significant reason. The company, like many, has struggled with labour availability, however, there are signs these pressures are easing, and given the medium-term tailwinds around a greener world, coupled with the very high barriers of entry into this market, we continue to believe CWY is worth watching into further weakness.
We are tweaking the Flagship Growth Portfolio, selling an underperformer to buy a high quality tech stock.
The waste management company has been struggling since they reported FY23 results in August that were solid/in line with expectations. The issue was they put off providing a trading update and guidance until their AGM on the 20th of October, and we all know how markets hate uncertainty.
We are making multiple changes to the Flagship Growth Portfolio
CWY –4.14%: Fell today despite a solid/inline result while longer term guidance (EBIT to $450m but FY26) is aligned with current market thinking. FY23 revenue of $3.56bn compared to consensus of $3.52bn, EBIT of $302.2m above $298.8m expected.
CWY corrected -12% over 4-weeks from late June following its investor day, the aggressive selling may also have coincided with some EOFY book squaring, either way as we approach its report on the 24th the stocks again challenging its 2023 high.
Trade Idea: Buy Cleanaway Waste Mgt (CWY) using a limit of $2.69, with stops at $2.43, around 10% risk.
MM has turned bullish towards CWY around $2.40
MM is neutral CWY
MM is neutral toward CWY
MM are selling CWY in the Flagship Growth Portfolio, taking a loss around $2.35
MM is long and bullish toward CWY
MM are adding to CWY in the Flagship Growth Portfolio, targeting a 5% portfolio weighting around $2.50
MM is long & bullish CWY ~$2.55
MM is long and bullish toward CWY
MM remains long and bullish towards CWY

Cleanaway Waste Management is Australia's largest waste management business with a national footprint in the collection and disposal of waste. It is active in municipal and commercial and industrial waste stream segments and in nonhazardous and hazardous liquid and medical waste. While Cleanaway is allocating greater capital to waste processing and treatment, earnings remain skewed toward waste collection. The company is particularly strong in commercial, industrial, and municipal waste collection with strong market share in all large Australian metro waste collection markets.






Forgot password? Request a One Time Password or reset your password
One Time Password
Check your email for an email from [email protected]
Subject: Your OTP for Account Access
This email will have a code you can use as your One Time Password for instant access
A link to create a new password will be sent to the email address you have registered to your account.

Hi, this is only available to members. Join today and access the latest views on the latest developments from a professional money manager.

Our Smart Phone App will give you access to much of our content and notifications. Download for free today.
Hi, this is only available to members. Join today and access the latest views on the latest developments from a professional money manager.
JOIN NOW
Something went wrong. Please try again in a moment.