Author: james Carter
The IMF lowers world growth forecasts & commodities rally? Last night the International Monetary Fund (IMF) lowered world growth forecasts to 3.2% from 3.4%, a figure we still believe may prove optimistic. However, as these negative headlines hit the newswires there was no reaction from markets, the reason is simple – the IMF, like ratings agencies, are behind the curve unfortunately generally playing catch up to market economists/traders. For example world interest rates have remained rooted at historically low levels, indicating no anticipated imminent pickup in economic activity – German 2 year rates are at minus 0.514%. The market will tell you how it sees things going forward and this is where Market Matters looks for clues to the direction of markets. 1. Canadian S&P Composite Index Technically the ASX200 is tricky at present as weakness from the local banking sector has more than offset the strength in the resources sector. However, when we look at the highly correlated Canadian Index the picture becomes clearer. Short term we expect:
Show more…
You need to be a member to view this article
REGISTER FOR FREE INSTANT ACCESS
The CRB Index (Commodities Index) led stocks into significant falls in both the May / June and October / November periods last year, things are again looking interesting.
Risk v Reward Good Morning everyone U.S Markets were sold off overnight; -174pts on the DOW and the S&P fell -1.20%. It’s not a huge drop, but it’s interesting to think it’s the biggest one day decline since Feb 23. Cleary the market has been in bullish mode – and the rally has been strong and unrelenting. That said, we now see an imbalance between the potential risk of a market fall v the potential reward of further upside. We’re constantly looking at markets, stocks, sectors etc on the basis of risk v reward. Make an assessment of the potential upside v the potential downside for a given period. The potential reward should be a multiples of the risks. Right now, we see limited upside in U.S stocks and elevated risks of a downside move, primarily because of the recent market rally, and the upcoming Q3 earnings reports in the States – which start next week. That doesn’t mean the market can’t go higher, and we’ll be deemed wrong if it does, it simply means it’s prudent, sensible whatever else you want to call it to increase cash in such an environment. Not a lot of new information to ponder this morning, so a reasonably short report… Here’s the moves in the U.S overnight by sector – the defensive sectors seeing most money …and the S&P 500 – seems to be topping out. The questions remains whether we’ll get one more blow off top before it rolls over or we’ve now started the pullback. ….and the Volatility Index – which has been extremely low. Buying Put Options has been very cheap due to low volatility Summary
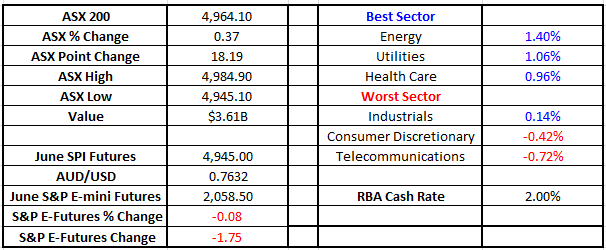
Short selling at record highs in the U.S Good Morning everyone Overview U.S Markets were up overnight, +112pts on the DOW, and +1.05% on the S&P 500. Futures here are tipping an + 18pt rally which comes on the back of a +21pt move higher yesterday – the ASX 200 now sits at 4945. The U.S market still looks strong – that’s fairly obvious to see. At Market Matters, we think there are obvious risks over the next month or so around U.S reporting as we’ve detailed recently. One of the other obvious trends in the U.S is the magnitude of short interest in stocks. Recent reports suggest that short interest is around $1 trillion – and is now at the highest level since (pre-GFC). More than 4.3% of the S&P is currently short sold. This is actually a bullish short term sign and may be one reason why the U.S has stayed very resilient in the face of obvious headwinds. If there are significant amount of shorts outstanding – and they’ve been increasing over time, it means a couple of things;
Really bullish, there's more to go in the reflation rally

Please enter your login details
Forgot password? Request a One Time Password or reset your password
One Time Password
Check your email for an email from [email protected]
Subject: Your OTP for Account Access
This email will have a code you can use as your One Time Password for instant access
To reset your password, enter your email address
A link to create a new password will be sent to the email address you have registered to your account.
Enter and confirm your new password
Congratulations your password has been reset
Sorry, but your key is expired.
Sorry, but your key is invalid.
Something go wrong.

Only available to Market Matters members
Hi, this is only available to members. Join today and access the latest views on the latest developments from a professional money manager.

Smart Phone App
Our Smart Phone App will give you access to much of our content and notifications. Download for free today.

