Author: james Carter
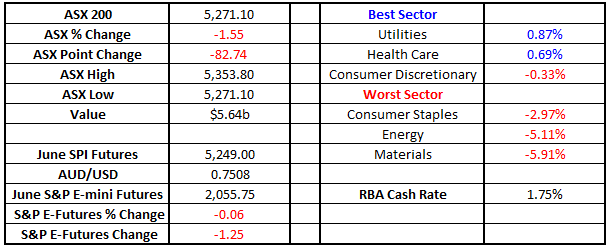
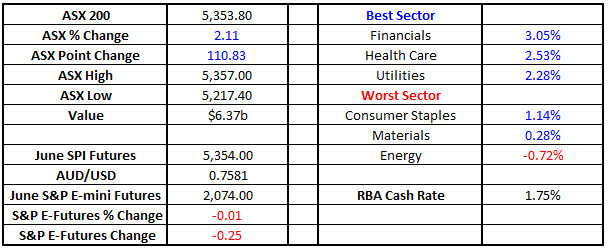
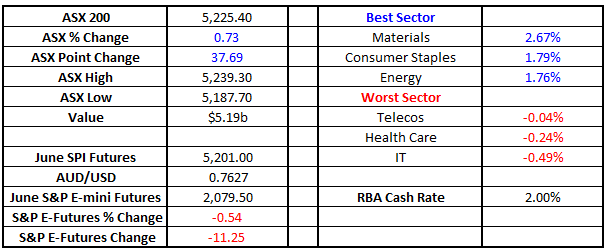
The RBA unleashes a beast! Please excuse two consecutive titles with exclamation marks however yesterday was no ordinary day for the ASX200. The local market was trading up around +30 points at 2.30pm yesterday following our script nicely of banks up and resources lower, then BANG the RBA surprisingly cut interest rates to 1.75%, the lowest level in history. The impact on high yielding stocks was almost unprecedented with the market surging an additional 80 points led by the banking sector which closed up over 3% for the day, after actually opening in the red. ANZ had an amazing +8.4% turnaround, hopefully some subscribers managed to get on board from our alert. There was literally only a few minutes window of opportunity. The market is already looking for another rate cut from the RBA as they rarely cut once in isolation – the futures market is pointing to a better than even chance of a second cut by August to 1.5%. This morning we’ve turned on our Bloomberg machines to see US equities down almost 1% and the SPI futures pointing to a 40 point fall for the ASX200 on the open led by BHP which is down ~~$1 (4.8%) in the US. With such volatility in world markets its time to again clarify how we currently see equities going forward. ASX200 Daily Chart
Ouch we’re long Westpac! Yesterday certainly fitted that old sporting adage for Market Matters – “a game of two halves”. Regis Resources (RRL) Firstly we were able to realise excellent profits – around +27% by selling our Regis Resources (RRL) over $3 yesterday, a position that was initiated on the 17th of March. Selling is a weakness of many investors who unfortunately fall into the habit of “running losses and cutting profits”. We are more aligned with the motto “plan your trade and trade your plan” – obviously the word trade can be replaced with investment. When we purchased RRL the plan was to take profit over $3 unless circumstances had changed; they had not hence we sold. Overnight gold initially rallied strongly over $US1300/oz before falling away and closing slightly lower – gold ETF’s were down 1.7% in the US. Our view is gold is likely to retrace back towards the $US1200/oz area in coming weeks / months where we currently intend to buy back into the sector. Statistically May is the strongest month for the $US since the GFC which is clearly a negative for gold. This correlation may be linked to seasonal factors like – weak stocks and commodities plus U.S. economic data often improving in May aided by weather. Either way statistics like this should be respected, and we are comfortable watching gold at present. Also remember we have no ego with investing and will happily buy RRL back at higher prices if we perceive good risk / reward – just like we did this time! Gold Weekly Chart
Looking at 3 recent underperformers as potential “catch up” stories. So far 2016 has been the year where stocks that have been the significant underperformers have dramatically become the market darlings on a combination of changing economic circumstances and aggressive short covering. Some noticeable examples of this are in the resources and energy sectors e.g. BHP +16%, RIO +15%, FMG +82% and STO up 30%. Many hedge funds that have enjoyed significant profits from short positions in these sectors over recent quarters / years have been forced to cover sending these heavyweights soaring. One day gains of 5-6% have occurred on the back of ‘less bad’ corporate news or simply mass short covering. This morning we are looking at three stocks that still have large short positions and have the potential to emulate our miners / energy stocks. We have deliberately chosen three stocks that we do not discuss often but may “squeeze” higher if the correct circumstances unfold as hedge funds are now clearly more trigger happy to cover shorts. However it should always be remembered that hedge funds are professional investors who often get it right, all 3 of the stocks we are looking at have been in downtrends for a number of years, hence prudent money management must be used when playing in this space. Note; short covering is when traders who have sold a stock they do not own, hoping to profit by buying back cheaper, repurchase that sold stock. Orica (ORI) Monthly Chart
Sell in May and go away” is looming for stocks, is 2016 different? Over the last 64 years the Dow Jones has on average been down between May and October, compared to significant gains between November and April – the take out from those numbers is not rocket science. The regularly quoted phrase that brokers / investors commence citing at this time of year….”sell in May and go away”, clearly does have some foundation. As we all know most statistics can be structured to tell the story the commentator is spruiking so today we will attempt to be totally objective when applying this seasonal factor to today’s markets post the GFC, while keeping everything simple:
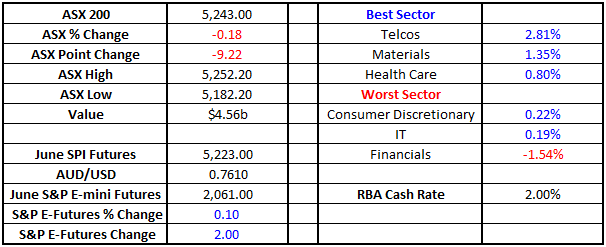
Inflation collapses and people mention the “D” word Australia’s extremely weak inflation numbers released at 1130am yesterday shook the markets to their core with the $A plummeting from 77.5c to 76c as a rate cut, potentially as soon as next Tuesday, became a very strong possibility. This was the first fall in inflation since 2008 and totally unexpected. Initially equities embraced the possibility of an imminent rate cut sending the ASX200 up ~60 points before the larger concern of deflation hit home and aggressive selling, primarily focused on the banks, took hold reversing the market almost 100 points / -1.8% to close down 33 points. The actual fall was not that concerning especially with the Dow futures pointing to an APPLE led retreat and most of Asia also giving up early gains but if the market does take deflation as a serious threat things could get ugly for equities. If inflation keeps falling banks are likely to struggle to maintain margins and bad debts will rise as unemployment increases – a vicious cycle which makes the economy weaker. The RBA will be very conscious of this and we’re starting to see changing expectations around a cut next week….NAB the latest to change their official forecast from no change in the cash rate to a 0.25% cut next Tuesday. So far the Australian bond market is not as excited about future rate cuts as it was in April of 2015 when 3 year bond yields were trading ~1.6% – see chart 1. Australian 3 year Bonds Daily Chart
Really bullish, there's more to go in the reflation rally

Please enter your login details
Forgot password? Request a One Time Password or reset your password
One Time Password
Check your email for an email from [email protected]
Subject: Your OTP for Account Access
This email will have a code you can use as your One Time Password for instant access
To reset your password, enter your email address
A link to create a new password will be sent to the email address you have registered to your account.
Enter and confirm your new password
Congratulations your password has been reset
Sorry, but your key is expired.
Sorry, but your key is invalid.
Something go wrong.

Only available to Market Matters members
Hi, this is only available to members. Join today and access the latest views on the latest developments from a professional money manager.

Smart Phone App
Our Smart Phone App will give you access to much of our content and notifications. Download for free today.

