Skip to Content

Author: james Carter

Tax loss selling is close at hand People can use statistics to make any argument and one we have recently been hearing quoted often is “sell in May and go away”. If we simply look at an average fall of over 6% between May and June for the last 6 years, why would you own equities today? If we combine this statistic with looming geopolitical risks and rich valuations, a move to cash becomes an easy one for any nervous investor. However, while there is no doubt that the best seasonal period for equities is November to April, holding no equities from May makes zero sense to us. Since 1929, the S&P500 has gained 5% from November to April and 1.87% from May – October. Importantly, that’s still a reasonable average gain for the approaching months. We remain bullish US stocks, targeting fresh all-time highs in 2016, the anticipated path is portrayed on the below chart. A few potential catalysts are looming to propel this move e.g. A no Brexit vote, Trump falling behind in the polls or the US economy continuing to improve.
Show more…

You need to be a member to view this article

REGISTER FOR FREE INSTANT ACCESS

The market throws us another hand-grenade Yesterday we saw Flight Centre’s (FLT) shares slammed almost 9% after a significant downgrade to its previously forecast profit guidance. Some of the market clearly “had a sniff” of the problems at FLT, with the stock already weak. It’s now being down 14.8% for the month and 27.3% over the past year. This is a classic example of why Market Matters is a firm believer in the combination of both fundamental and technical analysis. People that are “in the know”, vote with their feet / money creating technical signals, which can be very useful in both entry and exiting of investment positions – often the fundamental news follows well after the stock move. We believe this individual stock volatility is likely to be an ongoing phenomenon in 2016, hence providing some exciting opportunities. The ASX200 is up 0.4% before dividends in 2016, yet we have already witnessed plenty of individual share swings of well over 10%.
Show more…

You need to be a member to view this article

REGISTER FOR FREE INSTANT ACCESS

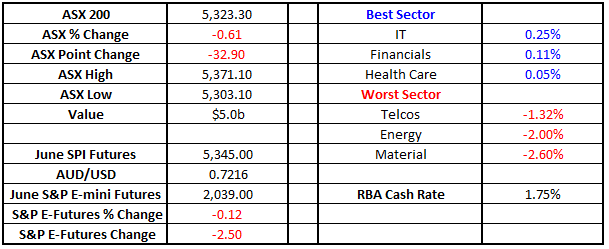
Healthcare continues to outperform in Australia Whether we consider the last week, or the last 12months, the Australian Healthcare Sector remains a shining light on the local stock market. As would be expected there are some blemishes within the sector, with Ansell (ANN) and Primary Health Care (PRY) experiencing a disappointing 12 months. However, overall the sector remains in the black for the last 12 months, while the ASX200 is down 5.5%. The obvious fundamentals of a population continuing to grow and enjoy better quality health conditions remain firmly in play. The concern with the sector has been the same for a lot of investors over recent years and remains today, relatively high valuations and low dividend yields compared to the market as whole. However, if a company is growing and increasing earnings per share, both of these concerns dissipate very rapidly. ASX200 Health Care Index Quarterly Chart

Flexibility, open mindedness, patience & being prepared to sell are all required for successful investing We have had a number of subscribers question our shift in opinion for a +20% correction from equities in 2016, to more likely in 2017. This evolution of our view has been discussed a few times over recent week, but the questions continue (we love questions so please continue!) hence we will attempt to explain more fully / clearly our current stance today. We are forecasting a major correction to the rally in US equities since March 2009, which as the below chart illustrates has seen a 320% appreciation before dividends for US stocks. The million dollar question is when and from where? Simply until further notice, we believe that US stocks will complete the classic “Phase 5” to a bull market, which should take the S&P500 towards the 2300 area, or over 10% higher. This view has twice rewarded us over recent times after we aggressively bought equities when the S&P500 challenged the low 1800 region – interestingly we remain 12.7% above that area today. S&P500 Cash Monthly Chart We must look at a combination of the current market swings and the fundamental back drop to explain our short term positive view. Our previous view that equities would top out in 2016 was established around the anticipation of a blow off top in the S&P500 towards 2200 and the backdrop of looming geopolitical risks. However, the S&P500 has tested the 2135 all-time high over recent weeks and has consolidated its ~16% advance since early December, an overall positive outcome in our opinion. S&P500 Cash Daily Chart There is a story in today’s AFR that Auscap Asset Management is sitting in 50% cash, similar to ourselves recently.
Show more…

You need to be a member to view this article

REGISTER FOR FREE INSTANT ACCESS

Five charts we are watching very carefully at present Some significant macroeconomic news hit the market last night with the FOMC (Federal Open Market Committee) minutes implying a US Fed interest rate rise as early as June, was a strong possibility. This announcement and subsequent interpretation sent the $US to a 7-week high, the Dow down over 100 points from its intraday high and commodities lower, led by the gold which fell almost $US20/oz. Also, two Fed officials who were interviewed yesterday said they anticipated 2 or 3 interest rate rises in 2016, if the data continues in the same firm manner. However they are concerned that investors have not factored these rate rises into their forward thinking. These movements coincide perfectly with our short term view on markets, which is a pullback in gold to the US1,200/oz area (~5%), a pullback in US stocks towards 2000 for the S&P500 (~1.5%) and further strength in the $US Index potentially over 111 (~6%). Noticeably, these numbers say we believe that US stocks will absorb higher rates comparatively well. S&P500 Futures “Death Cross” Monthly Chart As we can see in the above chart, the S&P500’s 50-week moving average is getting close to falling beneath its 100-week. While this is clearly a lagging indicator it’s called a death cross for a reason, the last two times it followed through the corrections for equities were very significant. It’s our current opinion that this sell signal will NOT be generated, but the potential must not be ignored.
Show more…

You need to be a member to view this article

REGISTER FOR FREE INSTANT ACCESS

Back to top