Skip to Content

Author: james Carter

What do we think of Hybrid Securities? Yesterday we saw NAB announce a new Hybrid Security in an effort to raise around $750m of tier 1 capital. This comes on the back of two successful deals from Westpac about a week ago, and Commonwealth Bank in early April. However, not all Hybrids have been successful as those holding the CBAPD, which was issued back in 2014, can attest. With over $900bn sitting on term deposit in Australia earning peanuts, and an aging population that requires income to sustain lifestyle, these securities can offer an attractive alternative, however they are not without risk. In today’s note we’ll give an overview of these securities in general terms, what we need to be conscious of, compare a few different issues and whether or not they’re worthwhile considering in a portfolio. What is a Hybrid? A hybrid is a security issued by a Bank or other corporate to raise capital. Unlike a straight equity or a straight bond, these securities combine a bit of both and as such fall somewhere in between on the risk/return spectrum. They trade on the ASX under five letter codes, can be bought/sold at any time (liquidity permitting), and can offer investors a very good yield (~6-7%) and generally have less volatility than the underlying equity. We think the best, practical way of providing insight here is to look at a number of different issues, outline their structures and whether or not we see any value. Capital Structure Firstly though, to give a basis for this discussion we need to understand a company’s capital structure.
Show more…

You need to be a member to view this article

REGISTER FOR FREE INSTANT ACCESS

Where do we believe local interest rates bottom out? On a very quiet morning when both the US and UK have enjoyed long weekends, we thought we would revisit the potential path for Australian interest rates. Investors typically have short term memories and forget markets are cyclical. Iron ore should be a great reminder – from $US15/t to $US190/t and back under $US40/t, all in 12 years! Official Australian interest rates are today at the all-time lowest level of 1.75%, with markets factoring in a 100% expectation of another cut in 2016. A very quick glance at the chart below shows that local interest rates were over 17% around 25 years ago. It’s a very dangerous assumption to make that rates in Australia cannot get back to at least 5%, in the next 5-10 years. The RBA Official Cash Rate Monthly Chart When we look at the 3-year bond chart, going back to 1990, the pattern is concerning on a medium term time frame. Prices are rising (hence yields are falling) in a classic rising wedge structure, which is ultimately a topping style pattern. In other words 3-year bonds are likely to grind a little higher, potentially again testing the overhead resistance red line, BUT they are likely to eventually break hard and aggressively back towards the 94.00 area.
Show more…

You need to be a member to view this article

REGISTER FOR FREE INSTANT ACCESS

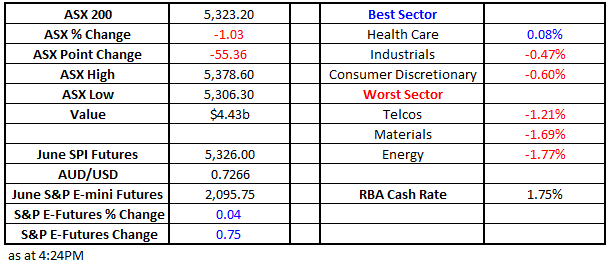
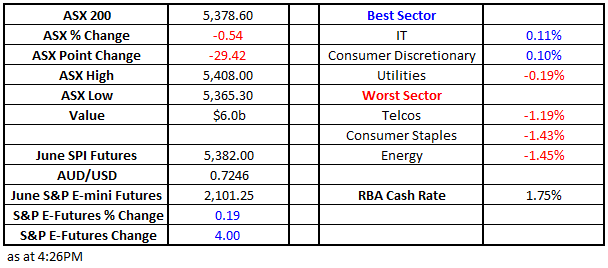
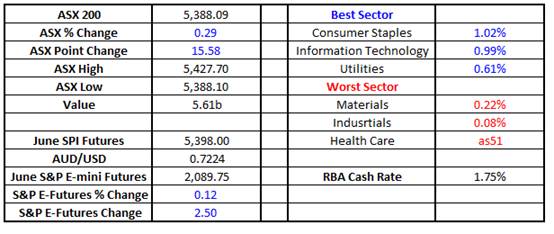
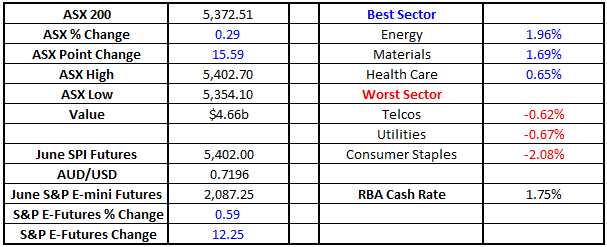
Market Data What Mattered Today As expected ahead of the US Memorial Day holiday, the local market was extremely quiet today, closing 2 points higher at 5408 and only trading within a very tight 24 point range. Volumes were also low, as the ASX200 hovered around the 5400 area, looking for a catalyst to drive it out of the recent holding pattern. As was outlined in this morning’s report June, and especially the first few weeks, are normally soft for local stocks so this week should prove interesting. ASX200 Intraday Chart The gold sector was the standout for all the wrong reasons as it got whacked, following the precious metal in Asia which fell ~1% to test the $US1200/oz area. Newcrest closed down 1.5% and Northern Start (NST) 5.8%. Regis Resources (RRL) fell into our initial buy level today, hitting $2.81, and we allocated 5% of our portfolio to the stock ~$2.83. We intend to average if weakness continues towards $2.50, but also a quick spike back over $3 may force us to take a quick 6-7% profit – watch for trading alerts. Regis Resources (RRL) Weekly Chart Stocks & Sectors Today Source; Bloomberg ASX 200 Movers **Note US share markets are closed for Memorial Day

What does June usually bring for the Australian index? So far, “sell in May and go away” is having a poor time, with the ASX200 up almost 3% for the month and only two trading days remaining. We have discussed a few times the vagaries of individual stock movements in June as we approach the end of the Australian financial year, but today we are going to look closely at how the index performs both in and throughout June for any clues to how investment decisions should be skewed over the coming weeks. The monthly chart below shows that the we have experienced 5 decent tops in April / May, since the GFC (not this year), but June does not initially standout with an obvious trend. Since the GFC bottom in June 2009, the ASX200 has fallen 5 out of the 7 years for an average loss of close to 90 points, or ~2%. Not a surprising outcome, considering the reputation of “sell in May”. It’s clearly easy to see why the bears are getting excited when we combine this statistic with the elevated valuations of local stocks, plus the geopolitical risks looming. ASX200 Monthly Chart Subscribers to Market Matters know we remain bullish US equities, targeting fresh all-time highs in 2016, but we are open minded to its direction over June. The main reason we are bullish short / medium is the sheer weight of cash on the sidelines. Investors are underweight equities, which is not the typical circumstance for a decent top – not surprisingly China remains a scary wildcard for us. S&P500 Monthly Chart We spent a few hours scouring the internal characteristics of trading for the ASX200 throughout June since the GFC with a little success.
Show more…

You need to be a member to view this article

REGISTER FOR FREE INSTANT ACCESS

5 Moves We’re Considering Seriously As We Approach the End of a Tough Financial Year for Stocks As you all know, we remain bullish US equities, targeting fresh all-time highs with a likely 5-10% further upside. If this view (illustrated below)is correct, there remains some opportunities for buyers with good stock selection and entry levels. The US Memorial Day weekend is basically upon us and not surprisingly, markets have gone quiet, but it’s time to be on alert as markets often experience large moves at the start of the month and June starts next Wednesday. We have been asked to clarify our anticipated investing moves during June so here are 5 plans currently on our radar at this moment in time. S&P500 Monthly Chart Primary Health (PRY) Monthly Chart We are bullish PRY, targeting the $5 area. Normally we would simply allocate 5-10% into the stock, with a $3.20 stop. However, PRY is down over 28% over the last 12 months, making it an ideal candidate for tax loss selling in June, hence we are being patient at present and hopefully not too clever! Spotless Group (SPO) Weekly Chart SPO, the cleaning and catering company, has experienced a simply awful year falling over 50% in the last 12 months. We are considering an aggressive, but small position if the stock is crunched down towards 80c in June. QBE Insurance (QBE) Monthly Chart QBE has been a “landmine” stock more than once over recent years, but technically we like the stock at present, with stops under $11.
Show more…

You need to be a member to view this article

REGISTER FOR FREE INSTANT ACCESS

Will Iron Ore and Oil continue to diverge? Last month when iron ore spiked up around $US70/tonne and oil was trading in the low $US40/barrel region, we called for a downturn in commodity prices, caused by a strengthening $US, but oil would remain firm. So far this view has unfolded perfectly with iron ore falling ~28% and gold ~6%, however oil has risen ~15%. Simply, while the $US has an enormous impact on commodity prices, it is not a larger influence than basic supply and demand. The big question is do we believe iron ore will continue to fall, while crude oil can / will rally? The best way to address this fundamental question is to look at the two commodities individually. Iron Ore made a 3 month low last night, but remains over 20% above the lows of last December. We believe the risks remain firmly on the downside, with fundamental concerns around the Chinese economy likely to resurface again in the medium term. Any worries around China are likely to hammer iron ore, as they did recently in the December / January period. We believe iron ore will challenge the $US30-35/tonne region this year. Hence, we currently have no interest in buying stocks like BHP, Fortescue (FMG) and RIO. Iron Ore Monthly Chart Crude oil has remained firm over the last 6 weeks and last night, challenged the psychological $US50 barrel area.
Show more…

You need to be a member to view this article

REGISTER FOR FREE INSTANT ACCESS

Back to top