ASX rips higher – best day in 15 months (WSA, FMG, LOV, CTX)
WHAT MATTERED TODAY
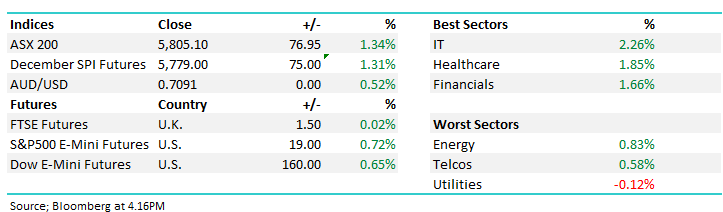
A bullish day for Aussie stocks and once again we’re seeing some obvious backbone from the local index despite weakness overseas. We often see the Australian market find a low before the US and despite US markets finishing in the red last night, they did better than the news flow around trade should have implied. US Futures were firm throughout our session as were Asian markets however it was the local index that seemed to lead the way today.
Risk was back on the table and growth stocks did well + we saw some big reversals intra-day from some of the beaton down names of recent times – even some of the retailers had a day in the sun. While we wrote this morning that we were mildly bullish the ASX 200 targetting 5900 in the short term + we suggested that we felt the ASX would improve throughout the day relative to its open, a move of +152pts in the SPI Futures from the 5620 low to 5772 close was a more bullish move than we had pencilled in, although we’re positioned for it, and we’ll take it with both hands.
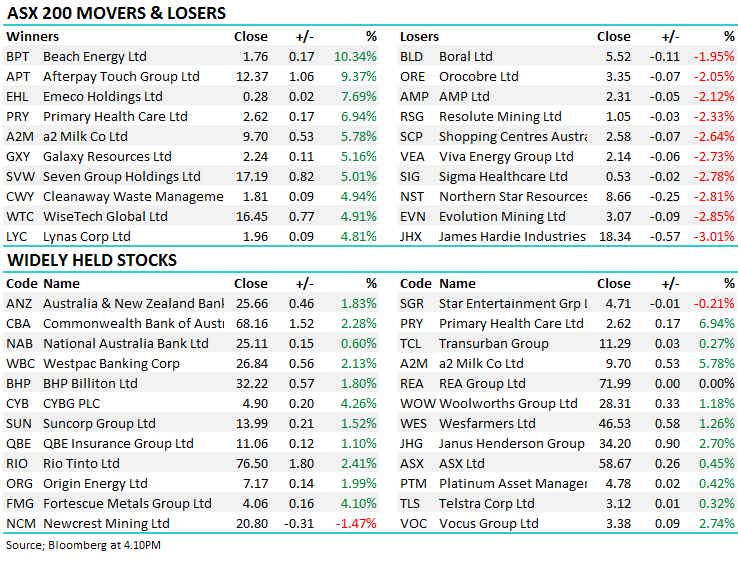
Looking at the TOP 10 from the ASX 200 shows where money flowed today – squarley towards growth…
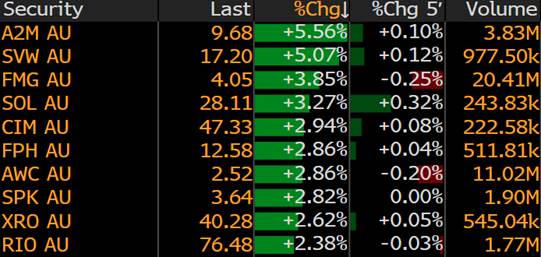
Source; Bloomberg @ 4.05pm
Also interesting to see where money flowed within the influential banking sector on a bullish day…WBC is the cheapest bank and saw most flow however clearly NAB was on the outer. NAB is cheap however its dividend is most at risk if housing weakness intensifies…
Banks relative performance
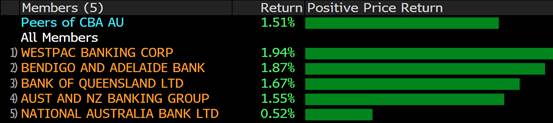
Source; Bloomberg @ 4.05pm
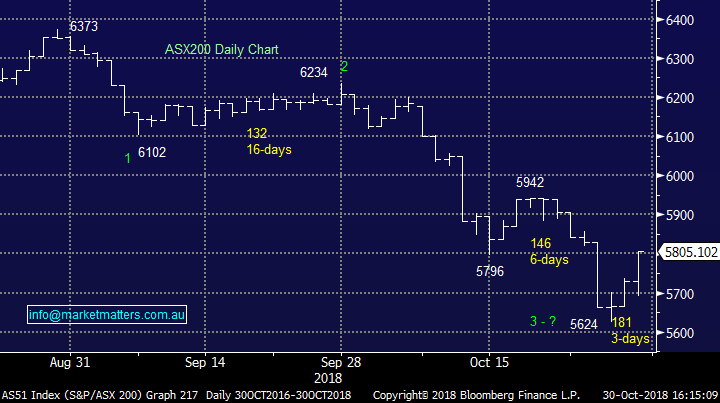
Today, the ASX 200 closed up +76 points or +1.34% at 5805. Dow Futures are up +160points or +0.66%
ASX 200 Chart – market grinded higher throughout the session
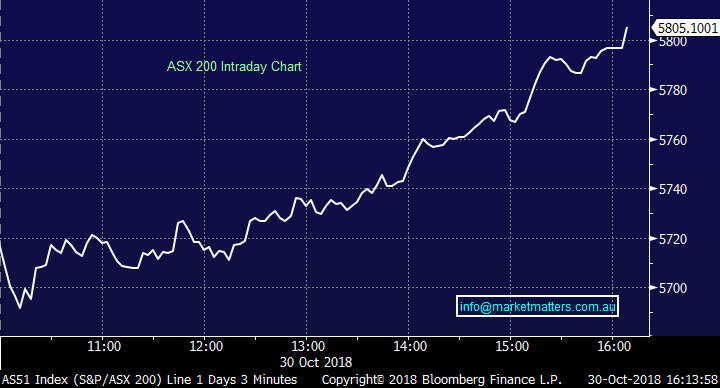
ASX 200 Chart
CATCHING OUR EYE
Broker Moves; We touch on the trends outlined by Bells today RE FMG below with the broker saying Fortescue Price Discount Overhang May Be Peaking…We tend to agree, while universal upgrades for Beach Energy (BPT) today saw that stock rip up by +10%.
RATINGS CHANGES:
· Perpetual Upgraded to Neutral at UBS; PT A$33.50
· Z Energy Upgraded to Outperform at Macquarie; Price Target NZ$7
· Evolution Mining Cut to Hold at Morgans Financial; PT A$3.28
· Beach Energy Upgraded to Neutral at Macquarie; PT A$1.65
· Beach Energy Upgraded to Overweight at JPMorgan; PT A$2.10
· Beach Energy Upgraded to Buy at Goldman; Price Target A$1.95
· Beach Energy Upgraded to Hold at Canaccord; PT A$1.79
· Orocobre Rated New Market Perform at BMO; PT A$3.75
· Seven West Upgraded to Hold at Morningstar
· SCA Property Downgraded to Sell at Morningstar
· SCA Property Cut to Neutral at JPMorgan; Price Target A$2.70
· Independence Group Raised to Neutral at Credit Suisse; PT A$3.95
· Independence Group Raised to Buy at Argonaut Securities
· Watpac Downgraded to Hold at Morgans Financial; PT A$0.92
· Altium Upgraded to Buy at Bell Potter; PT A$23.50
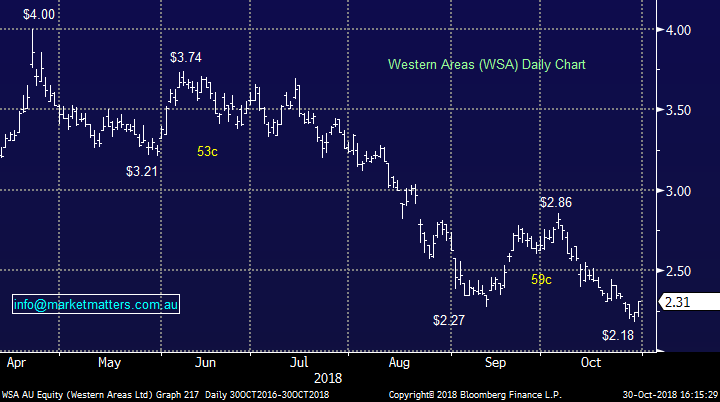
Western Areas (WSA) $2.31 / 3.13%; The latest addition to the MM Growth Portfolio WSA released production numbers this morning, showing a solid start to FY19. In short all guidance metrics on track with the company delivering the best result in 9 months in terms of nickel concentrate. WSA has put out FY19 Guidance during August and to date all metrics are well within those guided ranges. They also made the call the mine at Odysseus with growth capital expenditure associated with FY19 to now increase $12M to reflect the upgraded work program – all okay.
Technically, WSA looks very interesting after rejecting a new low to close strongly this afternoon. MM are bullish WSA from current levels.
Western Areas (WSA) Chart
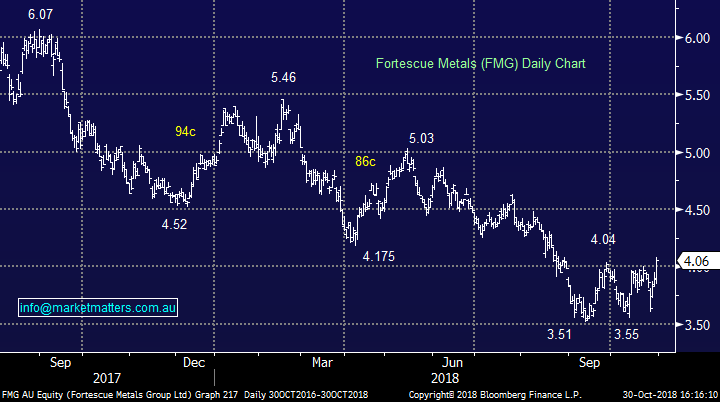
Fortescue Metals (FMG) $4.06 / 4.01%; A bullish move for Fortescue today despite BHP coming out with negative comments around growth as a consequence of the China / US trade tensions. The miner's chief commercial officer Arnoud Balhuizen said the recent trend toward protectionism would have negative impacts on both the Chinese and US economic growth over the next two years. "Our modelling indicates that the negative impact of Sino-US trade protection on Chinese GDP growth will fall in the range of a half (0.5) to three quarters (0.75) of a percentage point," he said. "The expected gross negative impact on the US also falls within that range. Which confirms that the trade protection will create a lose-lose outcome."
However, he went onto say that it has not yet seen any "material" impact on its business…hmmmm
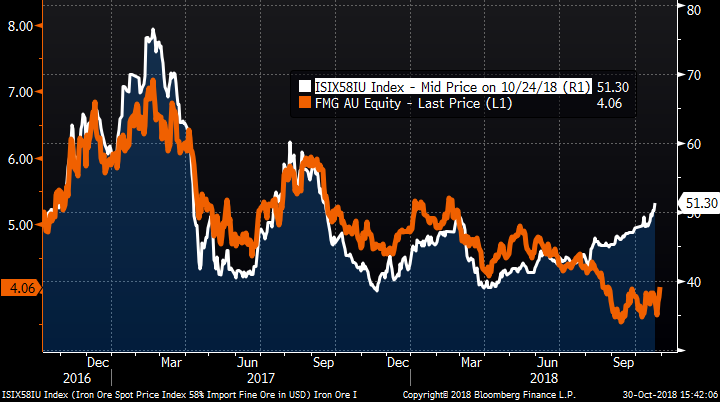
The most interesting chart in terms of FMG at the moment seems to be disconnect between the price of lower grade Iron Ore and the FMG share price. Much has been made about the miners lower quality ore and Chinese mills snubbing the input, which was true to an extent however prices don’t lie and clearly from the rising white line (price of low grade ore) we can see demand is starting to return, and thus FMG share price should follow.
Fortescue Metals (FMG) versus 58% iron Ore price
Fortescue Metals (FMG) Chart
On the flipside, Lovisa (LOV) and to a lesser extent Caltex (CTX) were weak today after market updates;
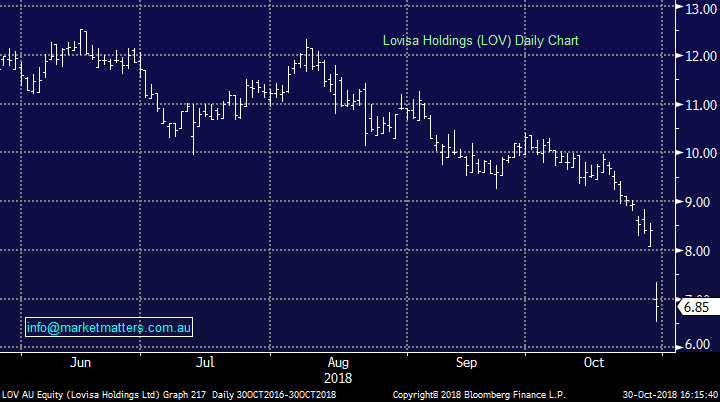
Lovisa (LOV) $6.85 / -18.45%; Fell around 20% taking the total decline from the June highs to nearly 50%. At the company’s AGM, they said same store sales would be lower than previously expected, well below longer term targets. Over the past few years, Lovisa has managed incremental gains to same store sales, often growing between 3-5% each year. After a poor start to FY19, the company has seen comparable sales falling -0.9% on last year. The company did note “that both Spring Racing and especially Christmas are still to come and play a very large part of both our first half and full year’s performance.”
The jeweller blamed a lack of wage growth as well as rising interest rates & falling house prices as contributing factors to the general soft retail environment which has already caused a number of names to lower expectations over the past few weeks. Lovisa is turning to store number growth and lowering costs to limit the impact soft same store sales growth will have, however on 16x FY19 earnings post today’s drop, there is still some optimism built into that multiple.
Lovisa (LOV) Chart
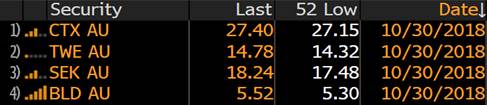
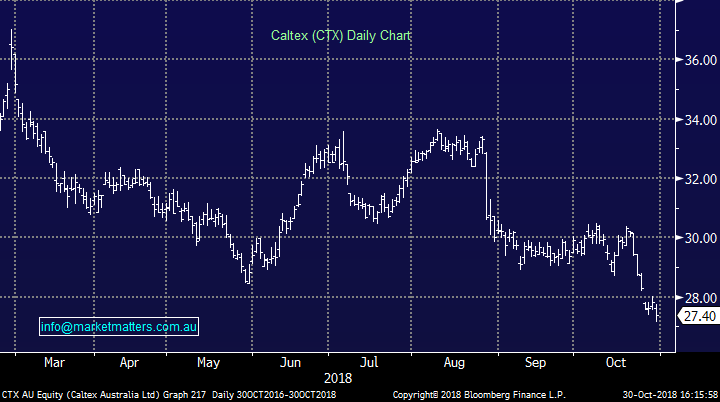
Caltex (CTX) $27.40 / -1.58%; 4 stocks from the ASX 200 traded down to a 52 week low today, CTX was one of them…
Stocks trading at 52 week lows
The fuel refiner and retailer Caltex lifted their payout ratio in what looks like an effort to unlock some value in the large franking credit balance the company holds. Caltex have been eying off ways to return excess capital to shareholders as their transformation nears completion, and in their investor day presentation today, they announced the increase in pay out while also mentioning their “preferred method of incremental capital returns is via an off market buyback.” Caltex has over $900m worth of franking credits on the balance sheet, and clearly, there is a desire to realise this value for shareholders – a matter that has become more pressing with recent plans by Labor to cease cash refunds on franking credits.
Along with the pay out ratio changes, CTX updated refiner margins for the September quarter with realised margins rising from the previous quarter, but that was off a low base and they remain lower than the same time last year. Sales were also softer for the quarter due to outages at the Lytton facility.
Caltex (CTX) Chart
OUR CALLS
No changes to the portfolios today.
Have a great night
James / Harry & the Market Matters Team
Disclosure
Market Matters may hold stocks mentioned in this report. Subscribers can view a full list of holdings on the website by clicking here. Positions are updated each Friday, or after the session when positions are traded.
Disclaimer
All figures contained from sources believed to be accurate. Market Matters does not make any representation of warranty as to the accuracy of the figures and disclaims any liability resulting from any inaccuracy. Prices as at 30/10/2018
Reports and other documents published on this website and email (‘Reports’) are authored by Market Matters and the reports represent the views of Market Matters. The MarketMatters Report is based on technical analysis of companies, commodities and the market in general. Technical analysis focuses on interpreting charts and other data to determine what the market sentiment about a particular financial product is, or will be. Unlike fundamental analysis, it does not involve a detailed review of the company’s financial position.
The Reports contain general, as opposed to personal, advice. That means they are prepared for multiple distributions without consideration of your investment objectives, financial situation and needs (‘Personal Circumstances’). Accordingly, any advice given is not a recommendation that a particular course of action is suitable for you and the advice is therefore not to be acted on as investment advice. You must assess whether or not any advice is appropriate for your Personal Circumstances before making any investment decisions. You can either make this assessment yourself, or if you require a personal recommendation, you can seek the assistance of a financial advisor. Market Matters or its author(s) accepts no responsibility for any losses or damages resulting from decisions made from or because of information within this publication. Investing and trading in financial products are always risky, so you should do your own research before buying or selling a financial product.
The Reports are published by Market Matters in good faith based on the facts known to it at the time of their preparation and do not purport to contain all relevant information with respect to the financial products to which they relate. Although the Reports are based on information obtained from sources believed to be reliable, Market Matters does not make any representation or warranty that they are accurate, complete or up to date and Market Matters accepts no obligation to correct or update the information or opinions in the Reports. Market Matters may publish content sourced from external content providers.
If you rely on a Report, you do so at your own risk. Past performance is not an indication of future performance. Any projections are estimates only and may not be realised in the future. Except to the extent that liability under any law cannot be excluded, Market Matters disclaims liability for all loss or damage arising as a result of any opinion, advice, recommendation, representation or information expressly or impliedly published in or in relation to this report notwithstanding any error or omission including negligence.


