ASX 200 ends April up 3.88% – best month in the last 7 (AMP, PPT, WBC, NST, WSA, A2M)
WHAT MATTERED TODAY
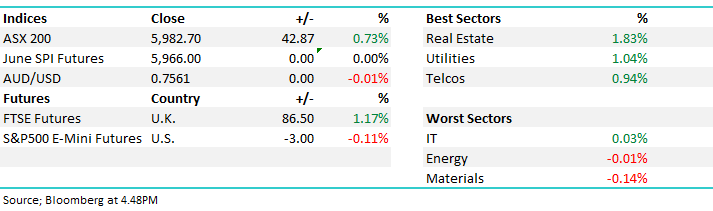
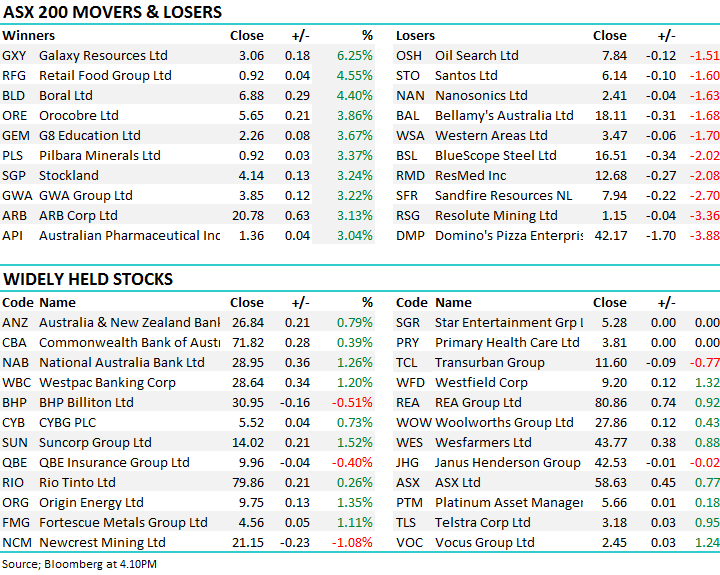
The local market continued on its bullish tilt today to end the month with the ASX 200 trading just 9pts below the psychological 6000 mark – up +29pts on the session or +0.49% to close at 5982. Banks seeing some further respite with the big 4 accounting for +10 index points of today’s gain while some of the recent ‘dogs’ started to show signs of life as fund managers look for perceived value – the likes of G8 Education (GEM) putting on +3.67% was interesting while we also saw some reasonable buying amongst the Lithium names, Galaxy (GXY) the standout after a slow start adding +6.25% while strong moves were also seen in Orocobre (ORE) which added +3.86% to $5.65 – Kidman (KDR) though lagged, adding just 1c to $1.975.
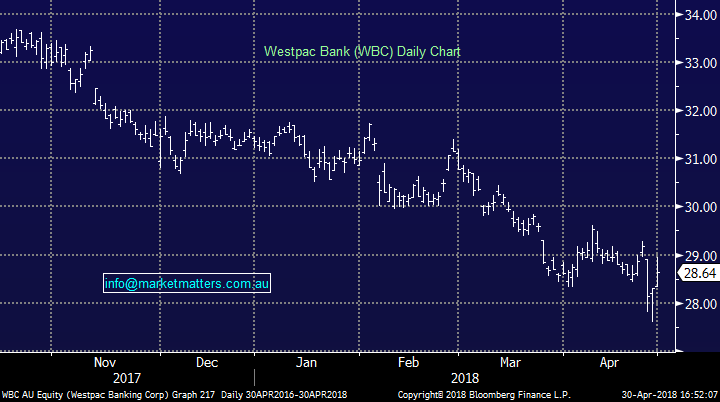
Elsewhere, a flow of mining quarterly reports kept the desk busy while better than feared credit growth numbers saw the banks well bid + an article from Chris Joye in the AFR debunking the bearish UBS note on Westpac (WBC) also helped the sector – Westpac & NAB the outperformers adding 1.20% and 1.26% respectively.
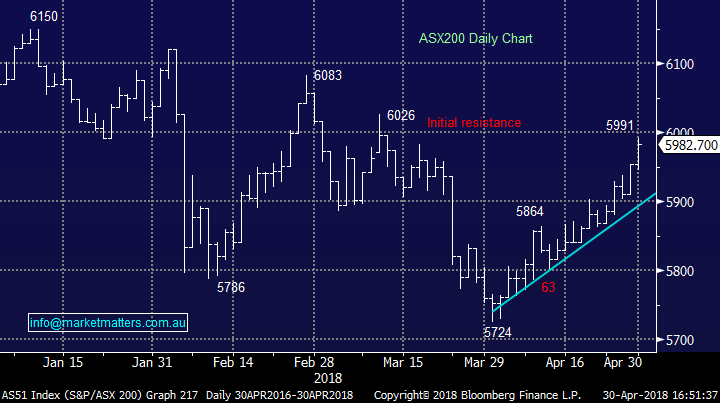
ASX 200 Chart
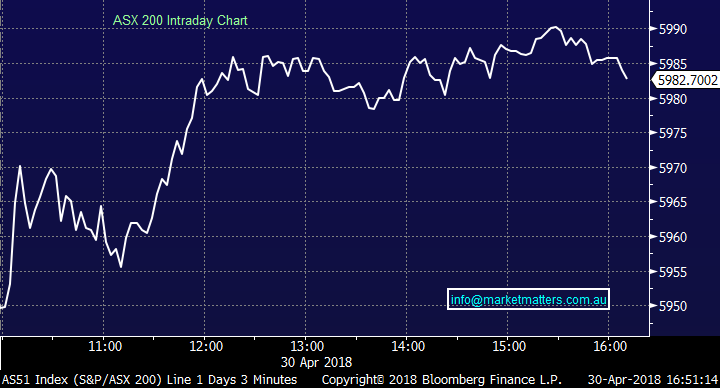
ASX 200 Chart
CATCHING OUR EYE
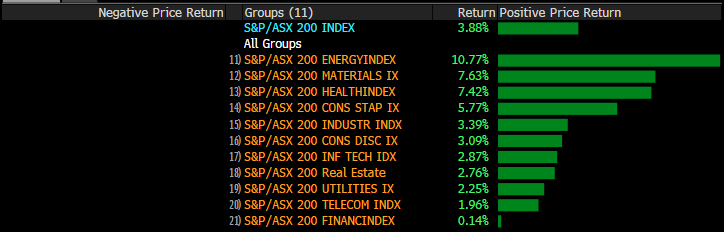
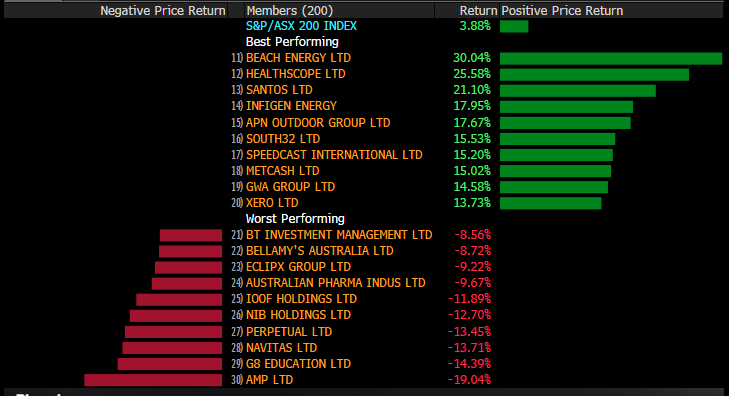
The month in review; Looking at stocks and sectors for the month of April, the index added +3.88% with the energy sector the clear standout while the Financials suffered at the hands of the Royal Commission. Interestingly, from a seasonal perspective, the April performance was in line with what we should normally see coming off the back of an abnormally weak March.
ASX Sectors for the month of April
Clearly AMP is under intense pressure as you’d expect while Perpetual (PPT) also felt the pinch during the period.
Stocks – best and worst for April
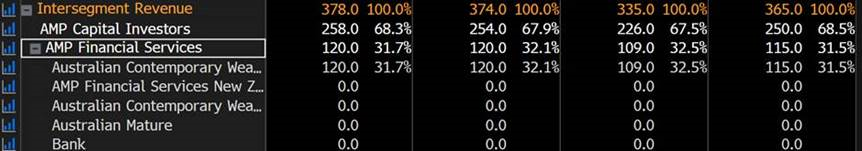
Thinking about AMP earnings for a moment, the bulk of their earnings come from funds management which seems good given the current negative focus on wealth management, however the flow of those funds typically come from AMP advisers / wealth managers. Those funds are directed into AMP product for a number of reasons, many of which have been challenged by the Royal Commission. Importantly, it seems very plausible that the removal of incentives given to the AMP adviser network will have a significant impact on FUM flow.
AMP revenue by segment
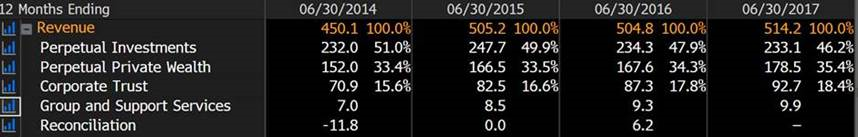
Perpetual on the other hand has also been sold hard on similar market concerns and trades on a similar valuation. 13.2x and 7% yield v AMP on 13.8x and 7.29% yield. While Perpetual is clearly not immune it is a company that’s slightly more diversified / defensive in terms of their trust business, plus their funds business (Perpetual Investments) seems a more robust / well regarded funds management operation which is less reliant on an internal adviser network for FUM flow.
PPT revenue by segment
Both will clearly have structural issues going forward, however those looking to bottom feed in a sector that has been hit very hard, PPT seems better placed to meet future challenges, and it now trades on a similar valuation to AMP.
Banks & Better Credit Growth; A number of factors combined today to see the banks pick themselves up off the carpet and stagger higher. Credit growth for the month of March was 0.5% which brings credit growth for the year ended 31/3/18 to 5.1%. This is an increase from 0.4% in February and from 4.9% in the year ended 28/2/18 – and importantly, better than the market feared last week after APRA announced the removal of the 10% investor loan growth restriction from 1 July. It was thought (and I was in this boat) that the news probably signalled a weakening in credit growth for the month given the timing of the announcement however that proved not to be the case today. The over-riding positive news is that the regulators are watching credit growth and will act to support it.
Drilling into the composition, housing credit growth was 0.5% in March which was equal to February’s number. Owner/occupier credit growth was 0.6% in March compared to 0.7% in February. Business credit growth was 0.8% in March compared to 0.1% in February. This is the second highest monthly business credit growth number for more than a year. The numbers are promising.
Westpac (WBC) Chart
Mining Quarterlies; A number of quarterlies out today / this week combined with Chinese economic data. Today we saw the PMI number beat expectations and productions updates from local miners (NST, WSA, IGO and SYR) were generally okay.
Northern Star (NST); MQ18 in line and now set up for target 600koz pa trade form JQ18 and beyond. NST has delivered on the ambitious growth plans/targets mapped out in recent years. Importantly, the company is now cum growth and ex capex hence CF should start to reflect this position form JQ18. But the share price requires such delivery …
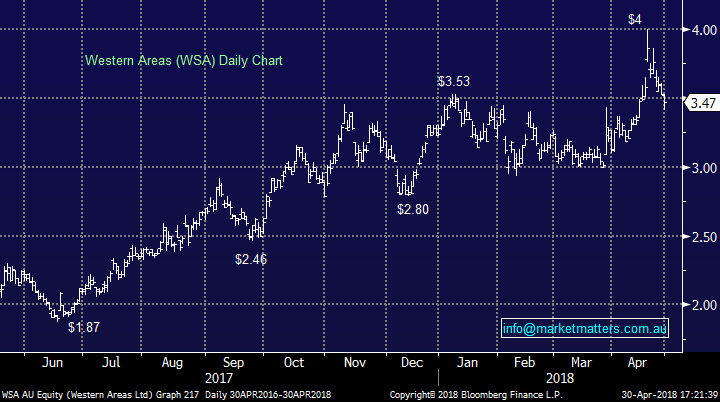
Western Areas (WSA); MQ18 lower production on lower grade (flagged in Feb), the first “miss” in 30 quarters. This is a value play that is firmly on our radar into recent weakness…
Western Areas (WSA) Chart
OUR CALLS
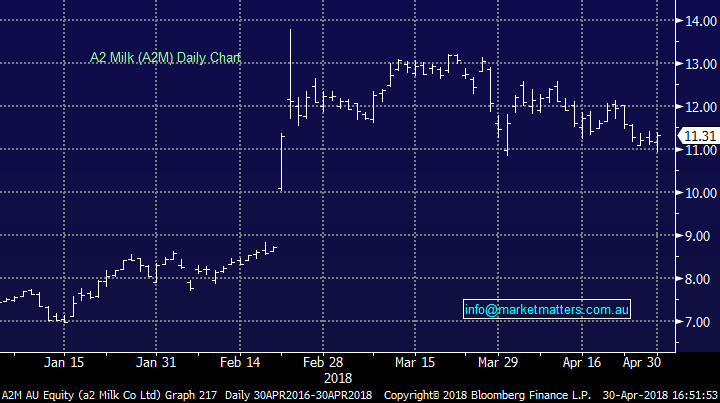
We added A2 Milk (A2M) to the Growth Portfolio today with a 3% weighting. We were targeting a buy around ~$10.60 however opted to pay up given the stocks seemed to find support at the lows today. A further slide to $10.60 would like see us up weight to 5%. We are targeting new highs ~$14 for A2
A2 Milk (A2M) Chart
Have a great night
James & the Market Matters Team
Disclosure
Market Matters may hold stocks mentioned in this report. Subscribers can view a full list of holdings on the website by clicking here. Positions are updated each Friday, or after the session when positions are traded.
Disclaimer
All figures contained from sources believed to be accurate. Market Matters does not make any representation of warranty as to the accuracy of the figures and disclaims any liability resulting from any inaccuracy. Prices as at 30/04/2018. 5.21PM
Reports and other documents published on this website and email (‘Reports’) are authored by Market Matters and the reports represent the views of Market Matters. The MarketMatters Report is based on technical analysis of companies, commodities and the market in general. Technical analysis focuses on interpreting charts and other data to determine what the market sentiment about a particular financial product is, or will be. Unlike fundamental analysis, it does not involve a detailed review of the company’s financial position.
The Reports contain general, as opposed to personal, advice. That means they are prepared for multiple distributions without consideration of your investment objectives, financial situation and needs (‘Personal Circumstances’). Accordingly, any advice given is not a recommendation that a particular course of action is suitable for you and the advice is therefore not to be acted on as investment advice. You must assess whether or not any advice is appropriate for your Personal Circumstances before making any investment decisions. You can either make this assessment yourself, or if you require a personal recommendation, you can seek the assistance of a financial advisor. Market Matters or its author(s) accepts no responsibility for any losses or damages resulting from decisions made from or because of information within this publication. Investing and trading in financial products are always risky, so you should do your own research before buying or selling a financial product.
The Reports are published by Market Matters in good faith based on the facts known to it at the time of their preparation and do not purport to contain all relevant information with respect to the financial products to which they relate. Although the Reports are based on information obtained from sources believed to be reliable, Market Matters does not make any representation or warranty that they are accurate, complete or up to date and Market Matters accepts no obligation to correct or update the information or opinions in the Reports.
If you rely on a Report, you do so at your own risk. Any projections are estimates only and may not be realised in the future. Except to the extent that liability under any law cannot be excluded, Market Matters disclaims liability for all loss or damage arising as a result of any opinion, advice, recommendation, representation or information expressly or impliedly published in or in relation to this report notwithstanding any error or omission including negligence.
To unsubscribe. Click Here


