A strong end to August (CNI, SUN, TLS, HVN)
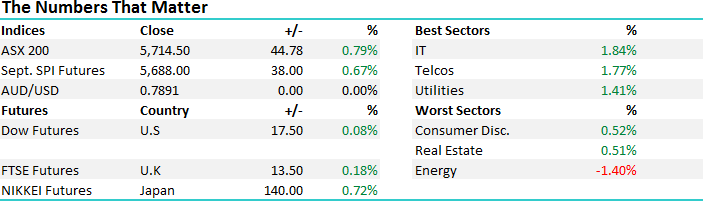
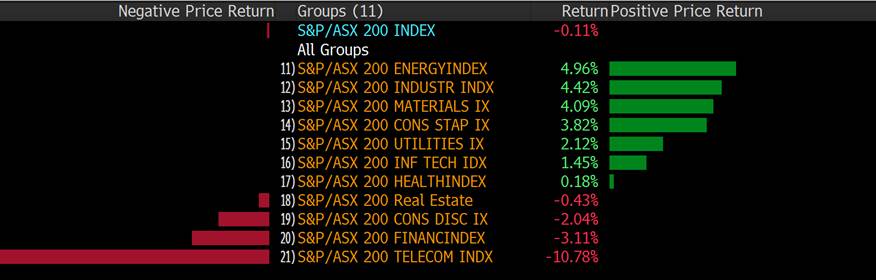
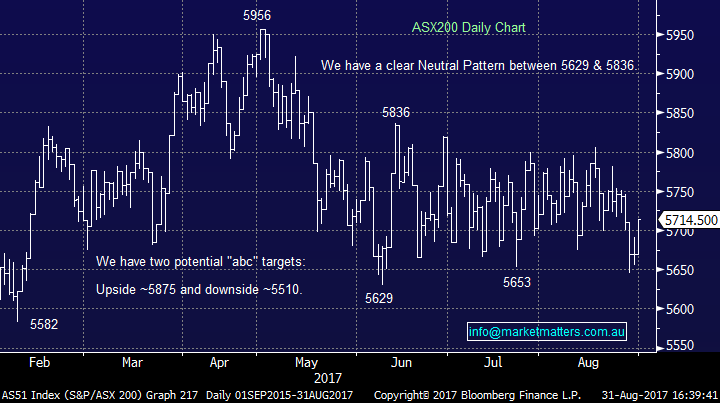
An overall choppy month in August for local stocks with the index bouncing within a very tight +/-161pt trading range / oscillating between 5806 resistance while support has come in at 5645 – the market finishing down 0.11% overall, which was actually better than the post GFC average performance in August for a drop of 0.50%. Energy stocks did best as Oil prices edged higher while materials were also in favour.
Looking ahead, September is a weaker period for stocks being the 6th worse month of the year, before the market usually gets bullish into Christmas.
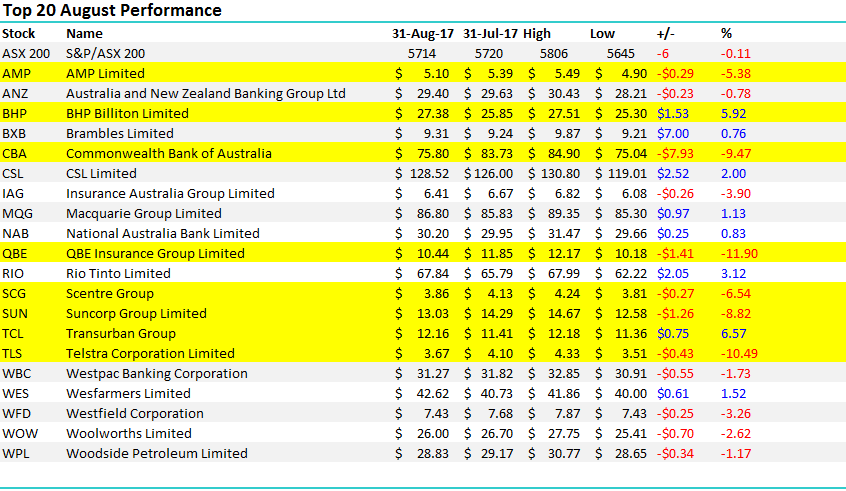
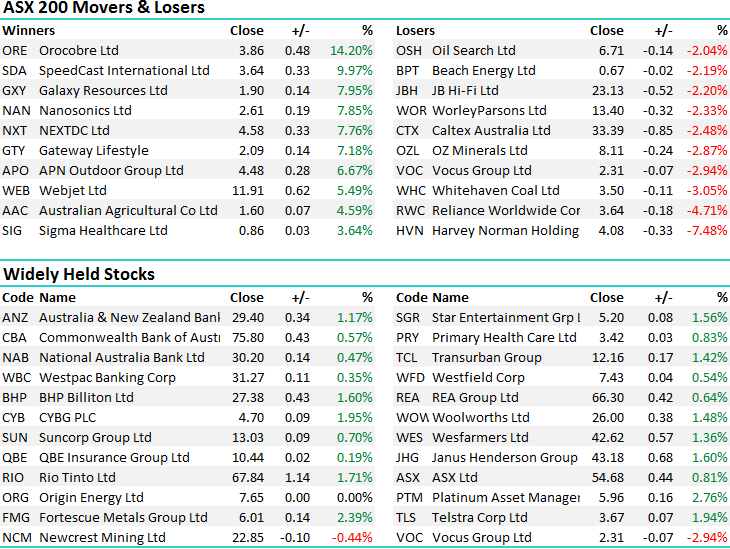
Although August was fairly flat, reporting season has thrown up some landmines and ensured a high degree of volatility on an underlying stock basis. Interestingly – as shown in the table below, the top 20 had more large declines by a factor of 3 than large advances – of note, two stocks that would form the basis of many retail portfolio’s in Commonwealth Bank (CBA) & Telstra dropped by 9.47% and 10.49% respectively. They did trade ex-dividend through the period however even taking this into consideration, the declines were big. The other main area of ‘pain’ was in the Insurance space with both Suncorp and QBE feeling the wrath of investors with weaker than expected margins, a pause / pullback in bond yields (interest rates) and more sanguine outlooks than we were hoping for.
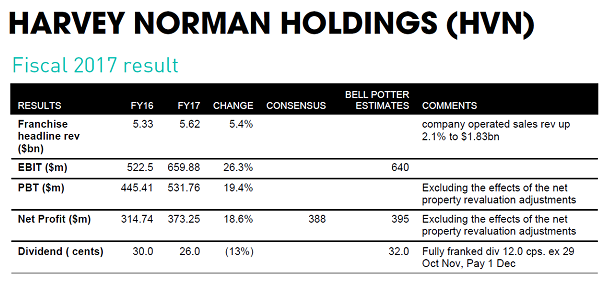
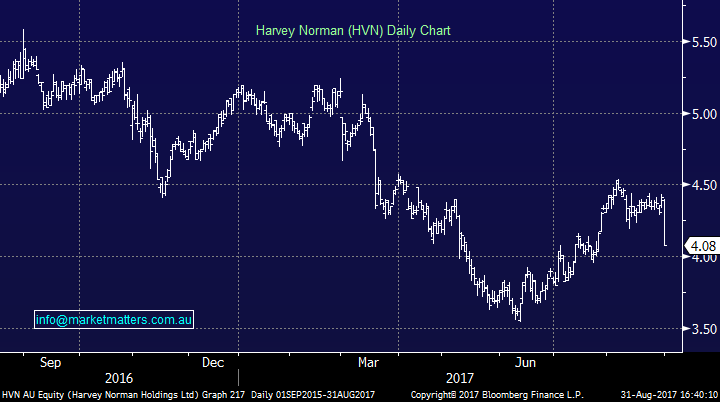
Harvey Norman (HVN) – reported their full year numbers today and the stock was clobbered by -7.48% to close at $4.08, which is just 1c above our purchase price in the MM Income Portfolio. The top line numbers were reasonably strong and the underlying result was a beat to consensus however the dividend was below expectations (12c) and the board said they were reviewing the company’s capital management options. It seems to me, they’ve cut the dividend to give more ammunition for a buy back but that is yet to be announced.
The other obvious concern in the market centres around some accountancy practices used by the retailer (this is not new news). Today’s results, which showed property revaluations of ~$108m only fed those concerns and the stock was sold fairly hard as a result. We think these concerns are overblown as are the threats posed by Amazon.
In terms of the business now, Harvey Norman earns more than 30% of profits from its property investments, so the earnings are much more defensive than other Australian retailers – however with interest rates so low, could this be as good as it gets for Harvey? The property portfolio is worth more than $2.5bn, so if they were to break up the business and the property, the actual operating business is trading on a sub-7x PE. They’ve got low gearing, a big franking credit balance and as suggested above, the result was actually ok today. We have it in the income portfolio and will retain for now.
Bell Potter released this snapshot earlier today….
Harvey Norman Daily Chart
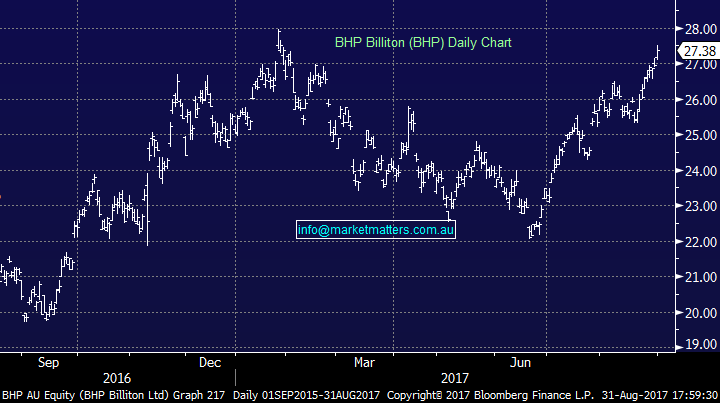
BHP Billiton (BHP) – we trimmed our BHP by 2.5% today at $27.47 – slightly earlier than we were looking for however we’ve retained a 5% holding for the dividend next week. We locked in a 14% profit.
BHP Daily Chart
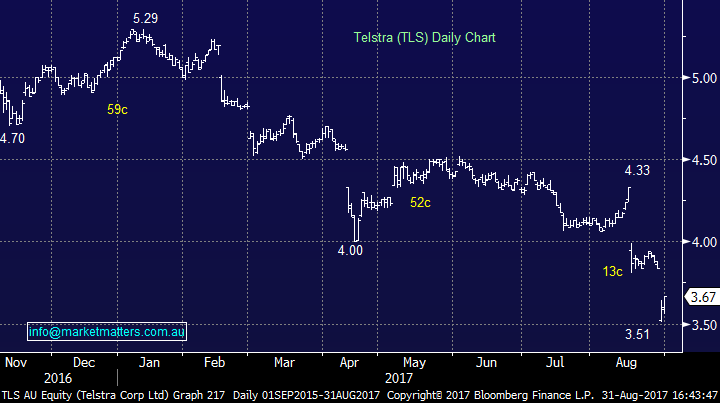
Telstra (TLS); We bought 5% at $3.85 pre-dividend and another 2.5% below $3.60 post the dividend giving us a 7.5% weighting to a stock that is well and truly on the nose at present. All this negativity can often cloud judgment and we think the market has become too bearish here. We are targeting a move back over $4 and today’s trading action was reasonable.
Telstra Daily Chart
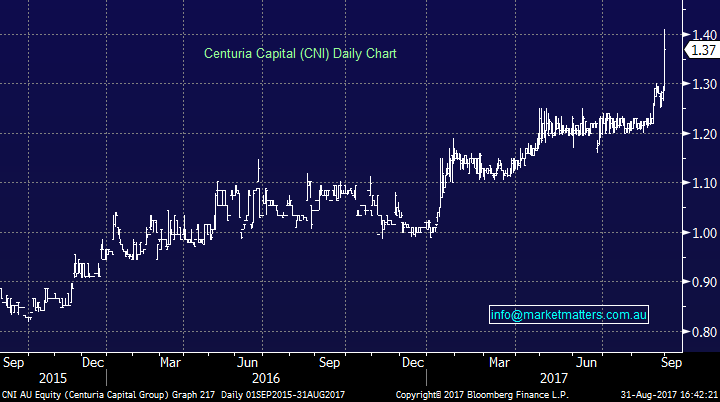
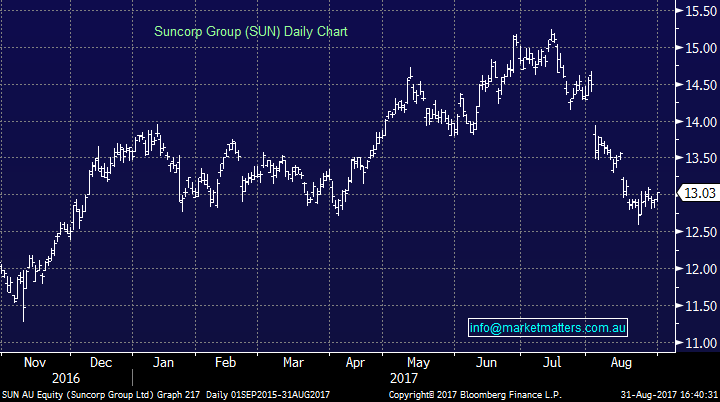
Two stocks that caught my eye today, both of which we own. Centuria (CNI) had very good session adding +5.79% to close at $1.37 and Suncorp (SUN) which only added +0.70% however it looks likely that a base is now in for this stock (and QBE for that matter).
Centuria Daily Chart
Suncorp Daily Chart
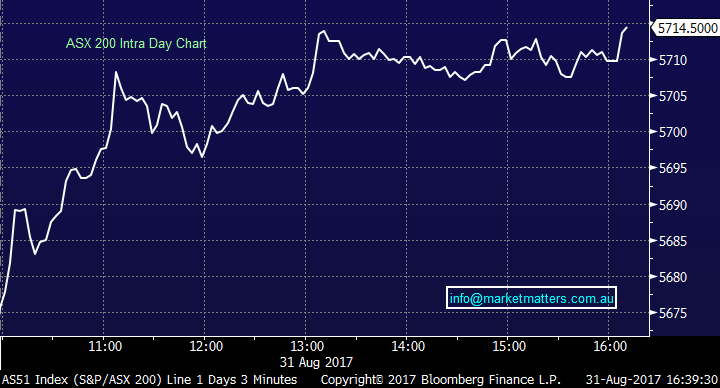
Back to today’s market, the IT sector led the way while most weakness was felt in the Energy stocks which could be a good precursor to what transpires in September. Often the weakest sector one month becomes the star of the next month. An overall range today of +/- 39 points, a high of 5714, a low of 5675 and a close of 5714, up +0.44pts or +0.79%.
ASX 200 Intra-Day Chart
ASX 200 Daily Chart
Have a great night
The Market Matters Team
Disclosure
Market Matters may hold stocks mentioned in this report. Subscribers can view a full list of holdings on the website by clicking here. Positions are updated each Friday.
Disclaimer
All figures contained from sources believed to be accurate. Market Matters does not make any representation of warranty as to the accuracy of the figures and disclaims any liability resulting from any inaccuracy. Prices as at 31/08/2017. 5.00PM.
Reports and other documents published on this website and email (‘Reports’) are authored by Market Matters and the reports represent the views of Market Matters. The MarketMatters Report is based on technical analysis of companies, commodities and the market in general. Technical analysis focuses on interpreting charts and other data to determine what the market sentiment about a particular financial product is, or will be. Unlike fundamental analysis, it does not involve a detailed review of the company’s financial position.
The Reports contain general, as opposed to personal, advice. That means they are prepared for multiple distributions without consideration of your investment objectives, financial situation and needs (‘Personal Circumstances’). Accordingly, any advice given is not a recommendation that a particular course of action is suitable for you and the advice is therefore not to be acted on as investment advice. You must assess whether or not any advice is appropriate for your Personal Circumstances before making any investment decisions. You can either make this assessment yourself, or if you require a personal recommendation, you can seek the assistance of a financial advisor. Market Matters or its author(s) accepts no responsibility for any losses or damages resulting from decisions made from or because of information within this publication. Investing and trading in financial products are always risky, so you should do your own research before buying or selling a financial product.
The Reports are published by Market Matters in good faith based on the facts known to it at the time of their preparation and do not purport to contain all relevant information with respect to the financial products to which they relate. Although the Reports are based on information obtained from sources believed to be reliable, Market Matters does not make any representation or warranty that they are accurate, complete or up to date and Market Matters accepts no obligation to correct or update the information or opinions in the Reports.
If you rely on a Report, you do so at your own risk. Any projections are estimates only and may not be realised in the future. Except to the extent that liability under any law cannot be excluded, Market Matters disclaims liability for all loss or damage arising as a result of any opinion, advice, recommendation, representation or information expressly or impliedly published in or in relation to this report notwithstanding any error or omission including negligence.
To unsubscribe. Click Here


