Venturing under the hood of the ASX200’s Capital Goods Sector (APT, EEM US, NWH, RWC, SSM, SVW, MND)
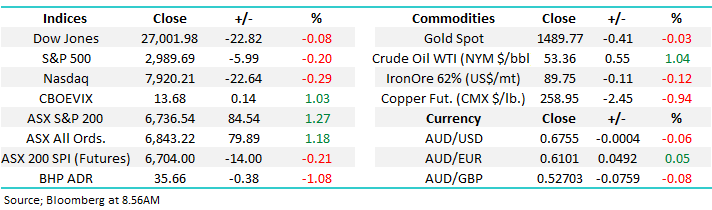
The ASX200 soared with the eagles yesterday finally gaining 84-points with solid gains across all sectors except for the Resources and IT stocks with the later primarily dragged down by Afterpay’s (APT) -7.2% plunge following a UBS sell recommendation. The market opened strongly and ground higher all afternoon with the “Big 4” banks all finishing up by over 1% - as we often say the market doesn’t go up / or down, without the banks. Even as US futures drifted lower and Asia generally struggled to match the overnight gains buying continued locally with noticeable solid volume changing hands on our futures market – it felt like fund managers were throwing in the towel and were investing some of their burgeoning cash position. An interesting point is these days of strong outperformance by the ASX200 usually unfold when the $A is struggling, as it did all day on Wednesday.
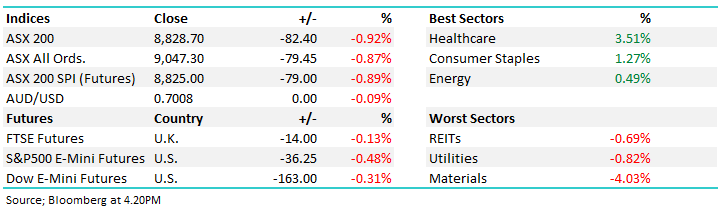
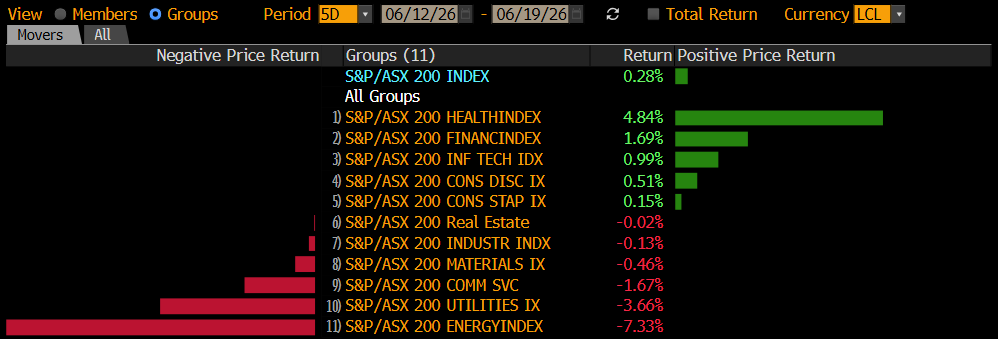
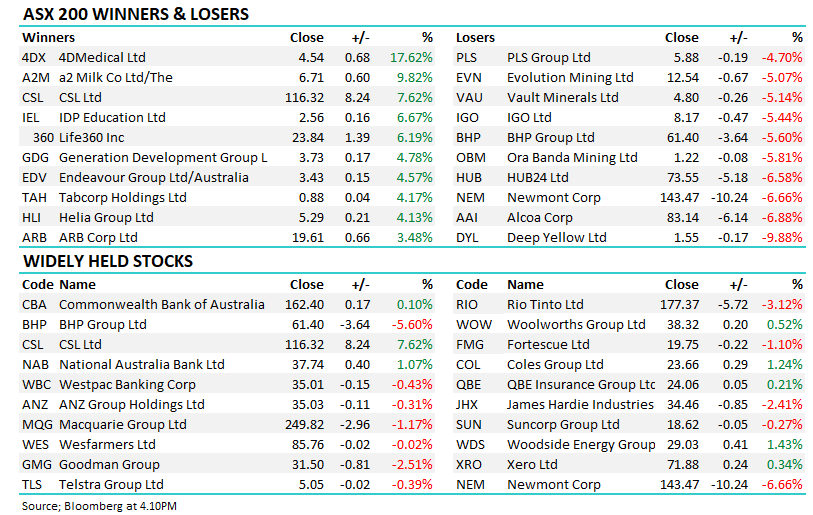
The buying was again directed at the more defensive stocks / sectors with Healthcare, Real Estate and the “yield play” stocks all enjoying a good day at the office. Conversely stocks exposed to the Australian / global economy were generally thrown into the naughty corner with Fortescue (FMG), RIO Tinto (RIO), and BHP Group (BHP) all closing in the red. The much discussed growth v cyclical elastic band continues to stretch and looks poised to continue its trend again today, at MM we believe the inflection point is getting very close i.e. time to buy cyclicals.
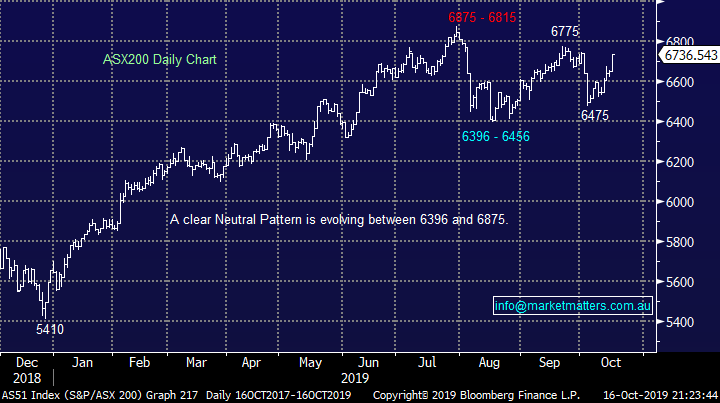
Overall it was an average day (relatively speaking) for our Growth Portfolio which has been positioned with a conservative stance targeting a pullback towards 6300. The close back above 6700 by the ASX200 has turned our short-term bearish view on its head, and from a technical perspective at least, we are now bullish targeting fresh all-time highs while the 6675 holds on the ASX 200. As we often say, don’t fight the tape (meaning price action) and yesterday’s price action was clearly bullish. This coincides with the fundamental backdrop of fund managers sitting on large cash positions anticipating a US – China trade war inspired sell-off.
Most importantly to us the MM Growth Portfolio is holding an 18% cash position plus a 5% bearish ETF position acquired on the 25th of last month when the ASX 200 was trading around current levels, however it now feels like some tweaks are required with this stance. We’ll assess after index expiry this morning. *Watch for alerts*.
Short-term MM is now targeting fresh all-time highs for the ASX200.
Overnight global stocks were quiet with the S&P500 slipping -0.2%, the SPI futures are pointing to the ASX200 opening down over 10-points with more of the same “buy defensive & sell risk” looking likely early this morning.
This morning MM has looked at the ASX200 Capital Goods sector which on Tuesday we boldly stated MM were bullish, hence today as we look for greater stock market exposure it seemed an obvious place to explore in more detail.
ASX200 Chart
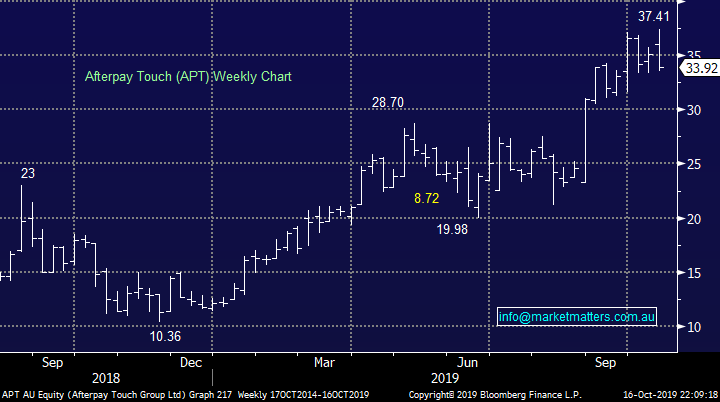
Yesterday saw Afterpay (APT) another market darling fall more than 7% on the back of a negative UBS report who called the stock “a sell “expecting it to “ halve within the year”, primarily due to regulatory risks. Also worth noting that APT directors have been substantial sellers in 2019 realising some great gains but implying they don’t expect the stock to keep rallying exponentially into 2020.
The main crux of the UBS report centred around a very valid point, essentially that the more successful the buy no, pay later sector becomes, the more likely they are to attract regulatory scrutiny. Also worth noting that while APT & Z1P have first mover advantages, competition is starting to heat up. Latitude Financial is an example of a company with a bid retail footprint venturing into the space however there is clear scope for existing payment platforms to go harder.
MM sees no reason to buy APT at present with another 10% downside at least appearing likely.
Afterpay Touch (APT) Chart
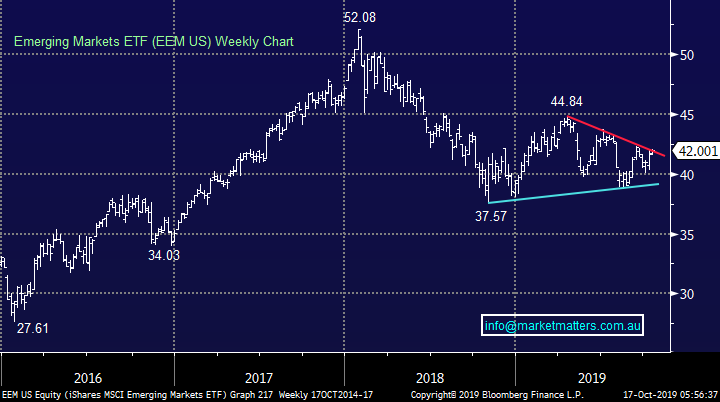
The below chart of the Emerging Markets is on the cusp of triggering a major buy signal which would generate a strong positive buy signal for cyclical stocks and the $A – our view is risk markets will soon follow this path higher.
MM is very close to turning bullish the Emerging Markets which implies that risk / cyclicals rally.
Emerging Markets ETF (EEM US) Chart
The Capital Goods sector
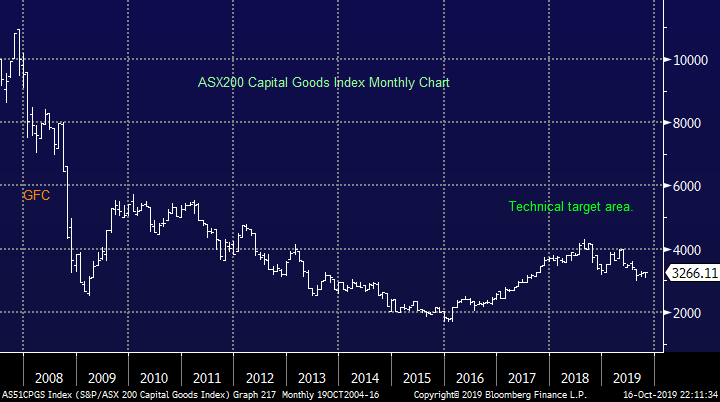
The rarely discussed and relatively small Capital Goods Sector contains the likes of Emeco (EHL), CIMIC Group (CIM), Reliance Worldwide (RWC) and GWA Group (GWA) – MM currently only has a relatively modest exposure to the sector through EHL. As we can see from the chart below post the GFC it’s been a chronic underperformer as many businesses experienced weak demand against a backdrop of anaemic economic growth, however technically, this sector now looks poised for a strong rally – perhaps the previously mentioned cashed up fund managers are going to start chasing these stocks looking for turnaround potential.
MM is bullish the Capital Goods Index initially targeting large gains of ~30%.
ASX200 Capital Goods Index Chart
Hence today I have looked at 5 of the 8 stocks in this ASX200 sector as we look for turnaround stories, especially keeping an eye out for potential candidates for the MM Growth Portfolio.
1 NRW Holdings (NWH) $2.35
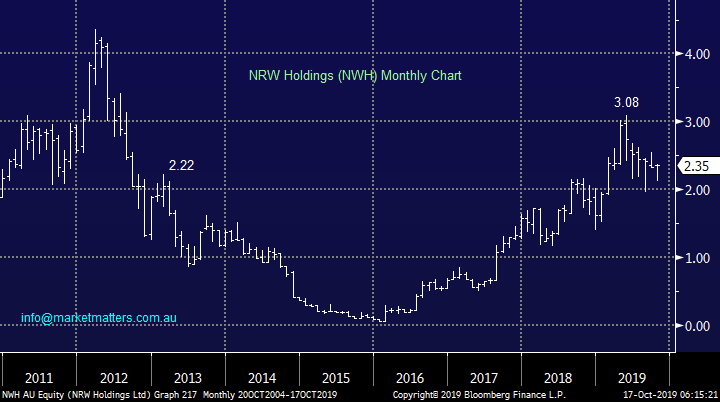
The Australian mining services group NWH is involved in mine construction and contracting in Australia, plus other smaller divisions that do drill and blast & related technologies. While they had a near death experience in 2015/16 they have bounced back strongly delivering an almost 50% increase in full year revenue when they reported back in August leading to a net profit after tax increase of 19% to over $40m. The company is in a strong position holding $65m in cash and company guidance implies FY20 revenue growth of 33% with EBITDA expected to improve by 26% (according to the mid-point of company guidance), largely driven by growth in their civil division.
The shares are relatively cheap trading on an Est P/E for 2020 of 12x while they are likely to yield ~2% fully franked.
MM is bullish NWH while it can hold above $2.20 targeting over 25% upside – this represents good risk/reward
NRW Holdings (NWH) Chart
2 Reliance Worldwide (RWC) $4.20
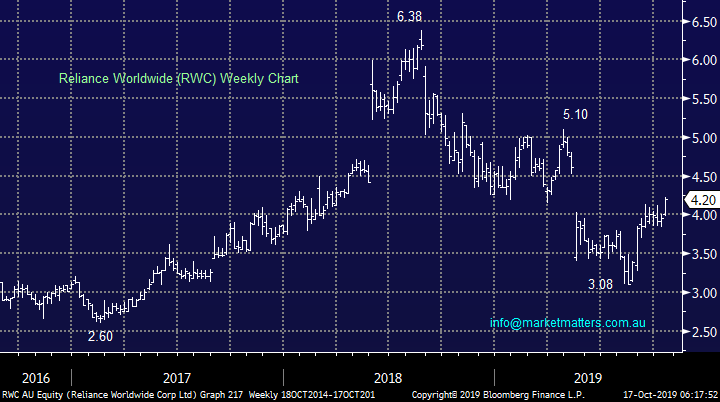
International plumbing business RWC has endured a tough few years as its stock has more than halved for a number of reasons including a large sell down by the previous Chairman, the absence of a US freeze which hurt earnings and BREXIT uncertainties. However we like this quality business and believe the main headwinds appear to be slowly dissipating while its global footprint spreads the risk away from an isolated downturn in our local economy. Overall we believe solid risk / reward has returned to the stock.
While it still trades on an Est P/E for 2020 of 20.8x, it is forecast to growth earnings at an ~8% clip year on year.
MM is bullish RWC while it can hold above $3.80
Reliance Worldwide (RWC) Chart
3 Service Stream (SSM) $2.70
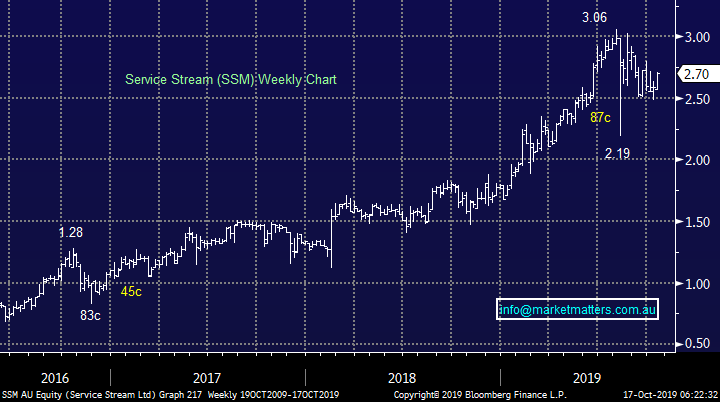
This leading network services business reported an excellent full year result back in August for FY 2019 demonstrating major growth. Revenue increased 35% to $852m while its profit was up an impressive 39%. A lack of guidance appeared to unsettle the market but management do appear to have bedded down their acquisition of the Comdain Infrastructure business.
The stocks trading on a fairly undemanding P/E of 16.8x for 2020 considering expected earnings growth of ~30% although that is expected to taper off in FY21 , while its projected 3.7% fully franked dividend is attractive in today’s environment.
MM is bullish SSM targeting fresh 2019 highs while it holds above $2.55.
Service Stream (SSM) Chart
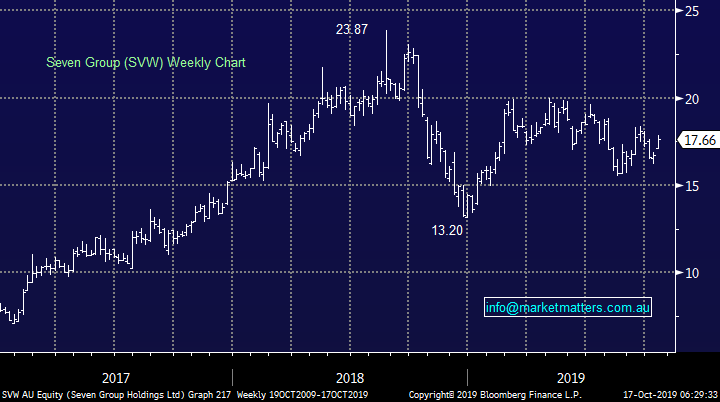
4 Seven Group (SVW) $17.66
Diversified operating and investment group SVW is now a $6bn business but it can be hard at times to get a handle on with its many moving parts e.g. it has interests in media through Chanel 7 but also owns caterpillar dealerships in Australia & China and almost 30% of Beach Energy (BPT) – a broad church created Kerry Stokes )I recently read his biography – a good read).
After the stocks decent correction since early 2018 we can see some decent risk / reward as it trades on a conservative P/E of 12.5x for 2020, while yielding 2.4% fully franked.
We like the company at today’s price but would keep a tight leash on any investment as its demonstrated its clear ability to fall with momentum since surging into its 2018 high.
MM is bullish SVW while it can hold above $16.20.
Seven Group (SVW) Chart
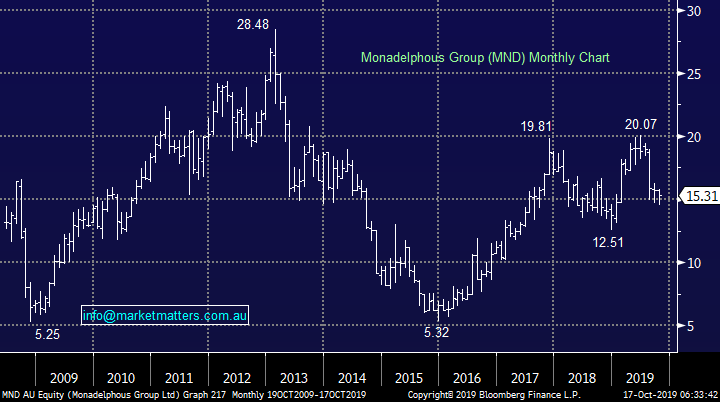
5 Monadelphous Group (MND) $15.31
Mining services business MND has struggled since reporting revenue above $1.6bn and profit of $57m back in August. However the stock now looks reasonable value after falling 25% taking the Est P/E back to 20.2x while the shares yield 3.4% fully franked.
While our least preferred stock this morning, it still offers reasonable risk reward implying we’re on the right track hunting around this sector.
MM likes MND while it can hold above $14.70.
Monadelphous Group (MND) Chart
Conclusion (s)
Of the 5 stocks looked at today, we like all 5 to varying degrees with our order of preference: NRW, SSM, RWC, SVW, MND.
Watch for alerts.
Global Indices
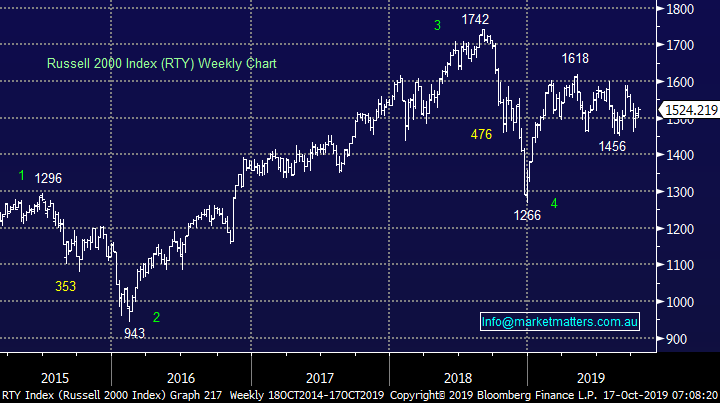
We are now giving the benefit of the doubt to the post GFC bull market with fresh all-time highs ultimately feeling likely.
MM is now bullish US stocks.
US Russell 2000 Index Chart
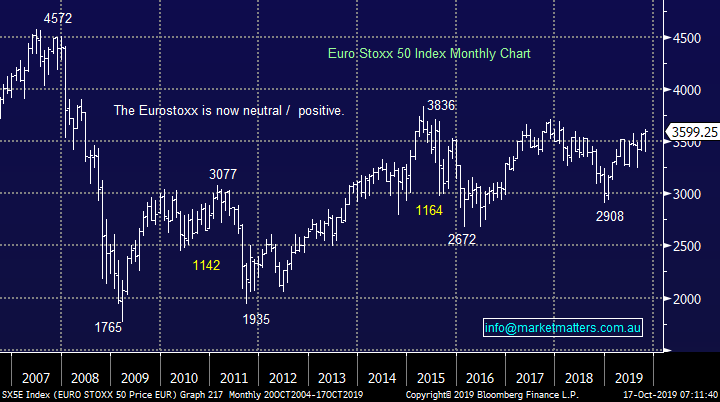
European indices are mixed technically but with no commitment in either direction at this point in time but we have now developed a slight positive bias.
Euro Stoxx50 Chart
Overnight Market Matters Wrap
- The US equity markets eased overnight following weaker than expected retail sales, with the latest September data showing a fall of 0.3%, the first drop in 7 months, sparking investor fears of a looming slowdown in economic growth.
- Iron ore was the feature of the commodity market, dropping 5.5%, as a result, BHP in the US fell as equivalent of -1.08% from Australia’s previous close. Both gold and crude oil firmed, while base metals were mixed, copper off 0.94%.
- The December SPI Futures is indicating the ASX 200 to open marginally lower, testing the 6730 level this morning with a volatile open expected for October’s index expiry.
Have a great day!
James & the Market Matters Team
Disclosure
Market Matters may hold stocks mentioned in this report. Subscribers can view a full list of holdings on the website by clicking here. Positions are updated each Friday, or after the session when positions are traded.
Disclaimer
All figures contained from sources believed to be accurate. All prices stated are based on the last close price at the time of writing unless otherwise noted. Market Matters does not make any representation of warranty as to the accuracy of the figures or prices and disclaims any liability resulting from any inaccuracy.
Reports and other documents published on this website and email (‘Reports’) are authored by Market Matters and the reports represent the views of Market Matters. The Market Matters Report is based on technical analysis of companies, commodities and the market in general. Technical analysis focuses on interpreting charts and other data to determine what the market sentiment about a particular financial product is, or will be. Unlike fundamental analysis, it does not involve a detailed review of the company’s financial position.
The Reports contain general, as opposed to personal, advice. That means they are prepared for multiple distributions without consideration of your investment objectives, financial situation and needs (‘Personal Circumstances’). Accordingly, any advice given is not a recommendation that a particular course of action is suitable for you and the advice is therefore not to be acted on as investment advice. You must assess whether or not any advice is appropriate for your Personal Circumstances before making any investment decisions. You can either make this assessment yourself, or if you require a personal recommendation, you can seek the assistance of a financial advisor. Market Matters or its author(s) accepts no responsibility for any losses or damages resulting from decisions made from or because of information within this publication. Investing and trading in financial products are always risky, so you should do your own research before buying or selling a financial product.
The Reports are published by Market Matters in good faith based on the facts known to it at the time of their preparation and do not purport to contain all relevant information with respect to the financial products to which they relate. Although the Reports are based on information obtained from sources believed to be reliable, Market Matters does not make any representation or warranty that they are accurate, complete or up to date and Market Matters accepts no obligation to correct or update the information or opinions in the Reports. Market Matters may publish content sourced from external content providers.
If you rely on a Report, you do so at your own risk. Past performance is not an indication of future performance. Any projections are estimates only and may not be realised in the future. Except to the extent that liability under any law cannot be excluded, Market Matters disclaims liability for all loss or damage arising as a result of any opinion, advice, recommendation, representation or information expressly or impliedly published in or in relation to this report notwithstanding any error or omission including negligence.