Why we definitely prefer the active over passive approach into 2020 (CGC, BLD, IEM, RIO, TIF US, FMG, BSL)
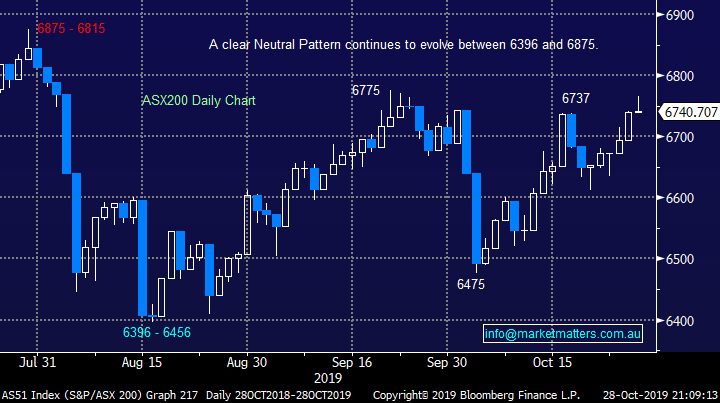
The ASX200 danced to the same tune yesterday as no buyers emerged into early strength, just as no sellers appeared into any weakness last week. The market eventually closed up just 1-point on extremely light volume after being up 27-points at the opening, overall interest appears to be low and the market finished the day with more stocks closing in the red than green, not particularly bullish stuff. At MM we actually started the week thinking the market might just have the platform to challenge the 6800 area and beyond but alas apathy has prevailed to-date.
Under the hood the resource stocks offered some much needed support with iron ore & energy stocks in particular enjoying some solid buying e.g. Fortescue Metals (FMG) +2.2% and BHP Group (BHP) +1.1%. On reflection it’s a big ask for the market to get too excited before the looming company results – we’ve already seen 2 horrendous downgrades in the last 24-hours from Sims Metals (SGM) and Costa Group (CGC), its been a while since I can recall 2 upgrades within a day! Also on Wednesday we’ll see the local CPI Inflation data for the September quarter, closely followed by the Feds decision on US interest rates Thursday morning AEST – its not hard to see why investors are adopting the “if in doubt stay out” approach to stocks, at least for now.
Interestingly overnight US stocks made fresh all-time highs but Goldman’s have reported that investors are flocking from US stocks to cash / bonds at levels not see since 2008. Cash holdings have swelled to 12%, for the mathematicians amongst our subscribers that’s the 5th percentile over the past 30-years. Clearly the masses continue to position themselves for a recession but to us the nagging feeling that the herd is regularly wrong keeps ringing in our ears. Pullbacks are easy to imagine but there’s a wall of money looking to buy stocks cheaper.
Again while US indices enjoyed a strong night we saw major disparities across the respective sectors of the S&P500 e.g. the yield play sectors like Utilities and Real Estate both fell over 1% while IT and Healthcare both rallied by over 1%, importantly for our index this morning the financials and resources were also strong.
Short-term MM remains neutral the ASX200, with a positive bias.
Overnight global stocks were strong with the main US indices making fresh all-time highs, the SPI Futures are calling the ASX200 to open up over +20-points, well under yesterday’s high. BHP was up almost 1% in the US even as oil and iron ore softened, a good sign for the resources today. However if the ASX200 closes below 6730 this week we will adopt a short-term bearish stance targeting ~6600.
This morning MM has looked at why we prefer the active over passive approach to investing at this stage of the stock market cycle.
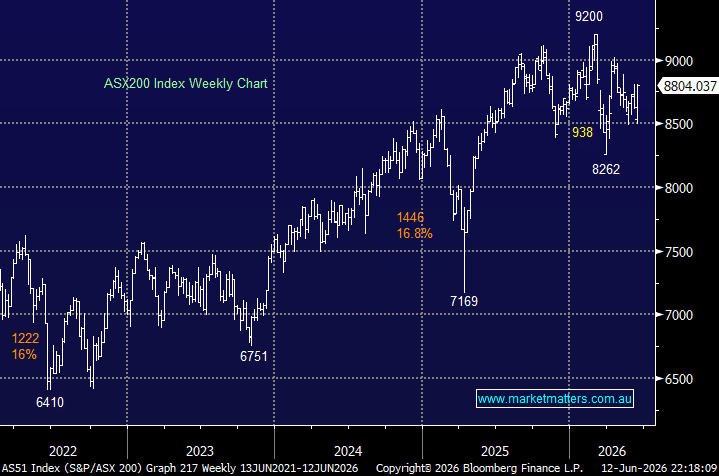
ASX200 Chart
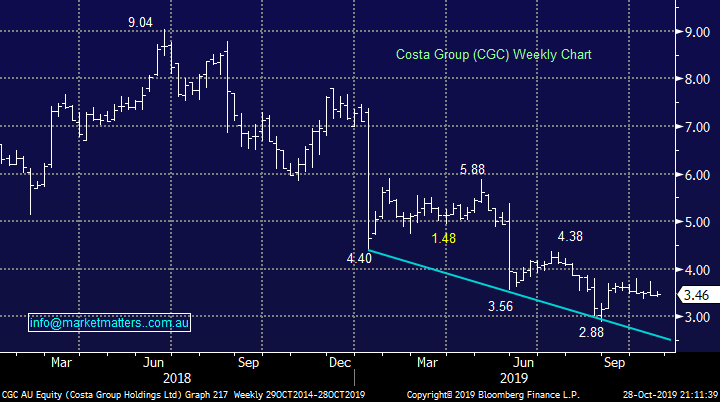
Yesterday evening we learned the news around fruit and mushroom grower Costa Group (CGC) and as we expected it was negative:
1 – Earnings estimates have been downgraded by ~30% for 2019 while it is looking for 2020 to be 50% better, the market might take some convincing on this one.
2 – A $176m capital raising has been actioned at $2.20 in the form of a 1 for 4 rights issue raising to pay down debt – a 36.4% discount to its last traded price.
On the positive front it’s the best way to raise money from existing shareholders allowing us the ability to average at lower prices, it shows confidence by UBS that the deal will be bedded down, especially as they fully underwrote the issue. The stock will probably recommence trading on Wednesday or Thursday
Below we have broken down the composition of the deal explaining the elements to it. It is a fully underwritten accelerated renounceable pro-rata entitlement offer, with retail rights trading.
Fully underwritten: Means CGC has paid UBS a fee to guarantee they raise the $176m of new equity.
Accelerated renounceable pro-rata entitlement offer: Accelerated means time frame, renounceable means the rights can be sold, pro-rata entitlement means that it’s based on our existing shareholding, in this case, we are entitled to 1 new share for every 4 we hold,
Retail rights trading: This dovetails into the renounceable part, meaning the rights we get as an existing shareholder (being the right to buy 1 new share at $2.20 for each 4 shares we hold) can be traded on the ASX.
Costa Group (CGC) Chart
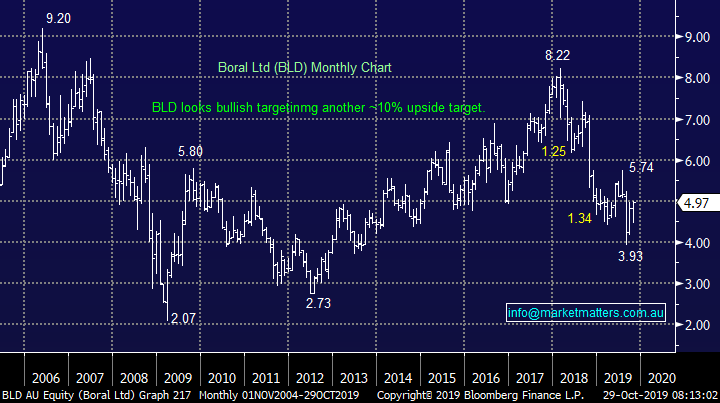
As CGC is likely to supress my mood for the next few days (I’m a bad loser!) I thought I would mention one sector that’s moving nicely for MM, the building & construction facing stocks e.g. Boral (BLD) +1.8% and CSR Ltd (CSR) +2.5%, with the former in our Growth Portfolio while CSR is in our Income Portfolio. Equity markets look at least 6-months ahead hence if fund managers believe like ourselves that the government will press the fiscal stimulus button in 2020 this is an opportune time to get set in this sector.
MM remains bullish the Australian construction sector as we see fiscal stimulus looming on the horizon.
Boral Ltd (BLD) Chart
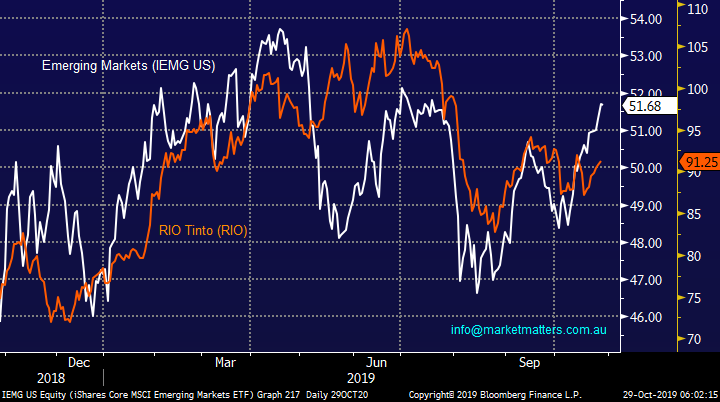
Interestingly while the ASX struggled to find any upside momentum yesterday Asia was strong with Hong Kong and China both up nearly 1%, they clearly have faith in a satisfactory conclusion to US – China trade talks. We remain bullish and long the Emerging Markets in our Global ETF Portfolio, this is a good indicator for the recently highly correlated Australian resources sector i.e. both will struggle if the US – China trade war escalates.
MM remains bullish both the Emerging Markets and Australian resources.
Emerging Markets (IEM) v RIO Tinto (RIO) Chart
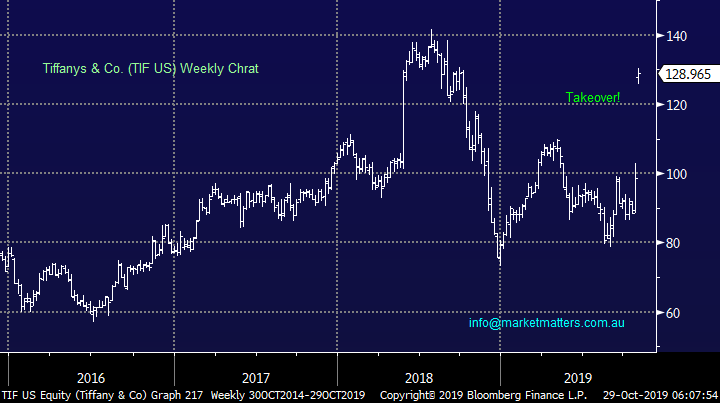
Overnight we saw the reaction to high end retailer Louis Vuitton’s (LVMH) $14.5bn bid for Tiffany’s, a move which implies all is indeed well under the hood for luxury retail, only a few days after we were singing the praises of Hermes (RMS FP). This feels like a play to MM on a pick-up in China / Asia prosperity in the years ahead, especially as trade talks appear to be coming to a reasonable conclusion.
MM likes exposure to the Chinese consumer of luxury goods into 2020.
Tiffany’s & Co (TIF US) Chart
Active investing is the path for MM into 2020.
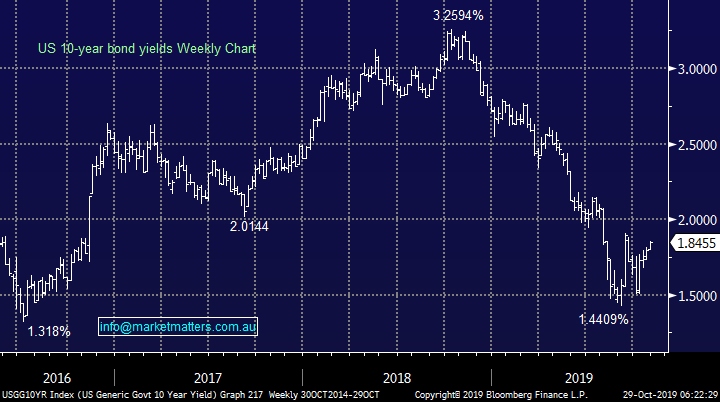
Bond yields continue to be the tail that wags the stock market dog whether it be the overall index, or the specific sectors that are swinging in / out of favour. When US 10-year bond yields have fallen below 1.5% on recession fears it’s been good news for the yield play stocks like Utilities and Real Estate, conversely when the Fed was hiking rates in 2017 /18 on concerns the US economy was growing too fast the resources enjoyed a stellar run.
We’ve already seen 3 inflection points for US 10-year yields in just 3-years which has given rise to huge divergence in sector performance over this period. At MM we believe this will continue as central banks / governments fight to maintain post GFC global economic expansion, staving off a much discussed potential recession in the process. As subscribers know we believe its time for fiscal stimulus from governments as central banks run out of monetary policy ammunition – there’s not many cuts left for the RBA from 0.75%, plus as CBA reported yesterday only 7% of its borrowers reduced mortgage payments as rates have fallen, this clearly doesn’t stimulate spending.
We can see US 10-years oscillating between 1.25% and 2% in the months ahead with both extremes likely to have significant impact on which sectors are in vogue.
US 10-year bond yield Chart
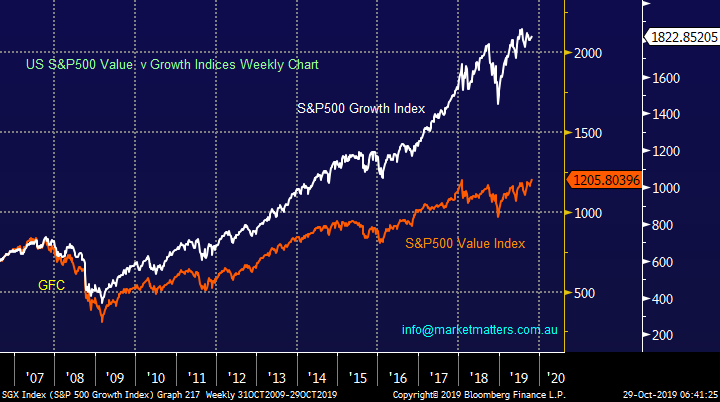
As we’ve discussed previously MM is looking for some mean reversion from the growth v value elastic band into 2020 and beyond, this by definition implies we believe the bear market for interest rates is reaching its conclusion but note that doesn’t mean we necessarily expect rates to rise just yet, but just stop falling.
If we actually get “close” to the very influential US 10-year yield chart our preferred short-term scenario is one final dip down towards 1.25% before a more sustained rally - this would imply one last spike for sectors like Utilities, Real Estate and Gold but at MM we remain very mindful that it feels like the end of the road is getting close hence we are monitoring our gold exposure very closely.
This very same potential rotation of bond yields is why we expect the pronounced sector rotation theme of recent weeks to be ongoing, providing excellent opportunities for the active and nimble i.e. buy risk below 1.5% and buy defensives around 2% in the short-term but longer term we have no interest in the crowded defensive space.
MM prefers the Value Index over Growth into 2020.
S&P500 Growth & Value Indices Chart
Due to our view that stock / sector rotation will dominate the market into 2020 subscriber should expect a lot of focus on individual sectors followed by the actual stocks under the hood.
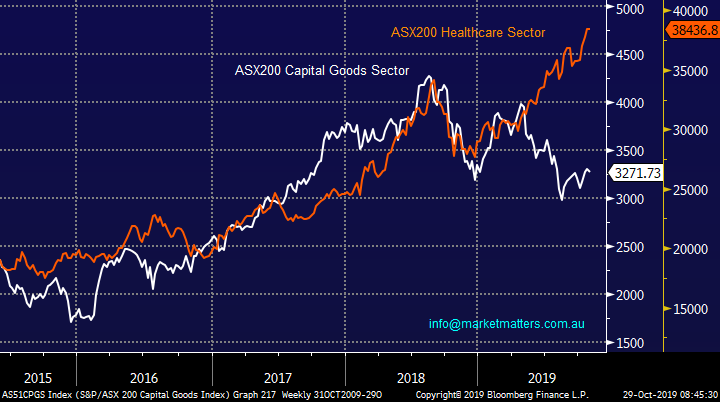
Recently we bought Service Stream (SSM) and NRW Holdings (NWH) after turning bullish the Capital Goods Sector while we are now out of the Healthcare Sector because we feels it’s too owned and very rich from a valuation perspective. This “call” with regards to these 2 sectors is still in its infancy but as the chart below illustrates it’s a very stretched elastic band.
MM will continue to look for areas were we think fund managers will almost be forced to invest as their cash levels continue to grow – when a stock / sector comes back onto investors radar the impact can be dramatic on the upside.
ASX200 Capital Goods & Healthcare Sectors Chart
It’s not just sectors that are experiencing some pick up in volatility its also happening on the stock level as fund managers look for places to put their burgeoning cash levels to work but they’re equally as prepared to jump off the train when things feel too hot, or in other words we currently have a very fascinating but fickle market on our hands.
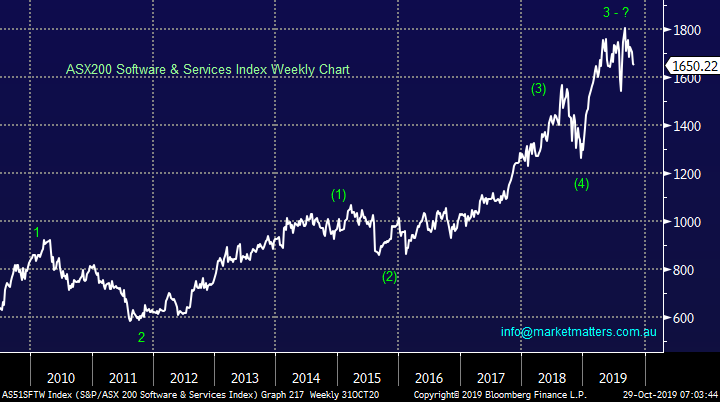
Just consider the previously “hot” Australian WAAAX stocks – Wisetech (WTC), Appen (APX), Altium (ALU), Afterpay (APT) and Xero (XRO). They could do no wrong over the first 6-months of 2019 but in recent weeks there’s been some significant pullbacks across the names with APT and WTC both down well over 20% in the last month – our simple point is be prepared to take profits when stocks hit our / your targets as they might vanish as quickly as they materialised.
ASX200 Software & Services Index Chart
I have briefly looked at 2 stocks in the MM Growth Portfolio that are threatening to hit our target area into Christmas and not surprisingly we will take the $$ if the opportunities do present themselves. Its always important to remember that there’s 2 components to buying shares – the quality of the business and the price of the stock, we see no reason to chase excellent companies at silly prices in today’s market – that almost has us in the minority!
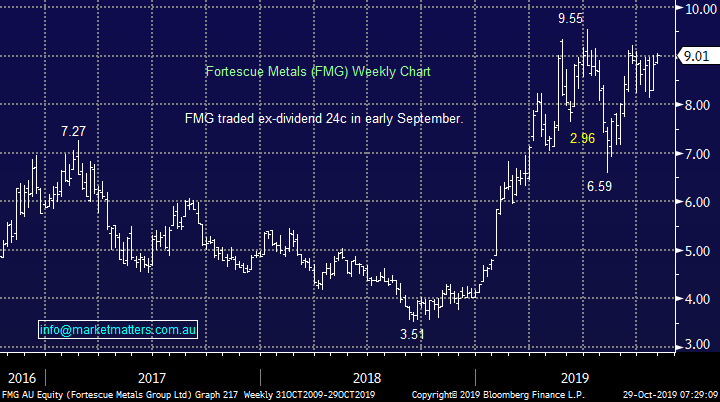
1 Fortescue Metals (FMG) $9.01
MM is enjoying a solid performance from Twiggy Forest’s iron ore producer FMG, we’re already up over 25% but another ~8% feels likely in the coming weeks. While we are keen to lock in profits when they present themselves in today’s volatile market its important not to get too itchy a “sell finger” while things are moving our way.
MM is bullish FMG targeting a break of the 2019.
Fortescue Metals (FMG) Chart
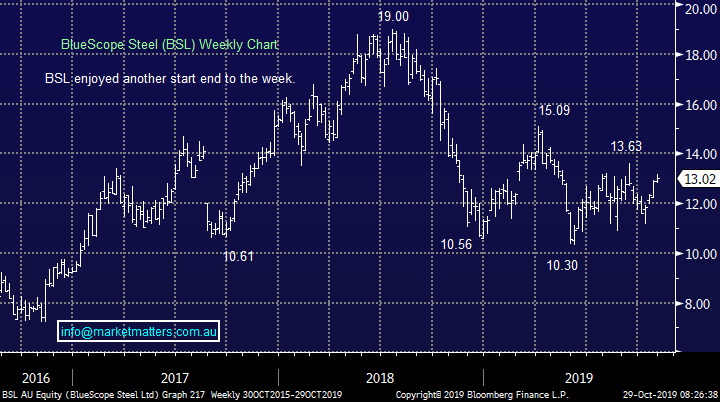
2 BlueScope Steel (BSL) $13.02
BSL is another stock who should benefit from positive noises from US – China trade talks, we remain bullish targeting the $14.50 area but again we will be sellers here.
MM is targeting the $14.50 area for BSL.
BlueScope Steel (BSL) Chart
Conclusion (s)
MM remains cautiously bullish the risk on sector but we will take our $$ if / when our respective target areas are reached.
Due to the likely oscillations of bond yields as markets rotate between optimism / pessimism around the global economy we prefer active investing at this stage of the post GFC bull market.
Global Indices
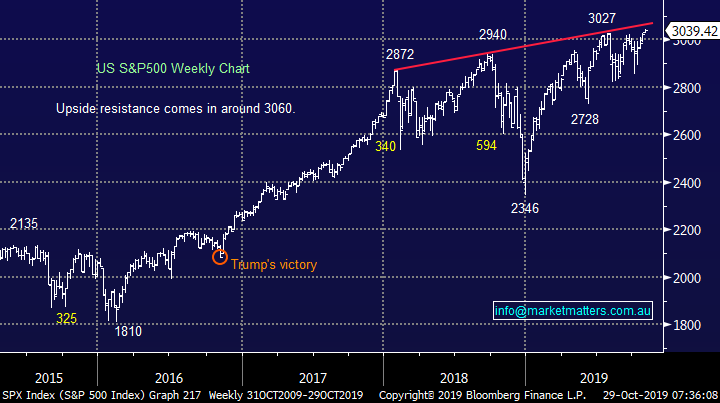
No change, we had given the benefit of the doubt to the post GFC bull market and fresh all-time highs have been achieved as anticipated but major resistance is now only 1% away reverting us to a neutral stance. However a break back under 3000 is required to switch us to a bearish short-term stance.
MM is now neutral US stocks.
US S&P500 Index Chart
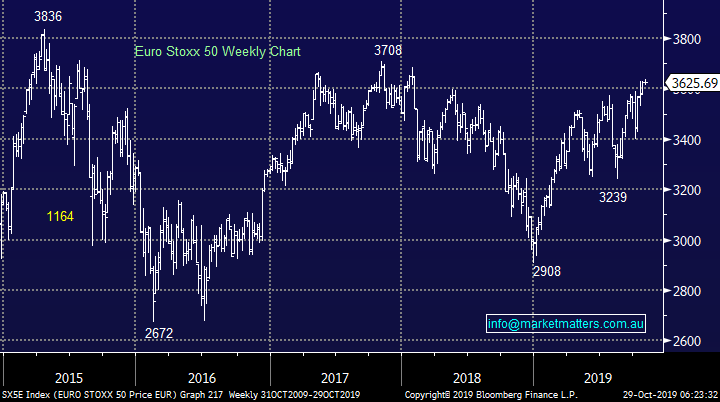
European indices continue to “climb a wall of worry” at this point in time MM is neutral but we maintain our slight positive bias.
Euro Stoxx50 Chart
Overnight Market Matters Wrap
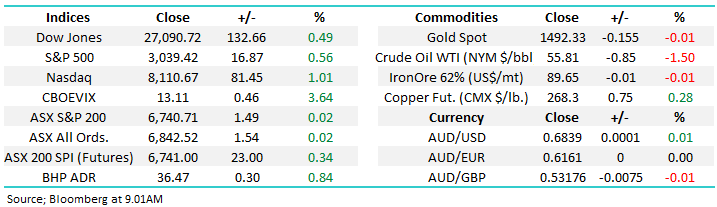
· The Australian market is poised to open higher this morning off the back of a new record set by the S&P 500, XJO futures are currently up 23 points. All the US indices were in the black with the Dow up 0.5%, S&P 500 up 0.6% and the best performing of the 3 the NASDAQ up 1%
· The S&P 500 took out its July record after Trump said the US is ahead of schedule to sign parts of the US/China trade deal. Tiffany surged after LVMH held takeover discussion with the jeweler. The US ten year Treasury yield hit a 6 month high.
· It was a mixed night for metals on the LME with copper trading higher, but nickel not being able to follow the lead, closing down 1.3%. No iron ore print. Oil and gold both had a weaker night with spot gold currently trading at US$1492/oz. AUD/USD is currently 68.39c.
· Locally we have Coles 1Q Sales out today. Also, AGM’s from BGA, BEN, FMG, TGR and VOC.
Have a great day!
James & the Market Matters Team
Disclosure
Market Matters may hold stocks mentioned in this report. Subscribers can view a full list of holdings on the website by clicking here. Positions are updated each Friday, or after the session when positions are traded.
Disclaimer
All figures contained from sources believed to be accurate. All prices stated are based on the last close price at the time of writing unless otherwise noted. Market Matters does not make any representation of warranty as to the accuracy of the figures or prices and disclaims any liability resulting from any inaccuracy.
Reports and other documents published on this website and email (‘Reports’) are authored by Market Matters and the reports represent the views of Market Matters. The Market Matters Report is based on technical analysis of companies, commodities and the market in general. Technical analysis focuses on interpreting charts and other data to determine what the market sentiment about a particular financial product is, or will be. Unlike fundamental analysis, it does not involve a detailed review of the company’s financial position.
The Reports contain general, as opposed to personal, advice. That means they are prepared for multiple distributions without consideration of your investment objectives, financial situation and needs (‘Personal Circumstances’). Accordingly, any advice given is not a recommendation that a particular course of action is suitable for you and the advice is therefore not to be acted on as investment advice. You must assess whether or not any advice is appropriate for your Personal Circumstances before making any investment decisions. You can either make this assessment yourself, or if you require a personal recommendation, you can seek the assistance of a financial advisor. Market Matters or its author(s) accepts no responsibility for any losses or damages resulting from decisions made from or because of information within this publication. Investing and trading in financial products are always risky, so you should do your own research before buying or selling a financial product.
The Reports are published by Market Matters in good faith based on the facts known to it at the time of their preparation and do not purport to contain all relevant information with respect to the financial products to which they relate. Although the Reports are based on information obtained from sources believed to be reliable, Market Matters does not make any representation or warranty that they are accurate, complete or up to date and Market Matters accepts no obligation to correct or update the information or opinions in the Reports. Market Matters may publish content sourced from external content providers.
If you rely on a Report, you do so at your own risk. Past performance is not an indication of future performance. Any projections are estimates only and may not be realised in the future. Except to the extent that liability under any law cannot be excluded, Market Matters disclaims liability for all loss or damage arising as a result of any opinion, advice, recommendation, representation or information expressly or impliedly published in or in relation to this report notwithstanding any error or omission including negligence.