Overseas Wednesday – International Equities & ETF Portfolios (OZL, IEM, QRE)
The ASX200 continues to rotate in a relatively tight range while under the hood the different sectors take it in turns to rotate in and out of favour. Yesterday the sellers again emerged into early market strength although the market did still manage to close marginally in the black. Of the 11 sectors only the IT stocks managed to move by more than 0.5% , they managed to rally by +1% aided by greater than 4% gains by Bravura (BVS) and Iress (IRE). The heavyweight miners supported the index with BHP Group (BHP), RIO Tinto (RIO) and OZ Minerals (OZL) all rallying by well over 1%, on the other side of the ledger banks appear to have gone into hibernation ahead of results in early November.
Bega Cheese (BGA) joined the downgrade parade on Tuesday joining the likes of Costa Group (CGC) and Sims Metals (SGM) with the underlying theme that both the drought and trade tensions are likely to have hurt some companies more than many initially thought. The real worry here is if we wake up one morning and President Trump has relit the fuse with China because obviously the ramifications will be felt far and wide. With an election in 1-years’ time a lot of the Tweets etc are likely to be sent with voters in mind, this can go both ways for stocks depending on the polls.
In the derivatives arena the SPI futures struggled to trade over 20,000 lots, finally reaching 20,738 which for subscribers who are curious equates to a nominal value of 20,738 x $25 x 6745 (the index) ~$3.5bn. However the main point here is only a few weeks ago we were often witnessing volumes closer to 40,000 lots illustrating perfectly how lacklustre the market has become in just a short period of time. Today we have local inflation data in Australia while on Thursday night we see the US Fed decide on interest rates, if either of these important prints fail to ignite markets in some manner it might become a long dreary run into Christmas.
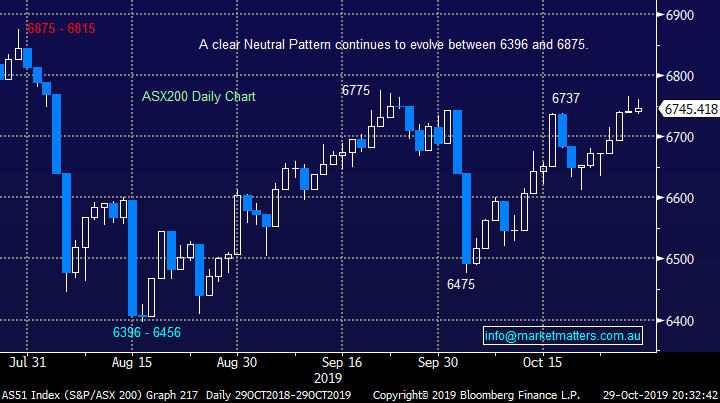
MM remains neutral the ASX200 with a pullback towards 6600 feeling more likely by the day.
Overnight US stocks closed unchanged except the IT based NASDAQ which slipped almost -0.8%, the SPI futures are calling the ASX200 to open down around 20-points which will trigger a short-term move to 6600 on a technical basis.
Today we’ve kept our finger on the pulse of global markets as underlying themes discussed last week remain core to our views i.e. the $US will fall, cyclicals will outperform defensives, stocks are mildly bullish and interest rates are bottoming – a bit “charty” today but it’s the best way to illustrate our thoughts. **For those interested, I’ll be on CNBC Asia at 3pm today**
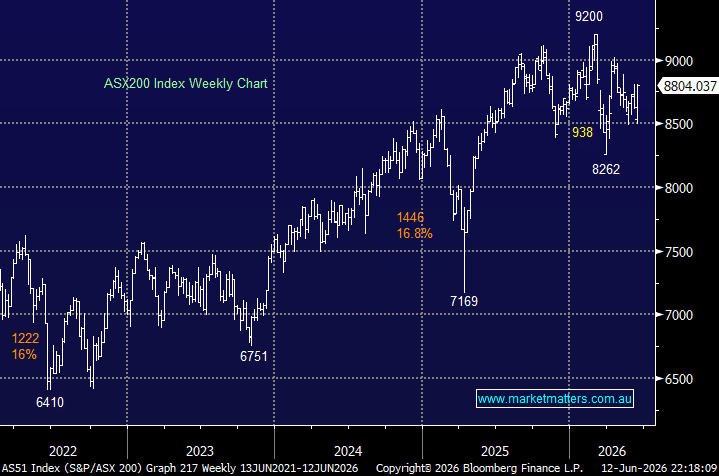
ASX200 Chart
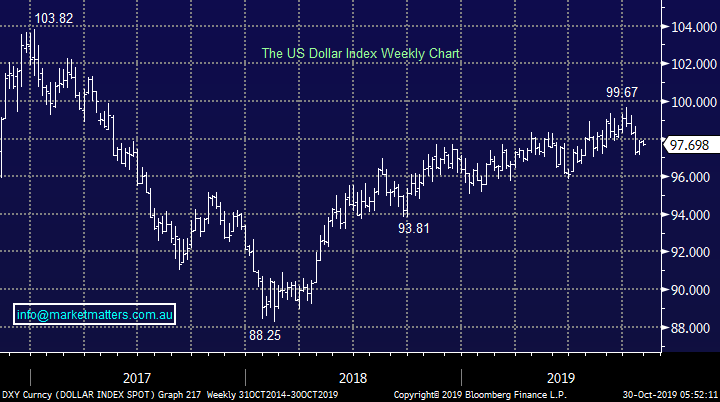
The $US remains “toppy”
The chart below illustrates that the recent pullback in the $US is only a blip compared to the last few years rally when / if markets do fully embrace what we believe is a major change in trend the ramifications are likely to be significant for relative sector performance. At the very least the risk / reward for investors positioned for an ongoing rally in the $US is very unappealing to MM.
MM is bearish the $US which is by definition bullish the metals / miners.
$US Index Chart
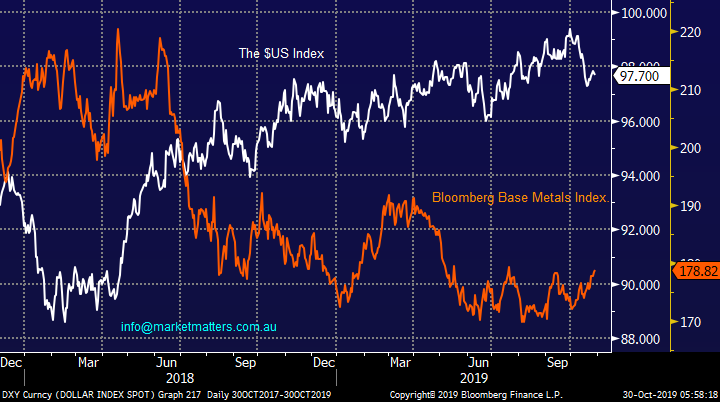
The chart below shows the inverse correlation between the $US and base metal prices over the last 18-months implying strongly that if we’re correct and the $US is due for a significant pullback then base metal prices should rally.
MM remains long & bullish the mining sector.
$US Index v Base Metals Chart
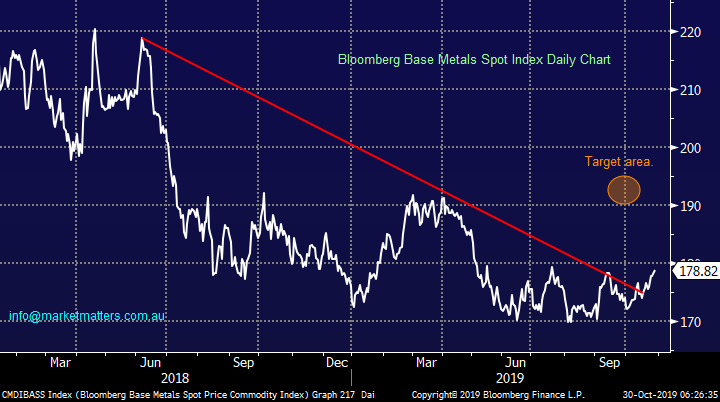
When we look at base metal prices on their own over the last few years the clear downtrend that’s been in play for 18-months is being broken, our initial upside target is ~10% higher which is likely to ignite the likes of OZ Minerals (OZL).
MM remains bullish the base metals.
Bloomberg Base Metals Index Chart
Bond yields continue to lead sector rotation
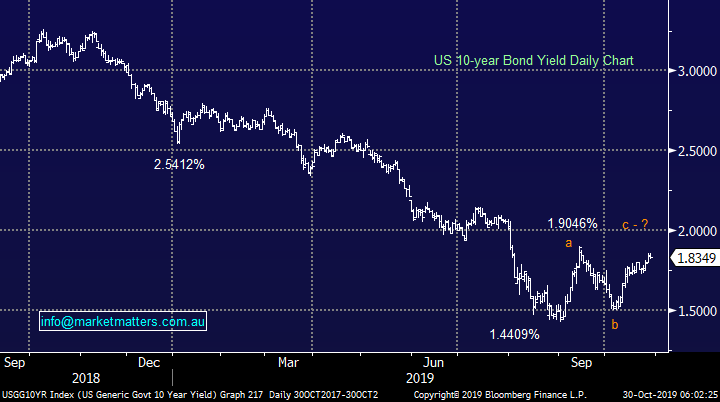
While we still believe it’s way too early to be talking about an end to the multi-decade bear market for interest rates MM does believe they are reaching, or already have reached, the nadir of the descent. Our strong opinion remains that interest rate cuts are failing to stoke the economic embers( just look at Europe) and Governments will be forced to step in with more aggressive fiscal measures while central banks could circle back around to more unconventional policies - these moves, if they were to play out, would be inflationary.
In the short-term we can see one final dip by US 10-year bond yields towards 1.4% but this is getting very close to attempting to interpret the day to day noise that reverberates through markets as news flows across our screens.
If we see bond yields make another low MM believes it’s an ideal opportunity to increase our cyclical over growth / defensive stance.
US 10-year bond yield Chart
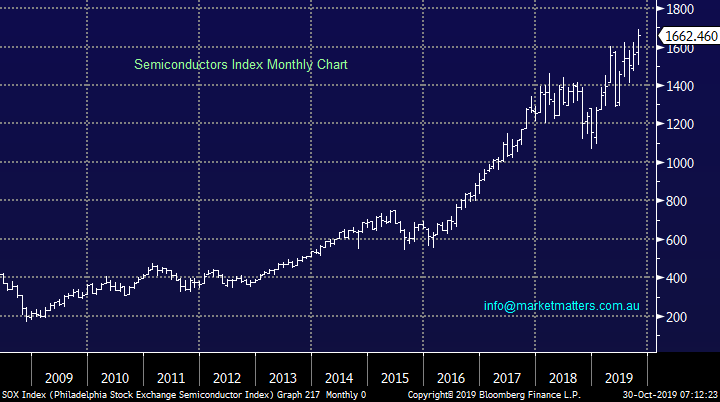
Our opinion remains firm that rotation is the main game in town, we’ve been discussing our view that it’s time to switch from defensives / growth to value moving into 2020 and an excellent leading indicator is supporting this view. Over the years the semiconductors index has proven itself to be an excellent leading indicator for both the cyclical stocks and overall market – the semiconductors are breaking to new highs and while its hard to see momentum gathering at this stage its still an underlying bullish sign.
MM is bullish into 2020 while the semiconductors can hold above 1575.
US S&P500 Semiconductors Index Chart
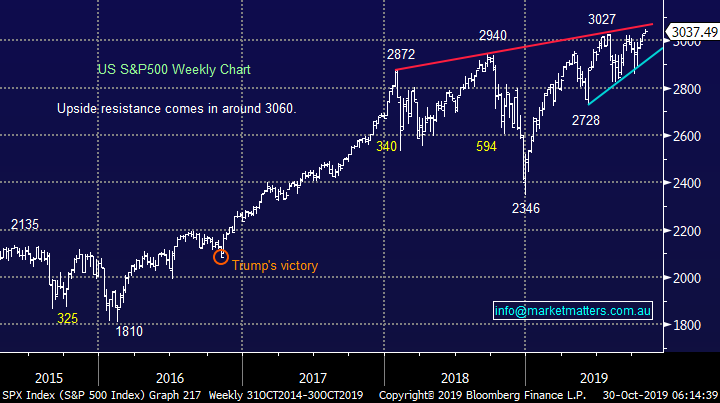
Stock markets remain neutral / positive.
US stocks in particular continue to “climb a wall of worry” with very few news articles focusing on how cheap equities remain when compared to today’s interest rates, its hard to imagine a meaningful decline while fund manages are so cautious / bearish – assuming President Trump doesn’t move the goal posts on trade.
MM can see the market grinding for many weeks between the support and resistance lines shown below.
US S&P500 Index Chart
International Equites Portfolio
Last week we added BHP (London) and JP Morgan (JPM) to our International Portfolio reducing our cash position to 48% : https://www.marketmatters.com.au/new-international-portfolio/
At this stage there are 2 areas where we would like to increase our exposure for the MM International Portfolio.
Resources
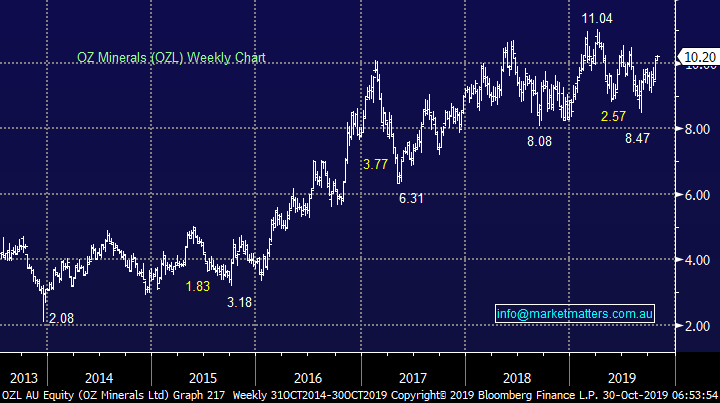
We obviously have BHP in the portfolio following last week’s purchase but we are keen to increase our exposure as this view continues to unfold as expected. This feels like a classic case of “keep it simple stupid” (KISS) we are very keen on OZ Minerals (OZL) which we hold in the Growth Portfolio, it’s our favourite addition to the International Portfolio – remember Australian stocks can be in an International Portfolio.
MM is bullish OZL and likes it for our International Portfolio.
OZ Minerals (OZL) Chart
Emerging Markets
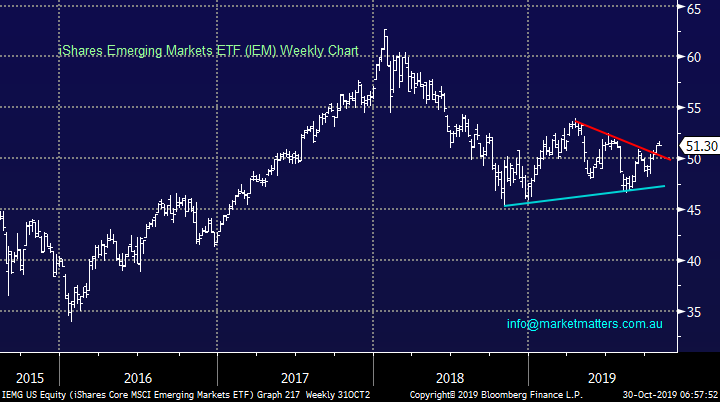
We remain bullish Emerging Markets over the year ahead, the simplest way to get exposure to this view is via the iShares Emerging Markets ETF (IEM) – the major 3 holdings at present are Tencent, Alibaba and Taiwan Semiconductor Manufacturing.
MM is bullish the Emerging Markets IEM ETF.
iShares Emerging Markets ETF (IEM) Chart
Conclusion (s)
MM likes the 2 positions mentioned above to complement our existing holdings in our International Portfolio.
Watch the pm reports for alerts.
MM Global Macro ETF Portfolio
Last week we tweaked our MM Global Macro Portfolio through purchase of BetaShares Global Banks ETF (BNKS), iShares Emerging markets ETF (IEM) and Global X Copper Miners ETF (COPX US) taking our cash level to 51.5%. : https://www.marketmatters.com.au/new-global-portfolio/
This leaves only a couple of our current macro views which MM hold that we have not yet implemented:
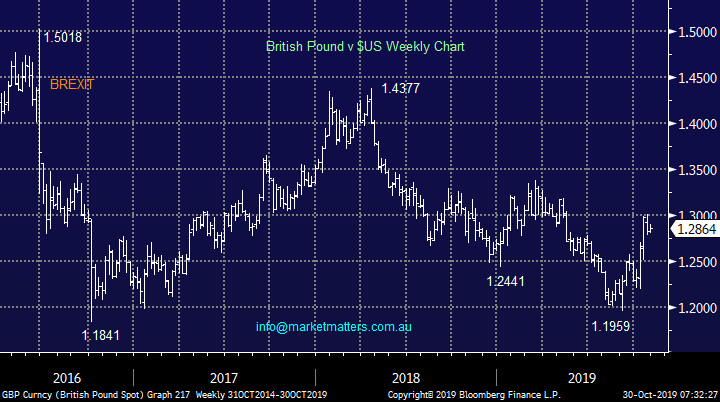
1 - Our thoughts around BREXIT and the UK election remain positive hence our comfort in holding Janus Henderson (JHG) in both the Platinum and International Portfolios, following the recent pullback as an election looms in just a few weeks we believe the road of uncertainty is almost over for the UK – good news in our opinion assuming Labor don’t win the election
Our preferred ETF to invest in the Pound is the Invesco ETF: https://www.invesco.com/portal/site/us/investors/etfs/product-detail?productId=FXB
British Pound v $US Chart
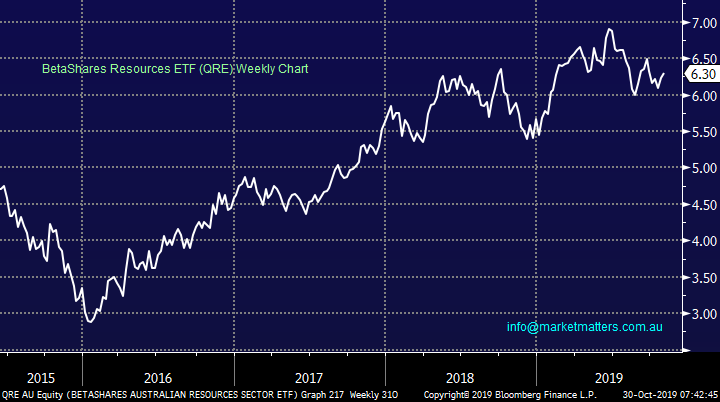
2 – lastly we feel our bullish resources view can best be played using an Australian based ETF, no currency considerations.
Our preferred ETF for long resources exposure is via the BetaShares QRE ETF (QRE) : https://www.betashares.com.au/fund/resources-sector-etf-betashares/
BetaShares Resources ETF (QRE) Chart
Conclusion (s)
Of the 2 ETF’s MM looked at today we like both to “fit” our global macro view on markets.
Watch the pm reports for alerts.
Overnight Market Matters Wrap
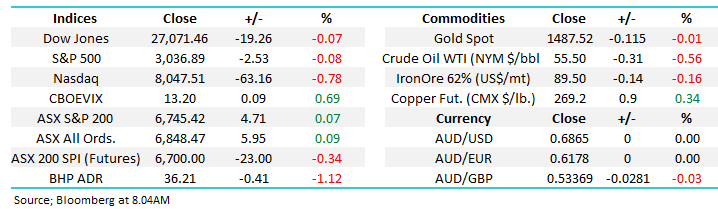
· The Australian market is poised to open lower this morning with the XJO future currently down 23 points. There was very little movement in the US with the Dow down .07%, S&P 500 down .09% and the worst performing of the three the NASDAQ down 0.59%
· The US markets were hurt by the flip flop trade battle. With a report coming out last night saying the partial deal may not actually be signed next month. Healthcare had a good night with Merck and Pfizer reporting good results. The weakness in the NASDAQ was due in part to Alphabet and Akamai earnings dropping.
· Metals on the LME had a good night with copper and nickel trading higher nickel being the better performer closing up 1.2%. Iron ore was -1.5% to $US86.64 a tonne. Oil and Gold both had a weaker night with spot gold currently trading at US$1490/oz. AUD/USD cross is currently 68.64c.
· This morning we have WOW 1Q Sales out today. Also AGM’s from DXS, NXT, and NHF.
Have a great day!
James & the Market Matters Team
Disclosure
Market Matters may hold stocks mentioned in this report. Subscribers can view a full list of holdings on the website by clicking here. Positions are updated each Friday, or after the session when positions are traded.
Disclaimer
All figures contained from sources believed to be accurate. All prices stated are based on the last close price at the time of writing unless otherwise noted. Market Matters does not make any representation of warranty as to the accuracy of the figures or prices and disclaims any liability resulting from any inaccuracy.
Reports and other documents published on this website and email (‘Reports’) are authored by Market Matters and the reports represent the views of Market Matters. The Market Matters Report is based on technical analysis of companies, commodities and the market in general. Technical analysis focuses on interpreting charts and other data to determine what the market sentiment about a particular financial product is, or will be. Unlike fundamental analysis, it does not involve a detailed review of the company’s financial position.
The Reports contain general, as opposed to personal, advice. That means they are prepared for multiple distributions without consideration of your investment objectives, financial situation and needs (‘Personal Circumstances’). Accordingly, any advice given is not a recommendation that a particular course of action is suitable for you and the advice is therefore not to be acted on as investment advice. You must assess whether or not any advice is appropriate for your Personal Circumstances before making any investment decisions. You can either make this assessment yourself, or if you require a personal recommendation, you can seek the assistance of a financial advisor. Market Matters or its author(s) accepts no responsibility for any losses or damages resulting from decisions made from or because of information within this publication. Investing and trading in financial products are always risky, so you should do your own research before buying or selling a financial product.
The Reports are published by Market Matters in good faith based on the facts known to it at the time of their preparation and do not purport to contain all relevant information with respect to the financial products to which they relate. Although the Reports are based on information obtained from sources believed to be reliable, Market Matters does not make any representation or warranty that they are accurate, complete or up to date and Market Matters accepts no obligation to correct or update the information or opinions in the Reports. Market Matters may publish content sourced from external content providers.
If you rely on a Report, you do so at your own risk. Past performance is not an indication of future performance. Any projections are estimates only and may not be realised in the future. Except to the extent that liability under any law cannot be excluded, Market Matters disclaims liability for all loss or damage arising as a result of any opinion, advice, recommendation, representation or information expressly or impliedly published in or in relation to this report notwithstanding any error or omission including negligence.