Will a “Trade War” resolution be the catalyst to ignite the Energy Sector? (SSM, NWH, PDL, WPL, COE, OSH, STO, BPT)
The ASX200 roared back to life on Thursday straight after threatening to retest 6600, I guess we shouldn’t be surprised it’s been the nature of the beast this financial year. Almost amusingly the day after we maintained our cautious to short-term bearish outlook towards the Australian IT Sector it exploded back to life gaining over +3% to be the best performing group on the ASX. An excellent report from Xero (XRO) appeared to be the positive catalyst for the growth sector while NAB’s report was refreshingly void of nasty surprises leading to a solid +2.2% recovery by the bank.
I was on BUY HOLD SELL for livewire markets this week covering those said ‘WAAAX’ stocks…

Overall the big 4 banks rallied an average of +1.18% yesterday outperforming the broad market in the process. Westpac’s now back within a hairs breath of its price before Tuesdays disappointing result, encouraging considering they raised $2bn at $25.32 i.e. 8% below yesterdays close, no doubt there will be strong demand for the SPP from the ~600,000 retail investors. However most importantly we remain long and bullish the Banking Sector, one of our current classic value plays.
MM has not hidden its preference for cheaper value over growth into 2020, a rotation which clearly failed yesterday but when I see headlines like “French 10-year yield turns positive for first time since July” it helps me feel relaxed with this view. With a US – China trade deal appearing imminent the platform is certainly in place for the resources to perform, lets hope the markets not too long in anticipation. Overnight US 10-year bond yields rallied strongly back towards 2% as optimism on a positive trade deal gathered momentum i.e. good for banks / energy but bad for Real Estate, Utilities and gold.
Short-term MM remains neutral the ASX200.
Overnight global stocks remained well bid on the developing story around US – China trade. US 10 year bond yields moved above
This morning MM has looked at the Energy Sector as planned following bullish comments that the US will roll back tariffs on China if / when a deal is signed, a potential catalyst for economic growth and hence oil.
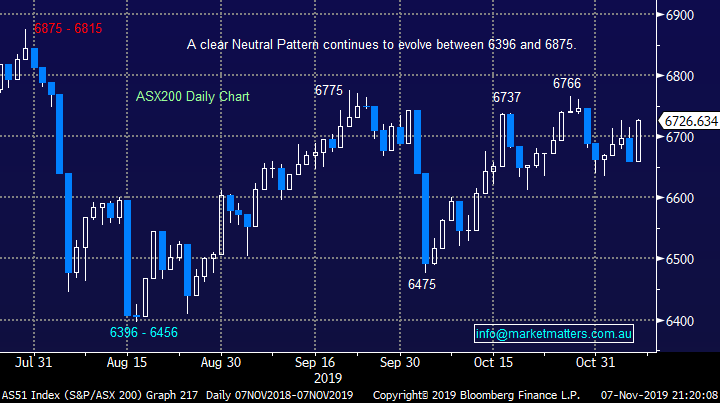
ASX200 Chart
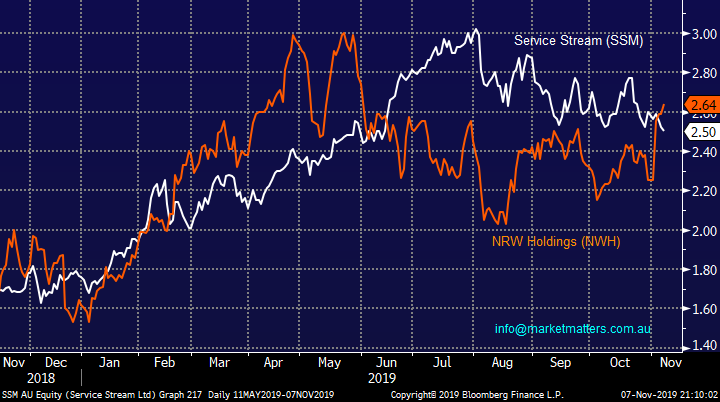
MM went long Service Stream (SSM) and NRW Holdings (NWH) back on the 21st of October and with NWH up +11.4% while SSM down -9.1% we thought it was an opportune time to review both positions:
1 – Mining services business NWH is moving nicely, we remain bullish with our target ~20% higher.
2 – Networks services operator SSM has struggled since we went long courtesy of a major sell down by the CEO, never a good sign. We are watching this one very carefully, it’s a definite candidate to be switched if it can’t hold current around current levels.
MM remains comfortable with our 3% holdings in SSM and NWH for now.
Service Stream (SSM) & NRW Holdings (NWH) Chart
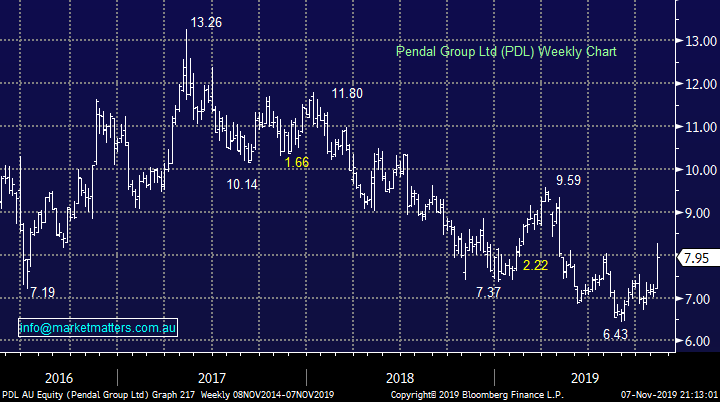
MM went long investment manager Pendal Group (PDL) yesterday into a pullback courtesy of an overnight sell recommendation from UBS, hopefully they gave us the opportunity to go long into a little weakness. Technically stops can be run under $7.30, less than 10% away.
MM maintains our $9.50 target for PDL.
Pendal Group (PDL) Chart
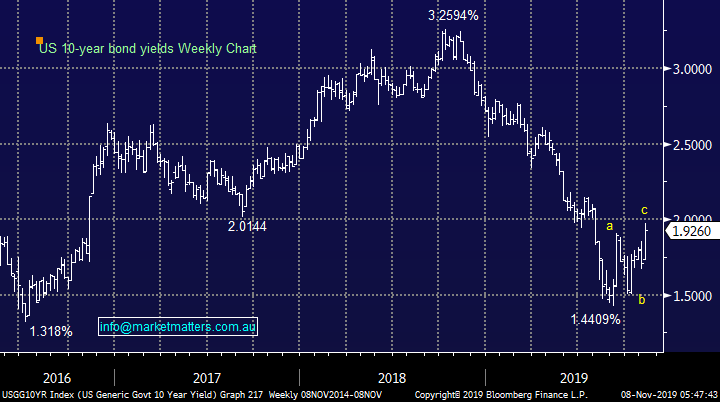
As we mentioned earlier, US 10-year bond yields rallied strongly overnight sending the classic US yield plays Real Estate and Utility sectors down over 1%, plus gold fell almost 2% to test critical $US1460 support.
We are now 50-50 on US bond yields, we expected this “pop” higher but whether it’s a change in trend or a simple “abc correction” is clearly up for debate. A close back under 1.9% would generate a bearish technical signal, we are watching this very carefully as it has huge implications for our gold position, rising interest rates without inflation is a bad backdrop for gold stocks.
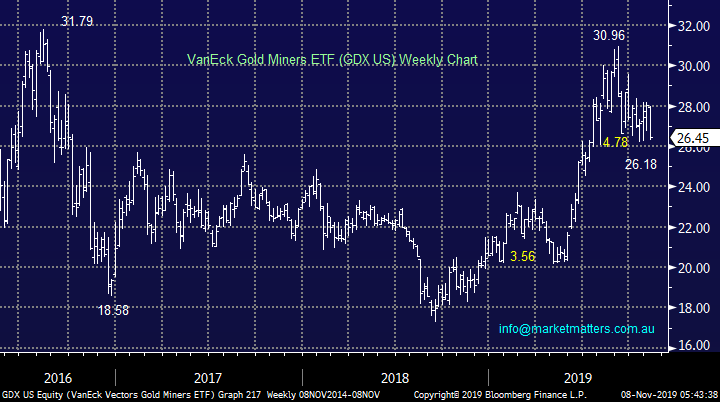
MM remains cautious gold at current levels and is not considering increasing our position.
US 10-year Bond Yields Chart
VanEck Gold Miners ETF (GDX US) Chart
The Energy Sector is starting to catch out eye
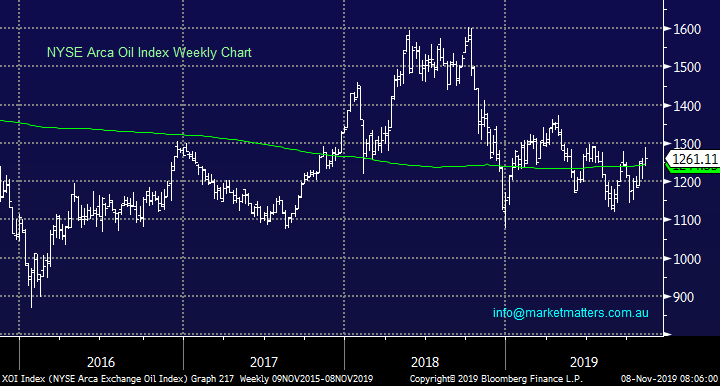
Unlike the metals and miners the Energy Sector has not been convinced by increasing optimism coming from the US – China trade talks, or perhaps simply the underlying supply & demand for crude oil is relatively balanced and we won’t see a break to the current $US50-65/barrel trading range which would by definition make copper stocks more attractive than the oil alternative.
The US oil sector has broken its 200-day moving average but as the chart below illustrates it’s not convincing at this point in time, even after positive trade news sent crude up over 2% last night.
MM cautiously optimistic the Energy Sector.
NYSE Arca Oil Index Chart
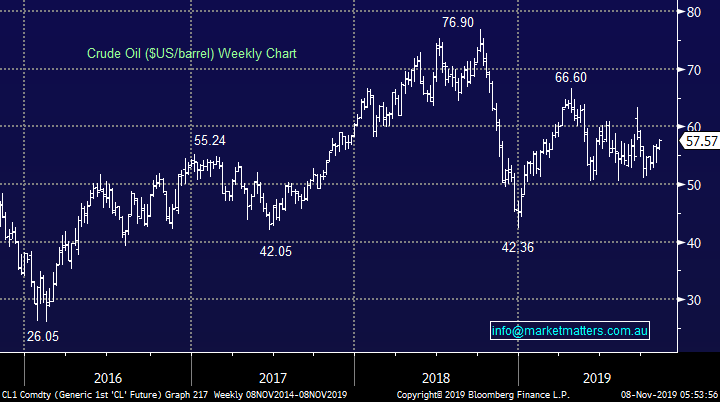
Not surprisingly the crude oil chart is almost an exact copy of the US and Australian Energy Sectors, it remains in a clear range plus seasonally this is the commodities weakest monthly period – to get particularly excited around a commodity in a time of the year when its usually weak we ideally prefer a more positive technical picture, not a simple sideways mess.
Crude Oil ($US/barrel) Chart
Moving onto a brief look at 5 stocks within the Australian Energy Sector, just because the sectors not particularly inspiring doesn’t mean there won’t be 1 or 2 gems under the hood from a risk / reward perspective.
However we are cognisant that one of the largest companies in the world, the Saudi Arabian Oil Company (Aramco) will likely IPO in the near future, touted to initially raise $US40-45bn, this will probably suck some significant buying out of the existing listed players in the sector.
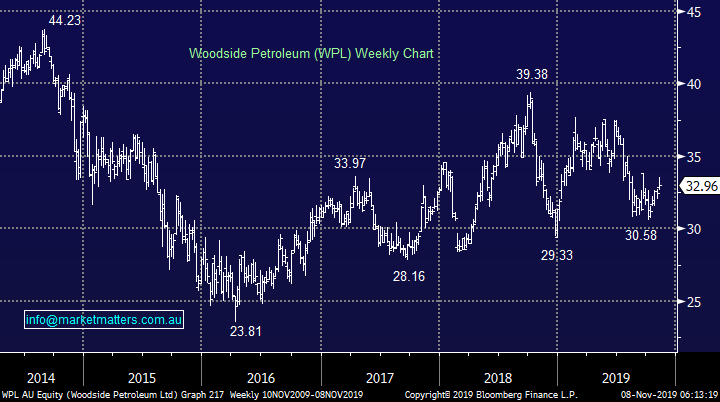
1 Woodside Petroleum (WPL) $32.96
Sector heavyweight WPL is trading at the same price as it was in 2015, it feels like a good yield play but no more at this point in time i.e. its forecast to pay almost 5% fully franked into 2020.
At the operational level, this oil & gas producer has a portfolio of projects that should enable a steady increase in earnings and thus dividends over time, with production tipped to increase more rapidly next calendar year. They hold at invest day on the 19th of this morning with more details likely to come from that.
MM is neutral WPL.
Woodside Petroleum (WPL) Chart
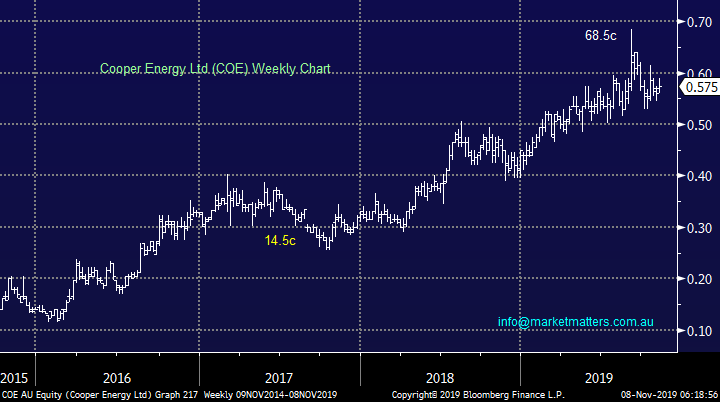
2 Cooper Energy Ltd (COE) 57.5c
Cooper Energy is the minnow of the group although its $932m market cap is not to be sniffed at. This South Australian focused oil & gas explorer has enjoyed a strong run with its shares aided by a new gas field discovery in September. This underpins strong expected production growth in FY20 & 21 with forecast production set to double in both of those years.
This is a solid business which MM likes into pullbacks with +20% rallies in 2020 easy to imagine.
MM is bullish targeting fresh 2019 highs.
Cooper Energy Ltd (COE) Chart
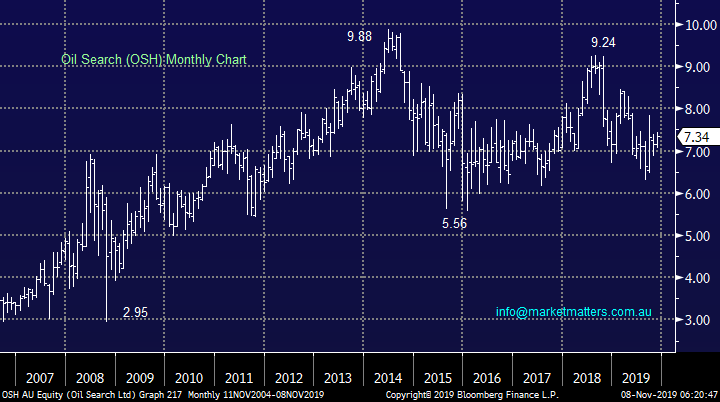
3 Oil Search (OSH) $7.34
This Paua New Guinea based oil and gas producer like big brother WPL hasn’t really moved in recent years giving us no clues technically while fundamentally it also feels in limbo. They had recent production issues thanks to bad weather and this means cost expectations have been ratcheted up for this year. It also seems that the market has become concerned around PNG particularly after a warrant was issued for the former Prime Minister Peter O’Neill on suspicion of corruption. This comes close on the heels of the retirement announcement of long standing Oil Search MD Peter Botten.
At the operational side, production really ramps up 2024/25 however the next few years are more muted.
MM is neutral OSH.
Oil Search (OSH) Chart
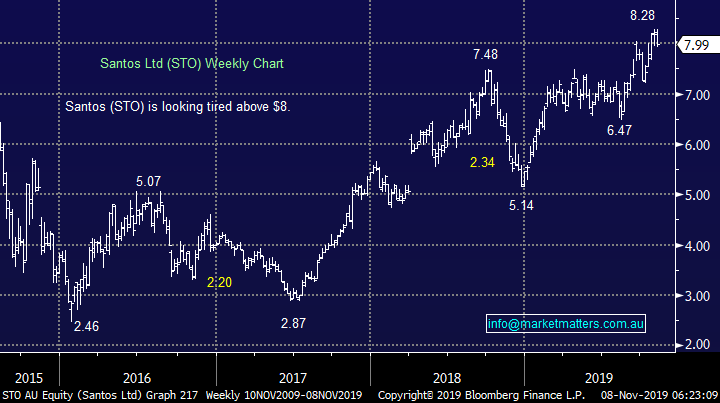
4 Santos Ltd (STO) $7.99
This energy producer enjoyed revenue above $1bn last quarter and the stock’s performance has reflected the recent strength within the business. We were too pedantic around $7 with STO and feel chasing it here could be a classic case of FOMO, we will remain in the stalls for now. However STO is one of the most leveraged plays to a rally in the oil price, what is interesting that’s its remained firm even while oil has pulled back given their strong production growth, more corporate activity would not surprise.
MM is neutral STO around $8 but likes the stock, its just tricky to buy it here.
Santos Ltd (STO) Chart
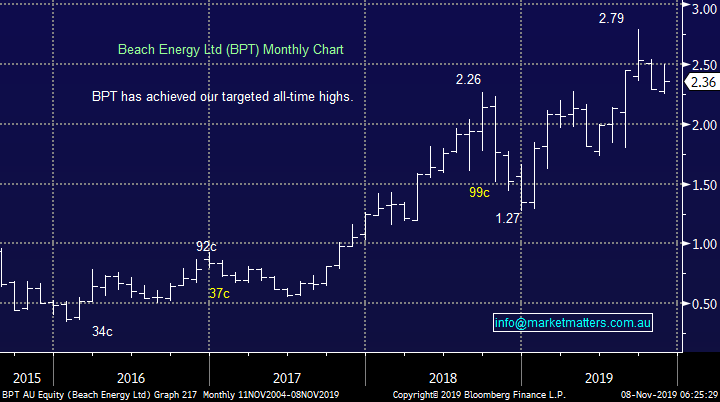
5 Beach Energy (BPT) $2.36
BPT has been a standout sector performer over the last 2-years with its full-year result back in August sending the stock surging towards $3 – earnings surged close to 90% coming in at $560m.
MM is neutral / positive BPT.
Beach Energy (BPT) Chart
Conclusion (s)
MM has lost its enthusiasm slightly for the Energy Sector during the writing of today’s report, we are now sitting in the neutral corner.
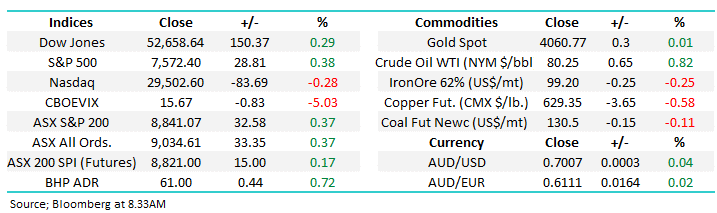
Global Indices
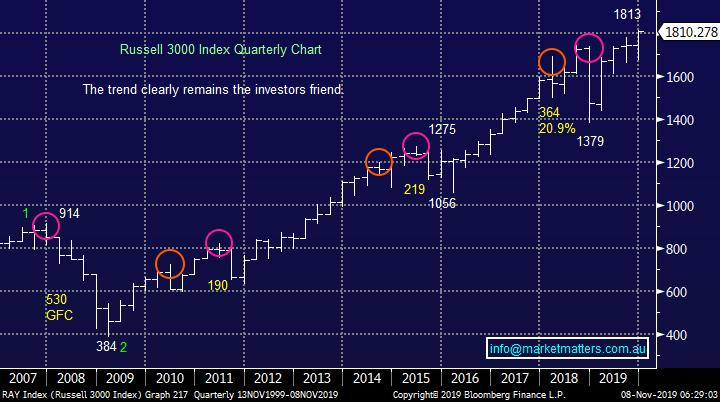
No major change, we had given the benefit of the doubt to the post GFC bull market and fresh all-time highs have been achieved as anticipated, a close well under 1750 for the Russell 3000 is required to switch us to a bearish short-term stance.
MM is now neutral / positive US stocks.
US Russell 3000 Index Chart
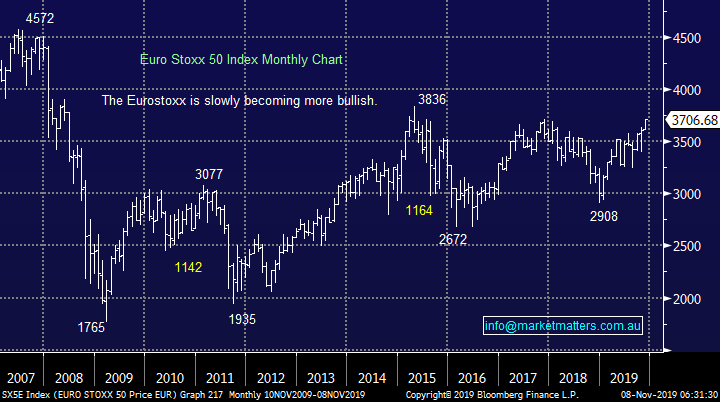
European indices continue to “climb a wall of worry” at this point in time MM is neutral but we maintain our slight positive bias.
Euro Stoxx50 Chart
Overnight Market Matters Wrap
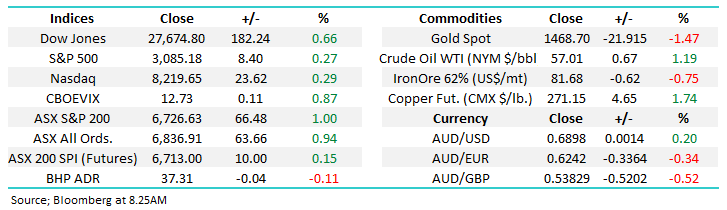
- International markets are telling us its risk-on today, with equities and oil higher, while gold and bonds have sold off. US government bond yields have surged to 1.92%, while gold has fallen to $US1470/oz.
- Despite the risk-on sentiment, the SPI is just 11 points higher as our market outperformed yesterday. The Dow closed 0.7% higher, while the NASDAQ rallied 0.3%. The S&P 500 also made small gains, ~+0.3%.
- Moving markets again was positive talk around potential for a US-China trade deal. As part of the phase one agreement, both sides have agreed to remove tariffs at the same time. US markets hit fresh all-time highs, while European stocks are at four year highs.
- Copper surged on the LME, while iron ore fell a touch to ~$US83/t. WTI oil rose 1% on US-China trade progress which outweighed the news that OPEC+ won’t be pushing for deeper cuts to production.
- The September SPI Futures is indicating the ASX 200 to open 14 points higher towards 6741
Have a great day!
James & the Market Matters Team
Disclosure
Market Matters may hold stocks mentioned in this report. Subscribers can view a full list of holdings on the website by clicking here. Positions are updated each Friday, or after the session when positions are traded.
Disclaimer
All figures contained from sources believed to be accurate. All prices stated are based on the last close price at the time of writing unless otherwise noted. Market Matters does not make any representation of warranty as to the accuracy of the figures or prices and disclaims any liability resulting from any inaccuracy.
Reports and other documents published on this website and email (‘Reports’) are authored by Market Matters and the reports represent the views of Market Matters. The Market Matters Report is based on technical analysis of companies, commodities and the market in general. Technical analysis focuses on interpreting charts and other data to determine what the market sentiment about a particular financial product is, or will be. Unlike fundamental analysis, it does not involve a detailed review of the company’s financial position.
The Reports contain general, as opposed to personal, advice. That means they are prepared for multiple distributions without consideration of your investment objectives, financial situation and needs (‘Personal Circumstances’). Accordingly, any advice given is not a recommendation that a particular course of action is suitable for you and the advice is therefore not to be acted on as investment advice. You must assess whether or not any advice is appropriate for your Personal Circumstances before making any investment decisions. You can either make this assessment yourself, or if you require a personal recommendation, you can seek the assistance of a financial advisor. Market Matters or its author(s) accepts no responsibility for any losses or damages resulting from decisions made from or because of information within this publication. Investing and trading in financial products are always risky, so you should do your own research before buying or selling a financial product.
The Reports are published by Market Matters in good faith based on the facts known to it at the time of their preparation and do not purport to contain all relevant information with respect to the financial products to which they relate. Although the Reports are based on information obtained from sources believed to be reliable, Market Matters does not make any representation or warranty that they are accurate, complete or up to date and Market Matters accepts no obligation to correct or update the information or opinions in the Reports. Market Matters may publish content sourced from external content providers.
If you rely on a Report, you do so at your own risk. Past performance is not an indication of future performance. Any projections are estimates only and may not be realised in the future. Except to the extent that liability under any law cannot be excluded, Market Matters disclaims liability for all loss or damage arising as a result of any opinion, advice, recommendation, representation or information expressly or impliedly published in or in relation to this report notwithstanding any error or omission including negligence.