Overseas Wednesday – International Equities & ETF Portfolios (FMG, SGM, BSL, OZL, TECK US, C US, IEM US, BABA US, 700.HK, TTD US)
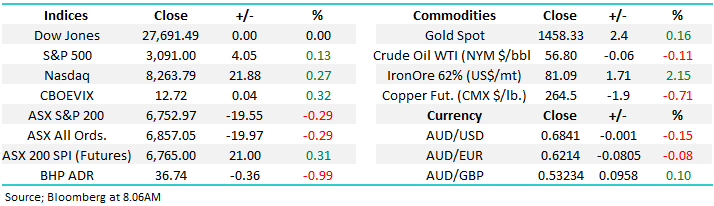
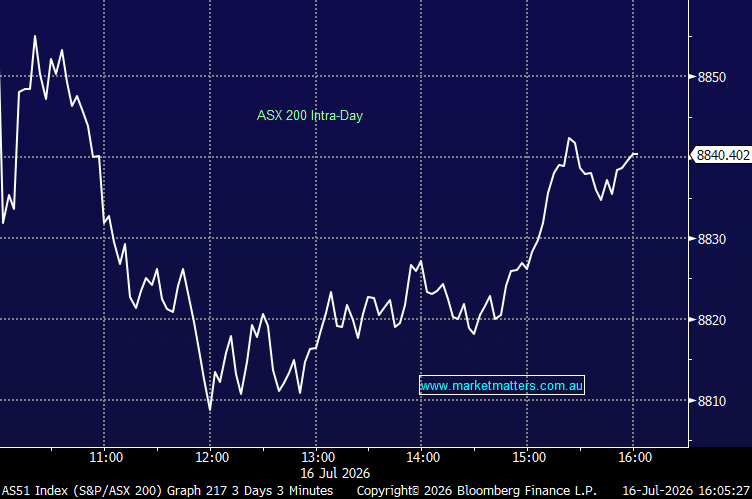
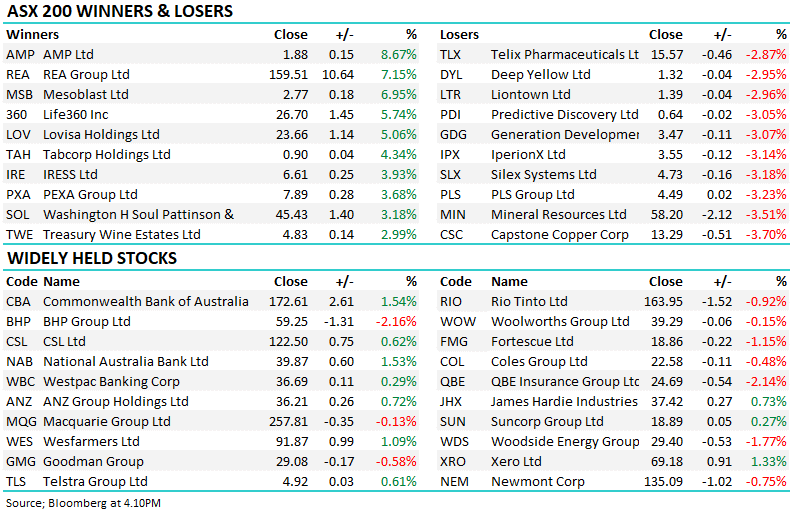
The ASX200 experienced a fairly choppy Tuesday and ultimately closed only 19-points weaker after falling closer to 40-points into lunch, yet another example of buyers emerging into any weakness. Banks enjoyed some reasonable headlines for a change with CBA delivering a solid trading update sending its shares up 1% while Westpac traded ex-dividend 80c fully franked, it finally closed almost 6% above the Share Purchase Plan (SPP) level – a good deal in our opinion.
Generally, the resources struggled as we flagged was likely in the morning report, while bond yields threaten to recommence their bear market value stocks and in particular the Materials Sector have started to wobble. MM remains bullish Value over Growth for 2020 but if we see fresh lows for global bond yields we do anticipate another test to the downside for the likes of BHP Group (BHP) and RIO Tinto (RIO) – a strong buying opportunity for 2020.
At this stage we see no reason to expect any major change to the stock, sector and index rotational mindset which equities have entered, until investors become convinced on the outlook for bond yields into 2020 we are likely to see ongoing arguments for both the value and growth sides of the curve when it comes to the opportune location for the bulk of an investors funds.
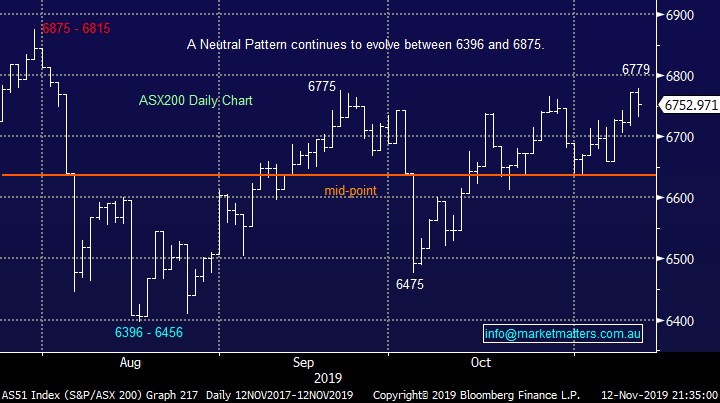
MM remains neutral the ASX200 with a slight bullish bias.
Overnight US stocks were again little changed but the sector trend looks to continue locally as the SPI Futures are calling the ASX200 up ~20-points yet BHP is down over 1% in the US – markets appear to be positioning themselves for another leg lower by bond yields.
Today we’ve continued to look for opportunities in the cyclical, emerging markets and resource stocks as our current “Buy cyclicals v defensives” enters a clear correctional phase – not great short term but great if we are correct for 2020.
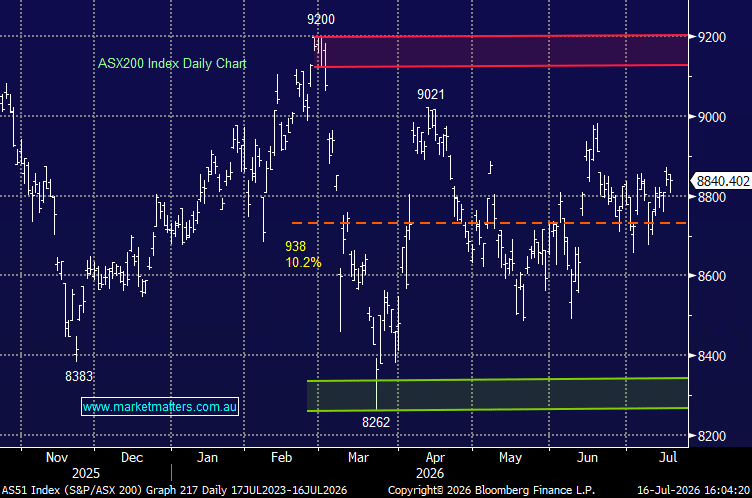
ASX200 Chart
Bingo $2.53 – AGM and FY20 Guidance issued this morning
We’ve been concerned about the potential for a downgrade from BIN in this morning’s AGM however that has not happened – the conference call starts shortly so we need to be on that - below the main points for now. We don’t own but have been looking to buy.
Positives
- FY20 underlying EBITDA range of $159m to 164m – vs. market average of $159m – the range was $136m to $179m
- Construction strength to continue in FY20 – esp commercial and infra (no surprise)
- Pricing in NSW has “stablilised”
- Group margins “expanding” – target 30% within 2 years vs. 25% in FY19
- CEO to increase stake from 15.2% to 19.8%
- Eastern Creek MPC2 construction on track
Negatives
- Residential weakness to continue in FY20 (no surprise)
- CFO retires and current CDO Chris Jeffrey takes over
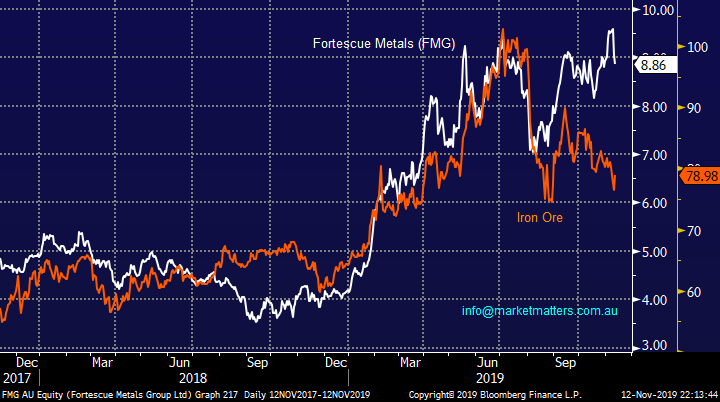
MM takes a nice profit on Fortescue (FMG)
MM followed our plan yesterday taking a nice 30% profit on our FMG position as it broke back under $9. As discussed previously we believe the WA miner has simply got ahead of the underlying iron ore price which it usually tracks extremely closely.
FMG has evolved into an excellent company which has become one of the best performing ASX stocks in recent times but we believe it’s now at nosebleed levels compared to iron ore which is threatening to fall towards its 2019 lows, from a risk / reward perspective we believe there’s a very good chance of re-entering FMG closer to $7, remember never underestimate the volatility of FMG.
MM is looking to buy back into FMG at lower levels.
Fortescue Metals (FMG) v Iron Ore Chart
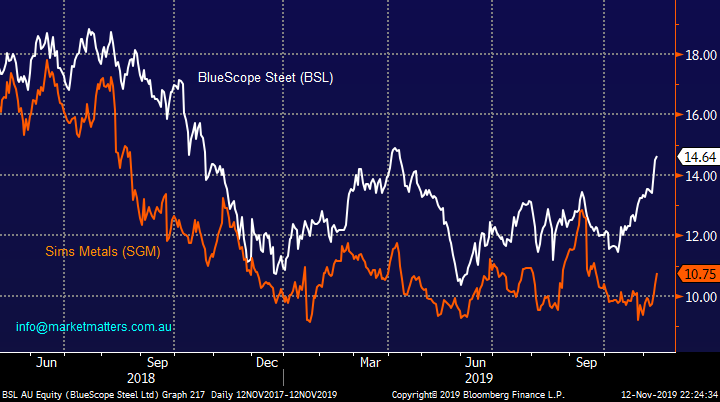
Yesterday MM looked to switch our BlueScope (BSL) position, taking a great 20% profit in the process, into Sims Metals (SGM) but we got caught with a “leg in the air” as traders so eloquently describe the situation i.e. we sold BSL but didn’t get set in SGM which rallied almost 4% on the day. Frustrating but that’s how the market goes sometimes - with SGM hosting an AGM later this week we feel reticent to chase the stock – we will stay on the bid around $10.65 for now.
Also, the resources sector appears to be in pullback mode hence some “extra” cash to increase our exposure at lower levels feels a prudent path to be walking.
Technically MM is bullish SGM initially targeting the $13 area.
BlueScope Steel (BSL) v Sims Metals (SGM) Chart
Bond yields continue to dominate proceedings
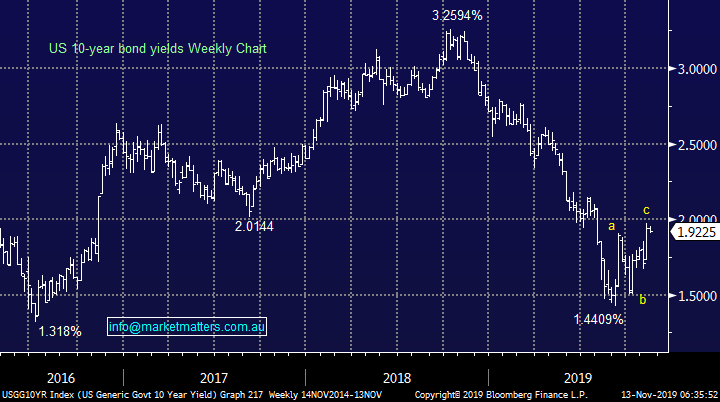
We still believe it’s far too early to be talking about an end to the multi-decade bear market for interest rates, but MM does believe they are close to a major point of inflection point. Our opinion remains central banks will implement fiscal stimulus in 2020 in an attempt to maintain post GFC economic activity, a move that is both potentially inflationary and an acknowledgement that further rate cuts will be futile – although of the major economic powers the US does have the most room to cut as the Don will tell anyone who listens!
In the short-term we ideally see one final dip by US 10-year bond yields towards 1.4% a move in our opinion that is likely to provide an excellent opportunity to buy the value stocks. As bond yields bounce / rally the greater the money appears to be flowing from the defensive stocks into likes of the resources, and vice versa of course.
If we see bond yields make another low MM believes it’s an ideal opportunity to increase further our cyclical overgrowth / defensive stance.
US 10-year bond yield Chart
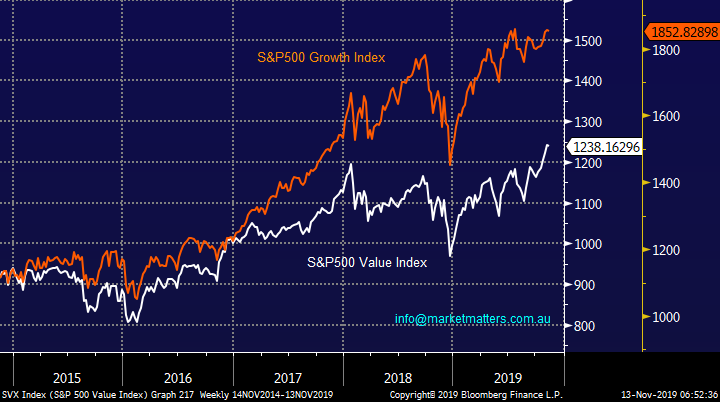
Our opinion remains firm that rotation is the main game in town, we’ve been discussing our core view that it’s time to switch from defensives / growth to value moving into 2020 for a while but it’s a major thematic change in trend and one that MM is likely to follow for most of next year – across our portfolios if we see bond yields make / test their lows for 2019 subscribers should expect us to sell our gold / silver positions and switch into the likes of nickel and copper.
MM remains bullish Value over growth / defensives into 2020.
US S&P500 Value & Growth Indices Chart
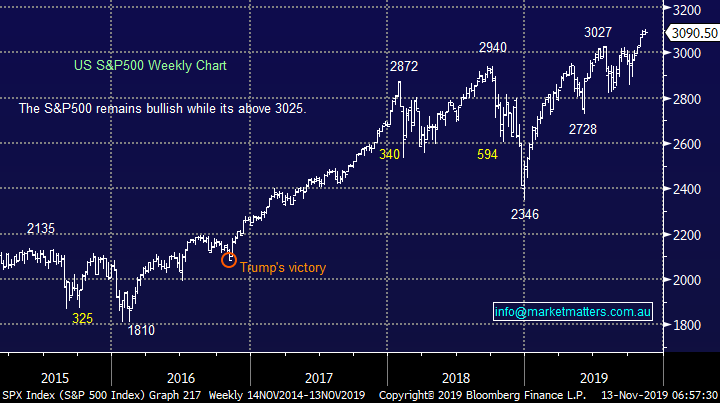
Stock markets remain neutral / positive.
No change, US stocks in particular continue to “climb a wall of worry” with very few news articles focusing on how cheap equities remain when compared to today’s interest rates, it’s hard to imagine a meaningful decline while fund managers are so cautious / bearish and the US-China continues to make progress on trade – pullbacks continue to be bought and tweets largely ignored, something that wasn’t happening earlier in the year.
We don’t believe investors should fight the trend but because we anticipate large sector rotation the gains are likely to be missing the usual aggressive upside momentum that fresh all-time highs can produce. However, the Put / Call ratio and Fear Index (VIX) have fallen to levels where a quick short-term pullback would not surprise.
MM can see equities grinding higher into Christmas with perhaps one hiccup along the way.
US S&P500 Index Chart
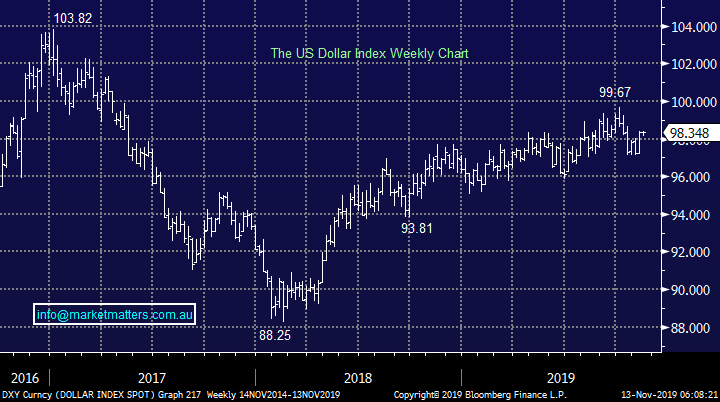
The $US is fighting to maintain its trend
President Trump has continued his attack on the Fed’s policy around interest rates as he’s “trumpeting” to anyone who would listen that by not embracing negative interest rates the Fed was hurting the US economy, supporting their currency and making the country less competitive although there obviously still doing ok. If / when he gets his way the $US is likely to be vulnerable to a significant decline.
Over the last week we’ve seen the $US bounce strongly in the direction of its medium-term bullish trend, no great surprise as entrenched bull markets rarely give up without a fight, we’re still targeting a 10-15% fall but it’s likely to require a policy / economic catalyst to begin any meaningful move lower. A declining $US is by definition positive for the Aussie $A but until we see a decent move in the $US it’s unlikely the local currency will break out of its current 68-69c trading range.
MM is bearish the $US which is by definition bullish the metals / miners & $A.
The $US Index Chart
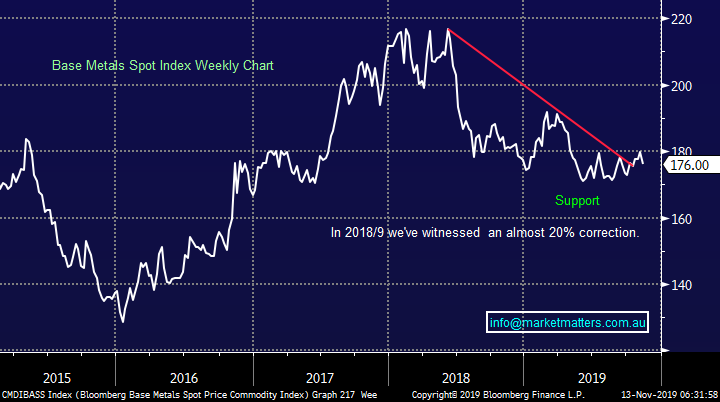
The base metal prices corrected last week as the $US rallied, all basic 101 inter-market related price action. However, they are slowly breaking their downtrend which has been in play for 18-months, our initial upside target remains ~10% higher but it’s going to be extremely tough going until we see the $US give up some of its last 18-months gains.
MM remains bullish the base metals and resource stocks.
Bloomberg Base Metals Index Chart
International Equites Portfolio
Last week there were no changes to our International Portfolio with our cash position remaining at 48% : https://www.marketmatters.com.au/new-international-portfolio/
While there remain 3 specific sectors where we would like to increase our exposure for the MM International Portfolio the possibility of a move lower by bond yields has left us twiddling our thumbs because if this does occur entry levels are likely to be far more attractive i.e. Patience for now but no changes in the plan. *Watch for alerts*
Resources
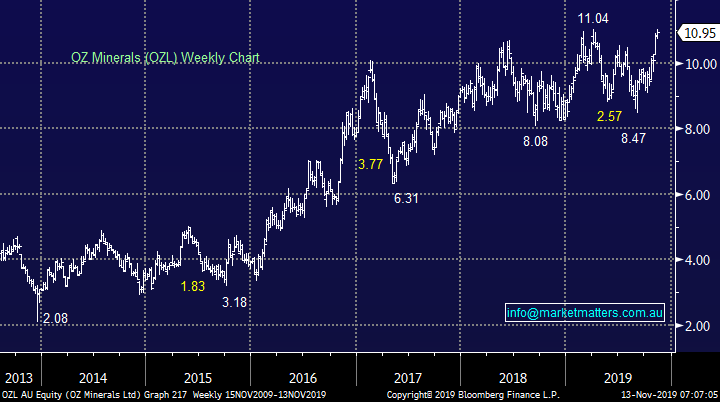
We obviously have BHP in the portfolio, but we are keen to increase our exposure as this view continues to unfold as expected. This still feels like a classic case of “keep it simple stupid” (KISS) we are very keen on OZ Minerals (OZL) which we hold in the Growth Portfolio, it’s currently our favourite addition to the International Portfolio – remember Australian stocks can be in an International Portfolio.
OZL can be a volatile beast, not unlike FMG discussed earlier, at this stage we are looking to buy the next 60c correction.
MM is bullish OZL and likes it for our International Portfolio.
OZ Minerals (OZL) Chart
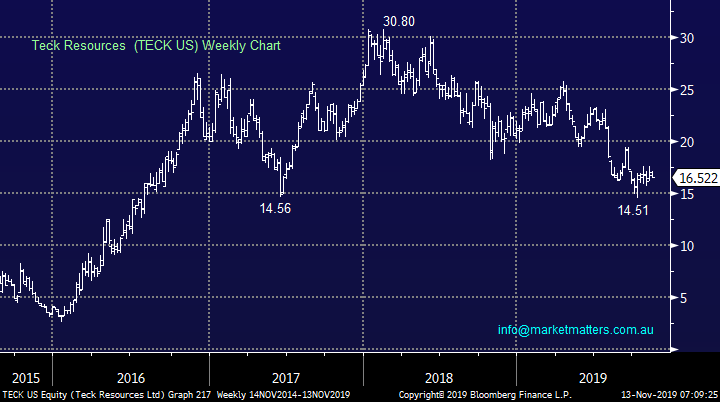
Also we still like US listed Teck Resources (TECK US) which is a $US9.6bn mining business based in Vancouver which has activities in zinc, copper, molybdenum, gold and metallurgical coal. The stocks almost halved since early 2018 showing its leverage to global trade and base metal prices, the stock looks poised to pop to the upside and the risk / reward is attractive to MM at current levels, or into a touch more weakness.
Unlike OZL this Canadian miner has weakened further over the week and our patience feels founded.
MM is bullish TECK and likes it for our International Equities Portfolio.
Teck Resources (TECK US) Chart
Banks
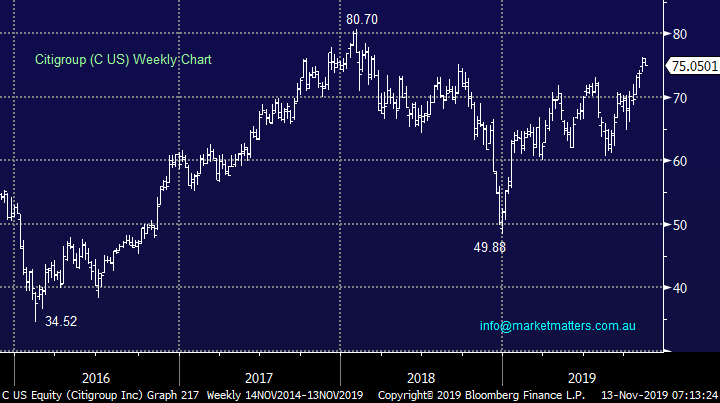
As subscribers know we are bullish the cyclical banking sector, this week we’ve seen the US KBW Banking Index consolidating fresh 2019 highs. We already happily hold 10% exposure via Bank of America (BAC) and JP Morgan (JPM US) but we are targeting another 5-10% moving into 2020 – our preferred option today is Citigroup (C US) plus we might consider adding to our existing holdings.
MM is bullish the cyclical US banks into 2020.
Citigroup (C US) Chart
Emerging Markets
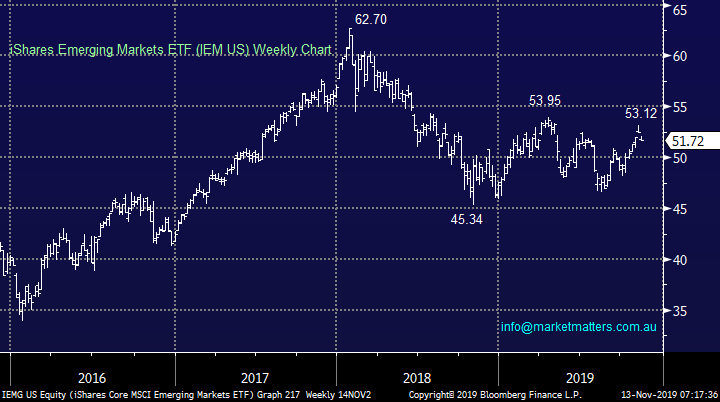
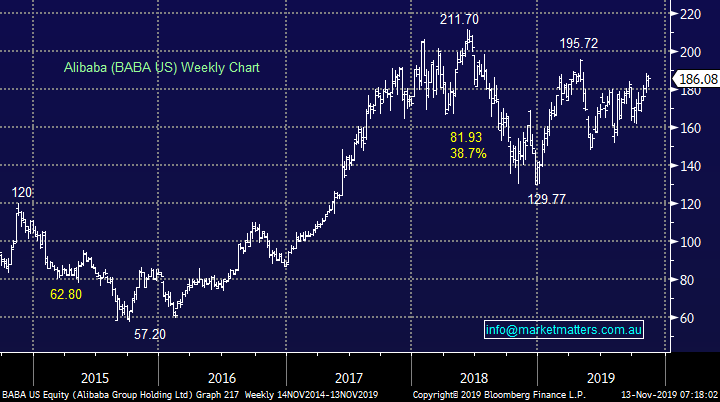
MM continues to like the Emerging Markets moving into 2020, a view strongly supported by our bearish $US view but one that has been under pressure as the $US bounces and social unrest in Hong Kong gathers momentum. Last week we said “Our preferred ways to play this view adding to our Samsung (005930 KS) and Ping An (2318 HK) position plus internet and e-commerce goliath Alibaba (BABA US).” We remain comfortable with this group plus 2 additions – Tencent (700 HK) & Trade Desk (TTD US).
Emerging Markets ETF (IEM US) Chart
Alibaba (BABA US) Chart
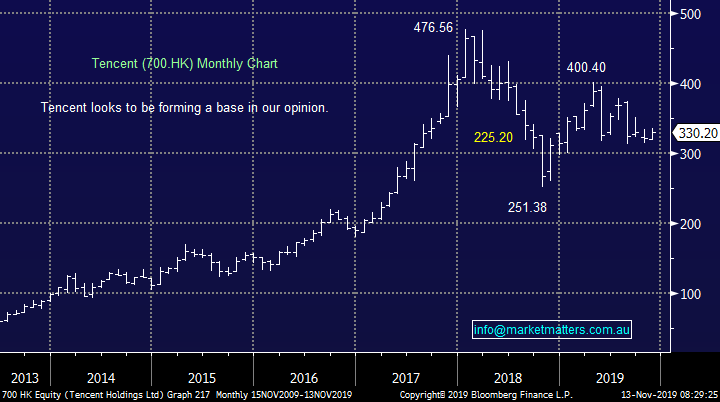
1 - On-line goliath Tencent has struggled of late but we like the way its holding current levels even as shares in the region struggle.
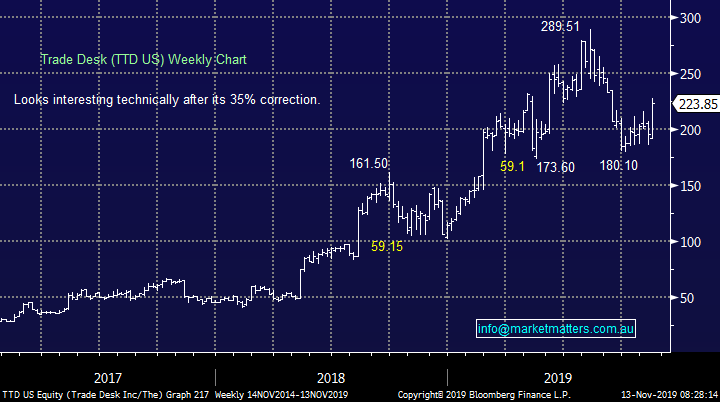
2 – Advertising technology platform Trade Desk (TTD) reported this week and the numbers and performance look good, we can be buyers with stops below $US210.
Tencent (700 HK) Chart
Trade Desk (TTD US) Chart
Conclusion (s)
MM likes the resources, banks and emerging markets into 2020, we expect to significantly increase our exposure to these areas once we are comfortable with the position of bond yields – they’re 50/50 at present to MM.
We like Tencent (700 HK) and Trade Desk (TTD US) at current levels – these 2 are less dependent on bond yields hence we may buy sooner rather than later.
MM Global Macro ETF Portfolio
Last week we didn’t change our Global Macro ETF Portfolio leaving our cash level at 51.5% as we watch bond yields closely. : https://www.marketmatters.com.au/new-global-portfolio/
Our strongest 2 views are unchanged: we are bullish the emerging markets and cyclical banks hence we are simply likely to increase our IEM and BNKS ETF positions, ideally into falling bond yield led weakness.
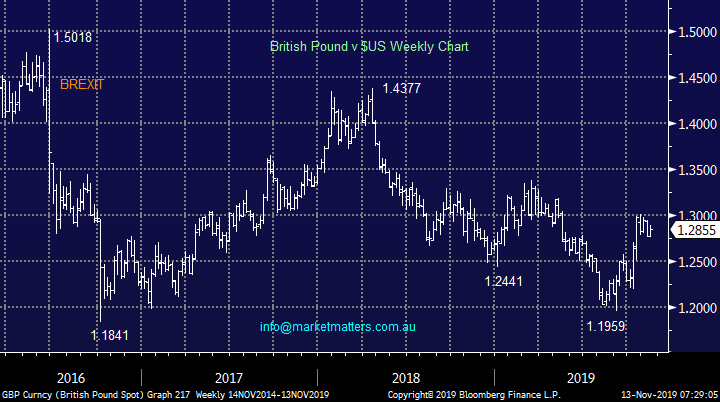
We still hold our macro view around BREXIT and the UK election i.e. we remain positive hence our comfort in holding Janus Henderson (JHG) in both the Platinum and International Portfolios.
Our preferred ETF to invest in the Pound remains the Invesco ETF: https://www.invesco.com/portal/site/us/investors/etfs/product-detail?productId=FXB
British Pound v $US Chart
Conclusion (s)
Not a lot of new views today across the board however patience sometimes is the key
We are likely to implement the 3 ideas moving forward but until we see some clarification from bond yields “buying the Pound” is the most likely button to be pressed.
Watch the pm reports for alerts.
Overnight Market Matters Wrap
- The US equity markets hit fresh highs early in the session overnight as President Trump reaffirmed and mentioned the US and China were close to signing a phase 1 trade deal, however investors worried and lost some faith as there were lack of any details on when a deal could be signed.
- On the commodities front, copper and crude oil were weaker, while the US 10-year bond yields slipped back to 1.91%.
- BHP is expected to underperform the broader market yet again, after ending its US session off an equivalent of -0.99% from Australia’s previous close.
- The December SPI Futures is indicating the ASX 200 to open 18 points higher, towards the 6770 level this morning.
James & the Market Matters Team
Disclosure
Market Matters may hold stocks mentioned in this report. Subscribers can view a full list of holdings on the website by clicking here. Positions are updated each Friday, or after the session when positions are traded.
Disclaimer
All figures contained from sources believed to be accurate. All prices stated are based on the last close price at the time of writing unless otherwise noted. Market Matters does not make any representation of warranty as to the accuracy of the figures or prices and disclaims any liability resulting from any inaccuracy.
Reports and other documents published on this website and email (‘Reports’) are authored by Market Matters and the reports represent the views of Market Matters. The Market Matters Report is based on technical analysis of companies, commodities and the market in general. Technical analysis focuses on interpreting charts and other data to determine what the market sentiment about a particular financial product is, or will be. Unlike fundamental analysis, it does not involve a detailed review of the company’s financial position.
The Reports contain general, as opposed to personal, advice. That means they are prepared for multiple distributions without consideration of your investment objectives, financial situation and needs (‘Personal Circumstances’). Accordingly, any advice given is not a recommendation that a particular course of action is suitable for you and the advice is therefore not to be acted on as investment advice. You must assess whether or not any advice is appropriate for your Personal Circumstances before making any investment decisions. You can either make this assessment yourself, or if you require a personal recommendation, you can seek the assistance of a financial advisor. Market Matters or its author(s) accepts no responsibility for any losses or damages resulting from decisions made from or because of information within this publication. Investing and trading in financial products are always risky, so you should do your own research before buying or selling a financial product.
The Reports are published by Market Matters in good faith based on the facts known to it at the time of their preparation and do not purport to contain all relevant information with respect to the financial products to which they relate. Although the Reports are based on information obtained from sources believed to be reliable, Market Matters does not make any representation or warranty that they are accurate, complete or up to date and Market Matters accepts no obligation to correct or update the information or opinions in the Reports. Market Matters may publish content sourced from external content providers.
If you rely on a Report, you do so at your own risk. Past performance is not an indication of future performance. Any projections are estimates only and may not be realised in the future. Except to the extent that liability under any law cannot be excluded, Market Matters disclaims liability for all loss or damage arising as a result of any opinion, advice, recommendation, representation or information expressly or impliedly published in or in relation to this report notwithstanding any error or omission including negligence.