Subscribers questions (BOQ, BHP, BBOZ, NWH, MSB, RDV, CPD, PYC, AMP, WHC, ANZ, SIQ, SFR, MIN, CNU, NCM)

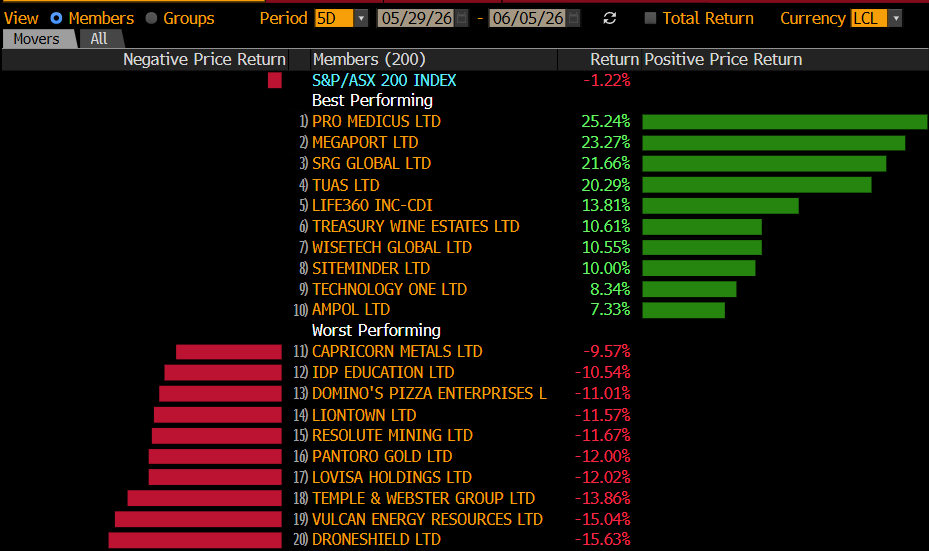
The ASX200 had a roller-coaster start to December basically dancing the “Trump Tweet” as fears of a global trade war intensified only to diminish just a few days later. US stocks actually managed to close the week in positive territory while the ASX200 finished down 138-points / 2%. The solid move from the likes of copper on Friday night might lead to some catch-up by the local bourse this week.
Fresh news was again relatively thin on the ground over the weekend as Christmas shopping might have been on the agenda for the masses:
1 – Property auction results remain strong with stock levels low and the opportunity to buy before Christmas fading fast.
2 – Hong Kong witnessed its largest ever protest for democracy illustrating the issue is far from resolved but its encouraging to see events unfold peacefully.
3 – On Friday night the US jobless rate fell back to its 50-year low as the labour market is showing no signs of the recession which many are forecasting.
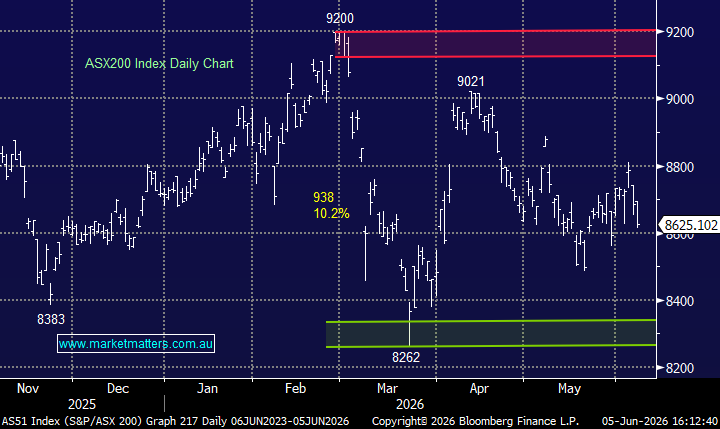
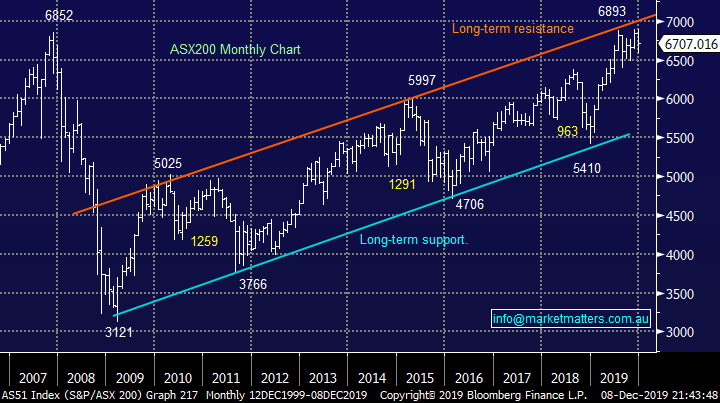
MM is bullish the ASX200 while it can hold above 6650.
On Saturday morning the SPI futures were pointing to a positive opening this morning, up over +0.5% helped by BHP which advanced 50c in the US.
Thanks again for the questions, yet another increase in volume, we really enjoy the engagement with our subscriber base, its one of MM primary goals moving forward – please excuse the brevity in our answers at times today due to the volume for a Monday morning.
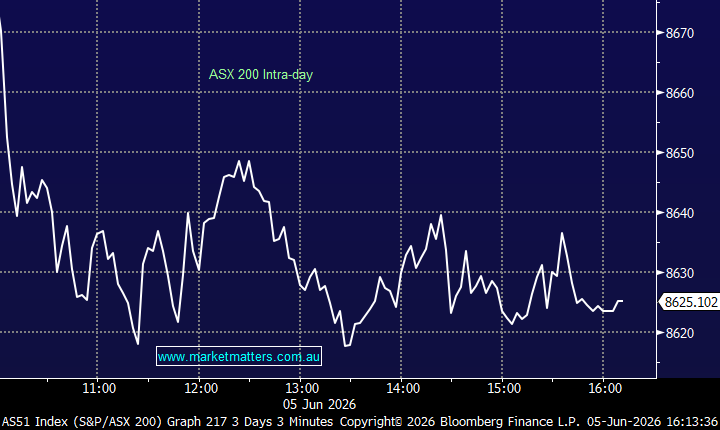
ASX200 Index Chart
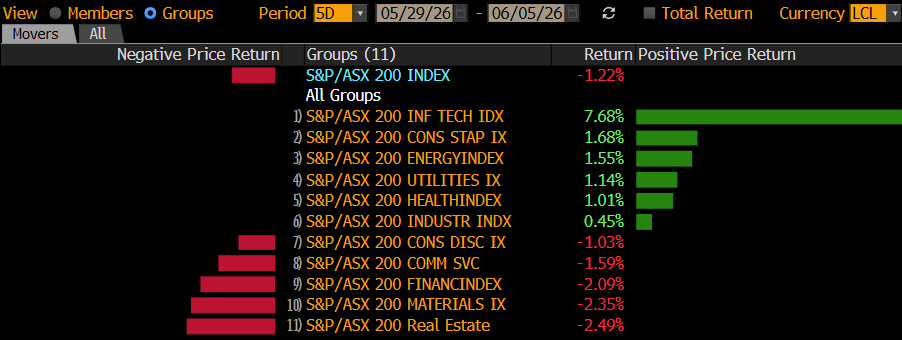
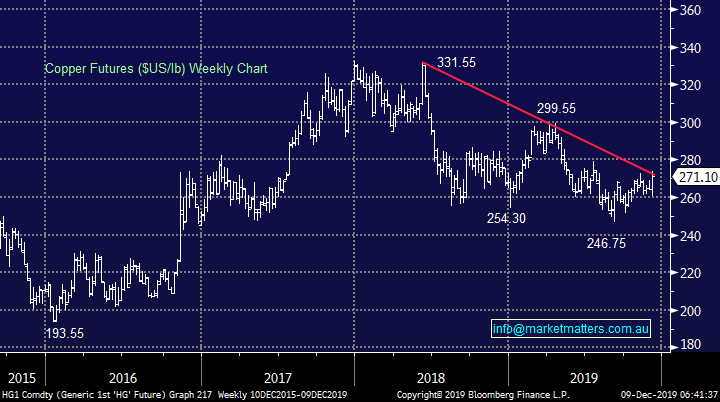
The extremely positive jobs report released in the US on Friday not only sent the Dow up over +300-points it helped copper again test its medium-term downtrend line – see below. At MM we believe it’s a case of “when not if” that copper pops higher with this week clearly now a contender for when – if this does occur bond yields will probably move higher in unison, which is likely to have a marked impact on the relative performance across different stocks / sectors e.g. on Friday night in the US the Financials and Resources both rallied well over +1% while the bond proxy Utilities fell -0.2%.
MM is bullish copper initially looking for 10% upside.
Copper ($US/lb) Chart
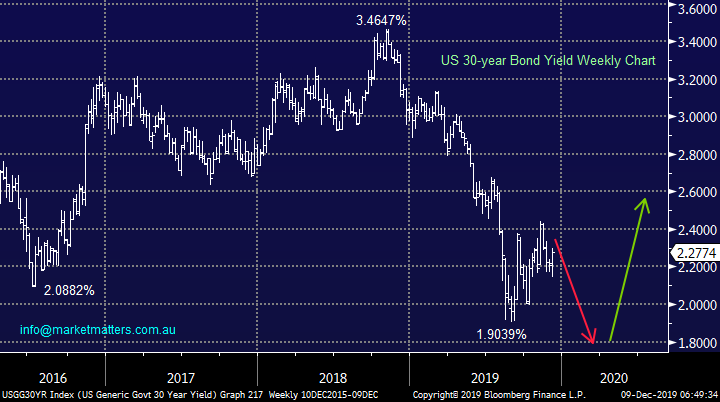
Our ideal scenario for bonds, of one more fresh low for yields, is at loggerheads with a copper breakout hence as we always say remain open-minded e.g. US 30-years to test ~1.8%.
The move below 2.2% triggered sell signals for MM targeting a test and probable break of 1.9% – MM will fade this move if it eventuates as we believe bond yields are “looking for a low”.
US 30-year Bond Yields Chart
Question 1
“G'day James and MM team, Just a quick one, what are your thoughts on buying Bank of Queensland for dividend yield at today's rate ($7.79) Also I'm up 8.5% on BHP at the moment do you feel there is much more upward movement on this one.”- Pete G.
Hi Pete
We’re still not keen on the Bank of Queensland (BOQ) as we continue to steer away from the regional banks. The stocks is already down 5% since we received your question although of course I can see the attraction of their anticipated yield – no guarantees here of course. This is an elastic band of pessimism that may well stretch too far presenting an opportunity but we feel patience is the better form of valour at this point in time.
The only real positive catalyst for BOQ on the horizon could be a tie up with another regional like Suncorp ‘s banking division (if it was spun out) – something that could improve their scale to better deal with a rising cost base.
MM is avoiding the regional banks at this point in time.
Bank of Queensland (BOQ) Chart

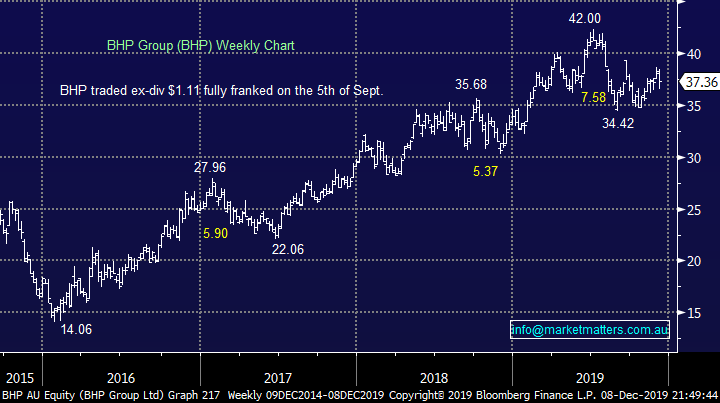
MM remains long and happy BHP Group (BHP) which should open ~$37.85 this morning. Our target is still over 10% higher – this coincides with our bullish outlook for resources into 2020.
MM remains long and bullish BHP.
BHP Group (BHP) Chart
Question 2
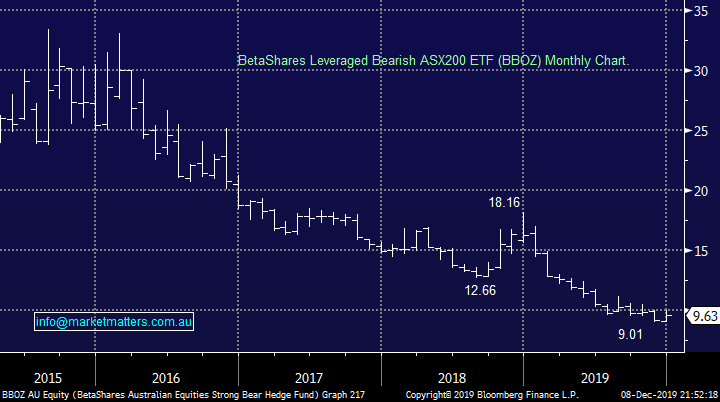
“Hi Guys, after reading your December analysis, just wondering what your plans are with the BBOZ position? My conclusion is to close out this position into any December weakness, and wondering if we are in the same boat.” - Cheers, Richard H.
Hi Richard,
You obviously read our mind as we did indeed close out our BBOZ position when the market plunged last Wednesday – you should have received the text / email alerts in a timely fashion.
MM will again consider the BBOZ if / when the ASX200 breaks above 6900.
BetaShares Leveraged Bearish ASX200 ETF (BBOZ) Chart
Question 3
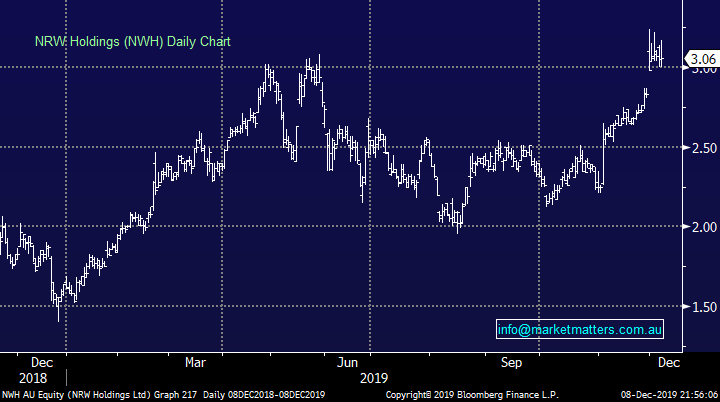
“I have a 30% profit on NWH & wondering if/what the MM price target is ? I’m inclined to sell.” – Brian C S.
Hi Brian,
NWH has certainly ran beautifully for MM but we still like both the fundamentals and technicals for the business – our target is above ~$3.30
MM remains bullish NWH.
NRW Holdings (NWH) Chart
Question 4
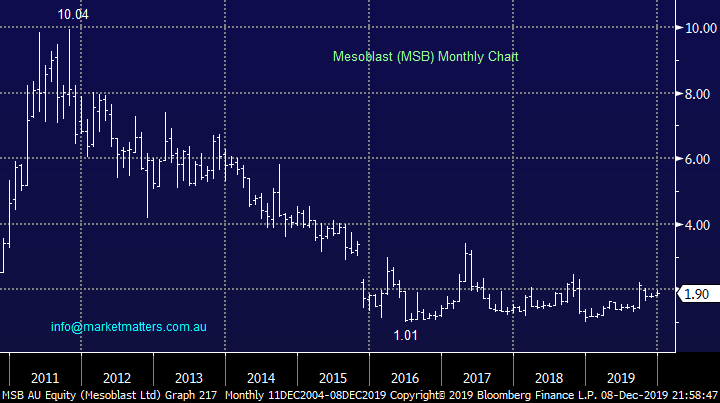
“Hi James, there is a crossing of 26M share of MSB today. Does that tell a story? I saw some interest shown by MM other day.” - Regards Sam S.
Hi Sam,
Big crossings are often the start of a move for a stock with the direction depending of course on whose left / joined the share register - replacing a old, jaded shareholder with a new positive one is often a good thing. Unfortunately this is a business that’s still burning cash which led to the capital raise in October at $2 which implies a wall of selling at higher levels.
The biotech does look interesting technically and we are watching carefully as the risk / reward looks ok plus the company is starting to enjoy some decent royalty revenue.
MSB looks good technically with stops below $1.75 i.e. 8% risk.
Mesoblasts Ltd (MSB) Chart
Question 5
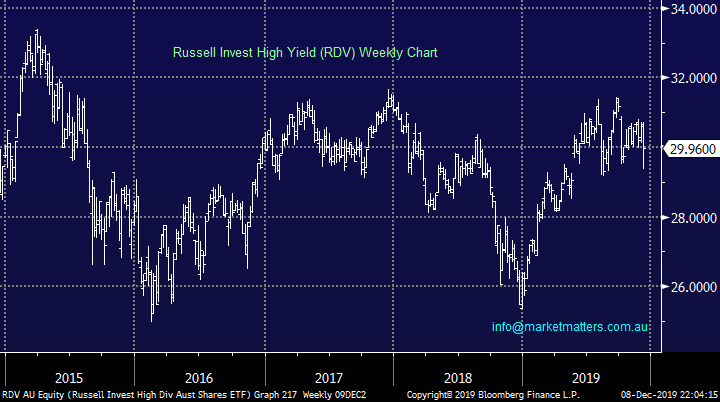
“MM is looking to INCREASE its market buying into the END OF NEXT WEEK”. Hhhmm, yep, makes sense. Be patient, listen to negativity being spread in media…..then act. I do like Russell Hi Yield index IF it drops to around $27.50 with 6.7% yield plus est 78% franking. An easy income source. Paid quarterly. 2020 will be all about INCOME IMO.” – David J.
Hi David,
Income will undoubtedly figure in next years investment landscape but as we saw on Friday night after a dominant few years we believe it won’t be all plain sailing for the yield sensitive space. However I actually feel any dip by the RDV below $29 is interesting, the $27.50 level feels a little too optimistic at this stage – as can be seen from the below link this is a pretty bank heavy ETF hence if you’re bearish the banks it’s probably not ideal.
More details on the ETF can be explored here : https://russellinvestments.com/au/solutions/exchange-traded-funds/funds/RASHDETF
MM likes the RDV below $29.
Russell Invest High Yield Aust Shares ETF (RDV) Chart
Question 6
“Hi Guys, Thank you for your ongoing informative insight at both a stock, index and macro level. Just a quick email to see if you have done any DD on the upcoming listing of the CVC Credit Partners Private Debt Income Fund (ASX: CPD)? If you have – it would be great to hear your thoughts.” - Kind Regards, David W.
Hi David,
Firstly thanks the appreciation, we love what we do at MM making positive feedback feel even better, 2020 is set to be a really exciting year for our Team and subscribers as our offering is set to step up another level.
In terms of CPD, we’ll cover in this weeks Income Note – we haven’t had a chance to review as yet. The income note is out around lunchtime each Wednesday.
Question 7
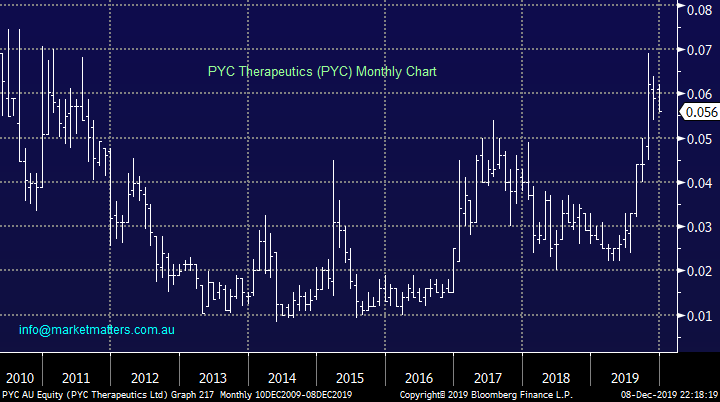
“Hi guys, learning heaps from your insights. What do think about PYC (PYC Therapeutics) or is too hard to analyse?” - Thanks, Kim B.
Morning Kim,
PYC is certainly tricky one that we would only look at from a technical perspective – the companies $164m market cap and low average daily turnover takes it off the investment radar for MM.
Technically PYC looks ok, albeit very volatile – it’s a hold with stops below 4.8c.
PYC Therapeutics (PYC) Chart
Question 8
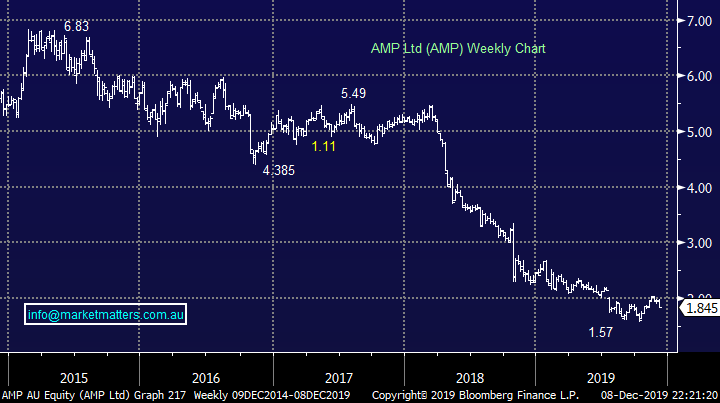
“Could you please send me the ASX code of AMP hybrid 2 when available?” – Mike C.
Hi Mike,
The ASX code will be AMPPB with the hybrid listing on the ASX on the 24th December.
AMP Ltd (AMP) Chart
Question 9
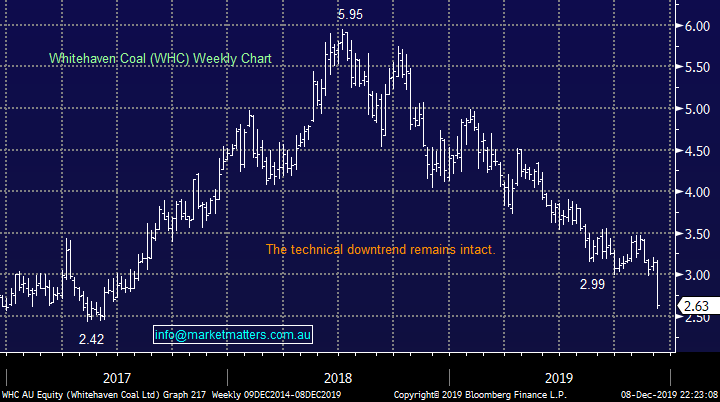
“Hi James, is Whitehaven a buy at these levels ($2.60)” - Cheers Tim N.
“Can I have your thoughts on Whitehaven Coal please following their recent announcement on cost increases. Am thinking the selloff has been overdone with most broker targets that I have seen up around $4.” - Thank you Ian C.
Morning Guys,
We have been watching Whitehaven (WHC) over recent weeks but it still “feels wrong” in terms of price action while their announcement last week was soft on a number of fronts, lower production, higher cost etc which led to a downgrade for its 2020 guidance.
Also worth remembering that UBS slotted investors with a large line of stock ($300m) from Farallon at $3.22 per share while Farallon still retain about 5% of WHC which was escrowed for 60 days from the 11th November sale, so in short, there are insto’s holding too much WHC at $3.22 plus another 5% of the company is still up for sale, and if I was having a guess, it will likely be sold at a steeper discount to market.
Its all too hard for WHC at the moment.
MM is still on the fence with WHC.
Whitehaven (WHC) Chart
Question 10
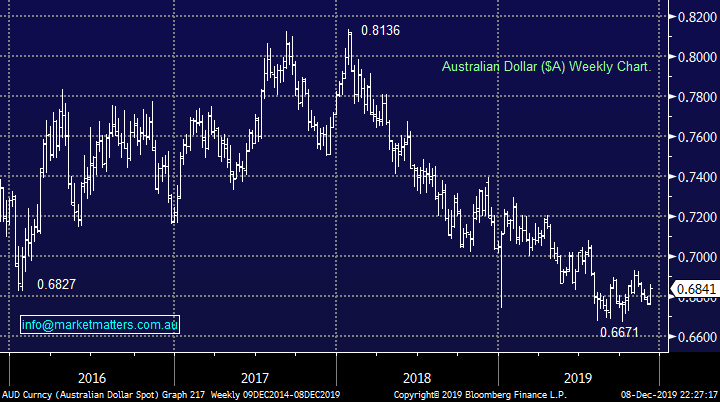
“Hi, could you give your thoughts on AUD, you were bullish not long ago, are you still bullish??? My feeling is that US won’t cut rates again but Australia will have 2 cuts to 0.25. I doubt we will go negative- it doesn’t work.” - Russell E.
Morning Russell,
I believe the market is already pricing in your very thoughts into todays $A price hence we feel any surprises moving forward are likely to be bullish for the $A plus don’t forget the market is very bearish & short the Little Aussie Battler ($A).
MM remains bullish the $A.
Australian Dollar ($A) Chart
Question 11
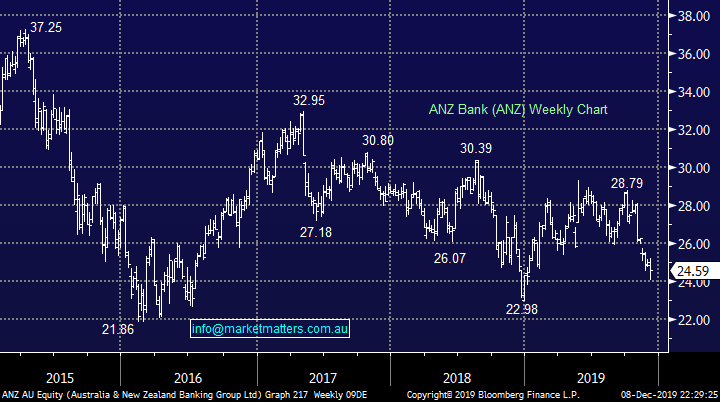
“Hi James and Team, for the bank shares, are they buy, hold or sell? In particular, ANZ.” – Theresa C.
Hi Theresa,
The banks looked great a couple of months ago and we still believe they will outperform in 2020 albeit from a lower base than we thought in October.
MM remains positive the banks but would only buy weakness, not strength, at this stage. ANZ is our least preferred
ANZ Bank (ANZ) Chart
Question 12
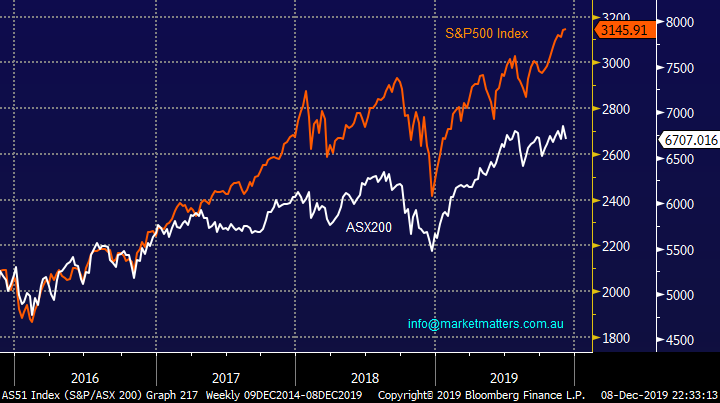
“Hi James, your report on Tuesday morning 3 December made an interesting comment about a good indicator for direction of overseas markets:
The main standout on a relatively quiet day was the aggressive selling MOC (market on close) where 10% of the days SPI futures volume was sold in the last 3-minutes of the day – perhaps somebody had a sniff of Trumps overnight intentions on trade? A trader that gets these notes from an investment bank once told me that the movement in the match in Australia relative to the close is a very good indicator of what to expect in international markets that night. i.e. if the market closes lower at 4.10 than it was at 4.00 it’s a negative sign and vice versa, yesterday -15pts was lost in the match – a good precursor to last night’s sell off.” Would it be possible to include this indicator in your evening reports as it would be helpful ahead of markets opening in the US in particular? Any further details to help understanding of the match movement would also be useful.”- Thanks Peter O.
Hi Peter,
Indeed I will try to whenever it catches my eye, although it is a very micro way to look at the market. There was an interesting article in Bloomberg today with regard to the match in the US, definitely worth a read for those that are interested in the mechanics of stock markets at the close of business:
ASX200 v US S&P500 Chart
Question 13
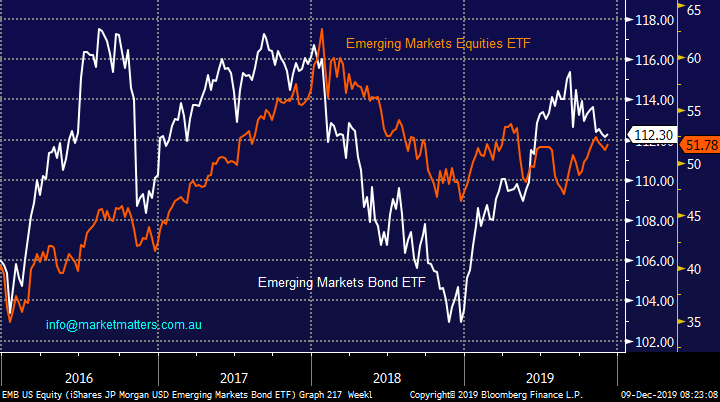
“I am a MM subscriber. I have a question for Monday. What are the differences in risk and return perspective between emerging market bond fund and emerging market ETF for a medium 3 to 5 year term.” - Jimmy K.
Morning Jimmy,
The below chart illustrates how the Emerging Markets (EM) ETF’s have performed over recent years, obviously no guarantees for the future. A couple of observations:
1 – They are clearly positively correlated i.e. a healthy bond market is good for stocks.
2 – The equities ETF has been significantly more volatile in both directions, pretty much as would be expected.
For the record MM is bullish both.
Emerging Markets Bond & Equities ETF Chart
Question 14
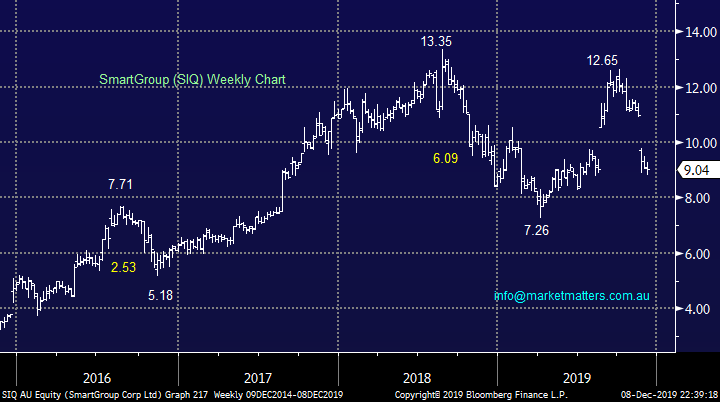
“Morning MM Interested on your thoughts on SIQ and SFR as both stocks have pulled back and have been on your radar. Also interested on your thoughts on MIN and CNU as I acquired these at lower levels and see these as long term plays.” - Cheers Nath.
Hi Nath,
I will have to be very brief with so many stocks:
1 – SmartGroup (SIQ) $9.04 – After its disappointing trading update and planned directors departure last month, we’re on hold here.
2 – Sandfire Resources (SFR) $5.46 – Higher leveraged copper play and will bounce with the copper price but overall we do prefer the quality end of town i.e. OZ Minerals (OZL).
3 – Mineral Resources (MIN) $15.48 – we are net bullish but would run stops below $14.60.
4 – Chorus (CNU) $5.76- after its strong 3-weeks we are still bullish but with stops under $5, not particularly attractive from a risk / reward perspective.
SmartGroup Corp Ltd (SIQ) Chart
Question 15
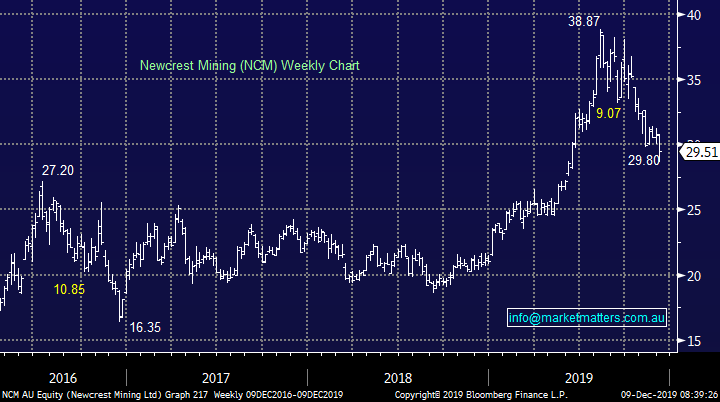
“Pls check geography. Newcrest nowhere near Hunter Valley. “ - Regards Milto. / referring to our onerous mention of NCM cadia mine being in the Hunter Valley.
Hi Milton,
You are absolutely correct - Cadia mine is near Orange. The error was made in an afternoon report earlier in the week and copied through to the weekend note. They are experiencing the same water issues in Orange as a number of the Hunter Valley guys are (WHC for example) which is where the error stemmed from. We should have known better - 2 great destinations for Australian wine!
Newcrest Mining (NCM) Chart
Overnight Market Matters Wrap
- US equities gained last Friday, with the Dow erasing most of its losses for the week, while the broader S&P 500 close in positive territory at the same duration.
- Strong job reports in the US helped bring the positive sentiment back to investors eyes, taking risk back on, while gold spot lost as bets for a rate cut in the near term disapates.
- Crude oil gained further as OPEC and its constituents agreed to cut its output further by 500,000 bbl. a day in early 2020.
- BHP is expected to outperform the broader market after ending its US session up an equivalent of 1.28% from Australia’s previous close.
- The December SPI Futures is indicating the ASX 200 to open 29 points higher this morning, testing the 6740 level.
Have a great day!
James & the Market Matters Team
Disclosure
Market Matters may hold stocks mentioned in this report. Subscribers can view a full list of holdings on the website by clicking here. Positions are updated each Friday, or after the session when positions are traded.
Disclaimer
All figures contained from sources believed to be accurate. All prices stated are based on the last close price at the time of writing unless otherwise noted. Market Matters does not make any representation of warranty as to the accuracy of the figures or prices and disclaims any liability resulting from any inaccuracy.
Reports and other documents published on this website and email (‘Reports’) are authored by Market Matters and the reports represent the views of Market Matters. The Market Matters Report is based on technical analysis of companies, commodities and the market in general. Technical analysis focuses on interpreting charts and other data to determine what the market sentiment about a particular financial product is, or will be. Unlike fundamental analysis, it does not involve a detailed review of the company’s financial position.
The Reports contain general, as opposed to personal, advice. That means they are prepared for multiple distributions without consideration of your investment objectives, financial situation and needs (‘Personal Circumstances’). Accordingly, any advice given is not a recommendation that a particular course of action is suitable for you and the advice is therefore not to be acted on as investment advice. You must assess whether or not any advice is appropriate for your Personal Circumstances before making any investment decisions. You can either make this assessment yourself, or if you require a personal recommendation, you can seek the assistance of a financial advisor. Market Matters or its author(s) accepts no responsibility for any losses or damages resulting from decisions made from or because of information within this publication. Investing and trading in financial products are always risky, so you should do your own research before buying or selling a financial product.
The Reports are published by Market Matters in good faith based on the facts known to it at the time of their preparation and do not purport to contain all relevant information with respect to the financial products to which they relate. Although the Reports are based on information obtained from sources believed to be reliable, Market Matters does not make any representation or warranty that they are accurate, complete or up to date and Market Matters accepts no obligation to correct or update the information or opinions in the Reports. Market Matters may publish content sourced from external content providers.
If you rely on a Report, you do so at your own risk. Past performance is not an indication of future performance. Any projections are estimates only and may not be realised in the future. Except to the extent that liability under any law cannot be excluded, Market Matters disclaims liability for all loss or damage arising as a result of any opinion, advice, recommendation, representation or information expressly or impliedly published in or in relation to this report notwithstanding any error or omission including negligence.