Overseas Wednesday – International Equities & Global Macro ETF Portfolios (ORE, TSLA US, JPM US, WFC US, GS US, AAPL US, JHG US, IEM US, 700 HK, SH US)
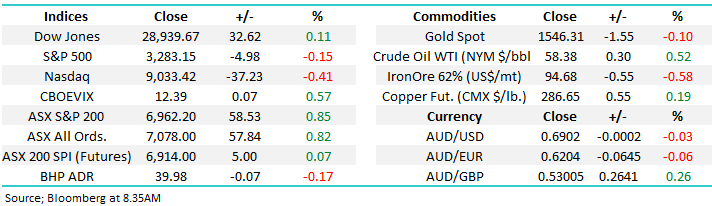
The ASX200 continues to rally with unchecked enthusiasm, we are only 2-weeks into 2020 and the markets already surged 278-points / 4.2%. Through 2019 MM trumpeted on a number of occasions that we felt investors were caught underweight equities, the continual advance by stocks is making this view feel well and truly on the money. This time last year the local index was threatening to breakdown towards 5000 whereas today we sit at all-time highs, less than 1% below the psychological 7000 area.
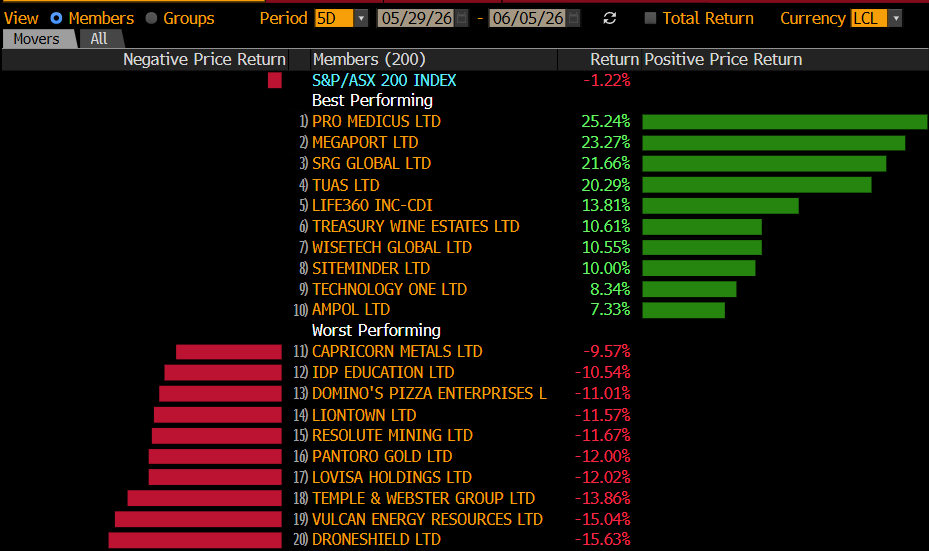
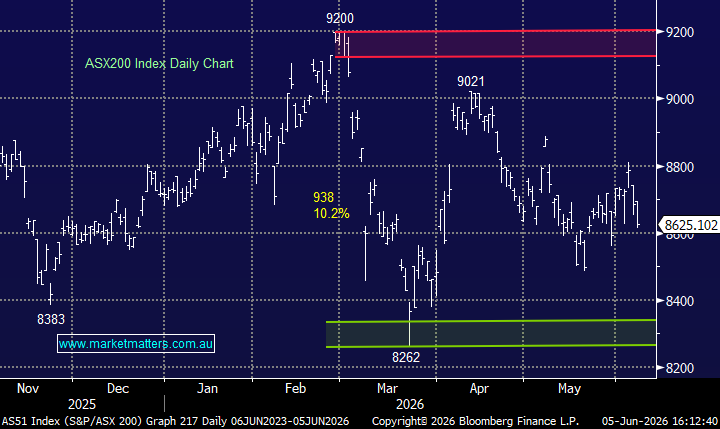
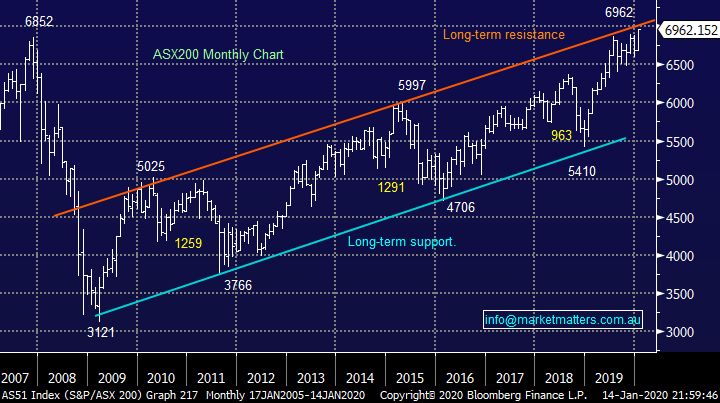
Although volumes were not huge yesterday the lack of selling persists as winners smacked losers by almost 4:1. On days when Australia’s 3 largest stocks BHP, CSL and BHP, who we covered in yesterday’s report, all make solid gains the bulls can expect a pleasing outcome. For the chartists out there take a quick glance at the monthly picture of the ASX200 below, things look very similar to late 2009 / early 2010, if we continue to follow that path investors should anticipate a choppy advance through to April before a decent correction.
After such an impressive start to the year I felt this was an ideal time to look back at the characteristics of the local market post the GFC, a few things caught our eye:
1 – April / May period dominates historically as the seasonal period to be cautious stocks, followed distantly by August – remember our comment above about this year looking like 2010.
2 – The average return in Q1 over the last decade by the local market is +3.6%, a solid return until we consider that we’ve already eclipsed that average this year by +0.6%.
MM remains bullish stocks into early 2020 but we anticipate a far choppier year than 2019.
Overnight US stocks closed basically unchanged as reporting season kicks into gear, the SPI futures are calling the ASX200 top open up marginally.
Today as 2020 kicks into gear we’ve focused on the MM holdings in our International and Global Macro ETF Portfolio’s.
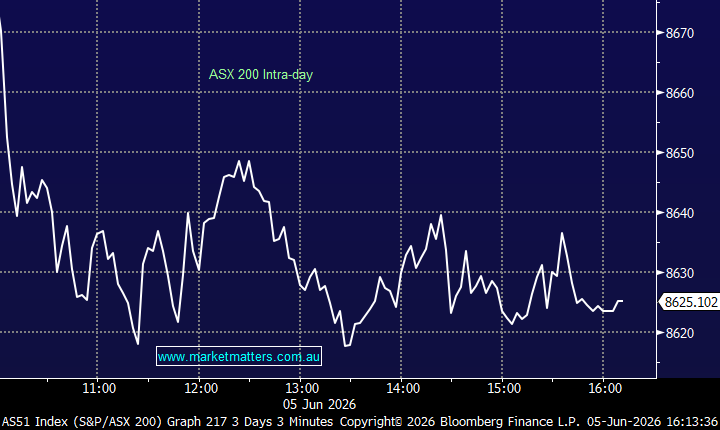
ASX200 Chart
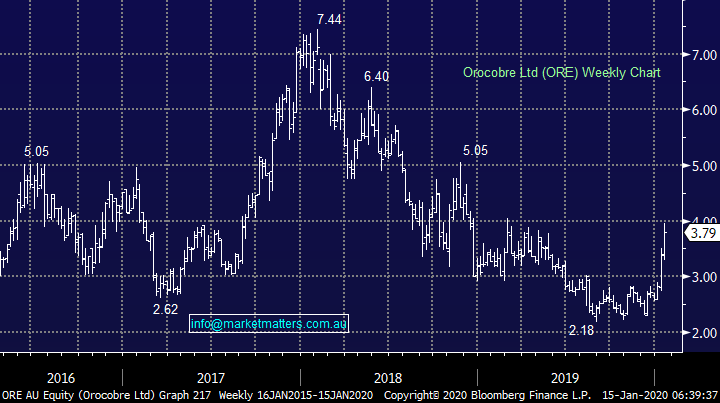
Yesterday two of the best performing stocks on the local bourse were lithium producers Pilbara Minerals (PLS) and Orocobre (ORE) which surged over 11% and 7% respectively. There are a couple of likely contributing factors to the bounce in these 2 major market underperformers.
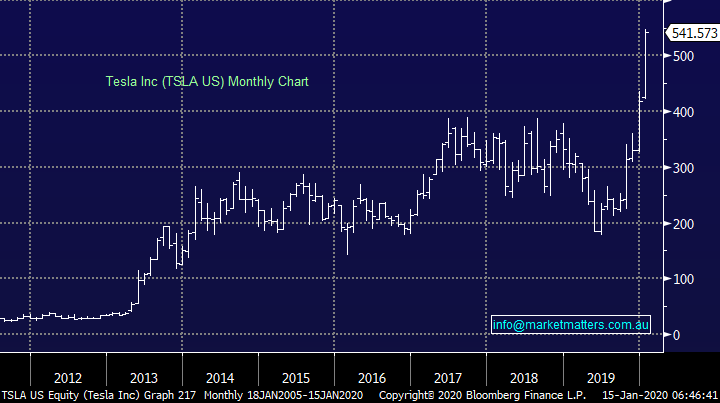
1 – Leading electric vehicle maker Tesla (TSLA US) has surged over 65% from its December lows as the demand side for the company improves aided by EV incentives in countries like the US and the Netherlands – some massive short covering has probably accelerated the advance.
2 – ORE for example has seen its short position decline from above 16% to 13% and is now the 4th most shorted stock on the ASX. Clearly some traders have decided to take some $$ from the table after the stock’s significant correction.
However, MM remains wary of chasing strength in the lithium producers as China who consume over 50% of the worlds annual usage of the commodity are taking up EV’s at a lower rate than anticipated / hoped due to their generally unhealthy automotive market. Importantly the significant raw material oversupply remains après the price rocketed in 2016-2018. If we were looking to play the EV story it would still be via the likes of TSLA as opposed to the local miners.
However, for the shorter-term traders I’m sure 2020 will provide some solid risk / reward trading opportunities in the likes of PLS and ORE but it’s tricky here following their recent pop higher.
Orocobre (ORE) Chart
Tesla Inc (TSLA US) Chart
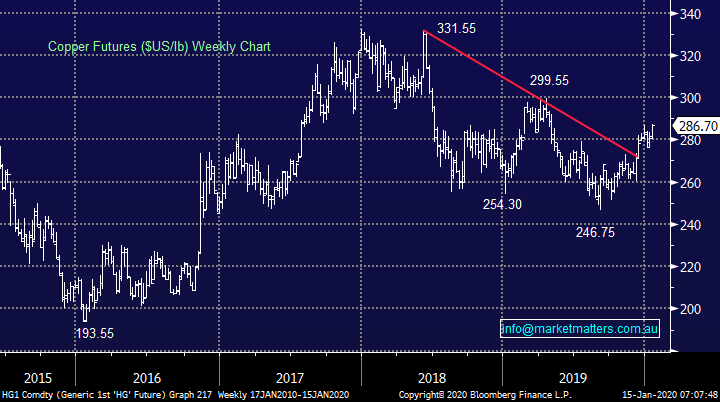
The ongoing rally in copper suggests inflation is indeed looming in 2020 / 2021 but until investors become concerned that it’s going to have an impact on interest rates the current liquidity driven stock market rally remains on track i.e. copious amounts of cash sitting in the hands of investors looking for a home is pushing up stock prices / valuations faster than profits are growing. Yesterday (at Shaw) we did a ~$30m placement in peer to peer lending business Wisr (WZR) that was around 10x oversubscribed, provides some insight into the cash levels out there for the right deals.
We’ve have been calling copper to break to the upside for months and since December the move has unfolded with a bang as the industrial metal rallied almost 10%, over half of our initial targeted move. Assuming we are correct with this ongoing bullish copper view the reflation argument is likely to be alive and well.
MM remains bullish both copper and reflation.
Copper Futures ($US/lb) Chart
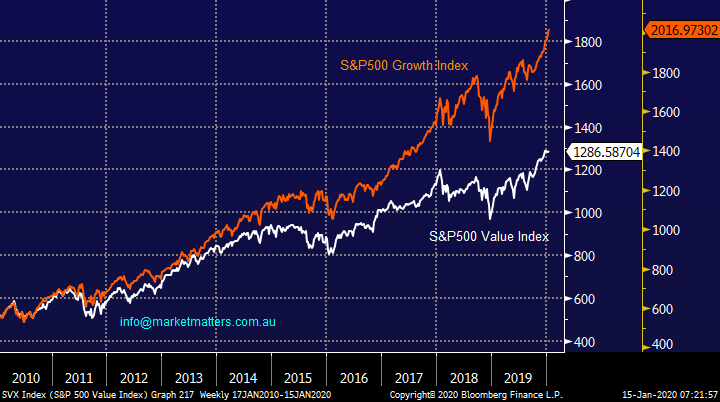
MM continues to prefer Value overgrowth into 2020 although there’s been no major differential in their respective performance over recent times. The differential between developing markets and the US remains close to a 16-year low as fund managers enjoy the longest bull market in history in a very one-dimensional manner. The earnings expansion being enjoyed by the expensive growth companies cannot continue indefinitely while the neglected value names become cheaper by the month on a relative basis.
When we look at the Value and Growth Indices in the US both remain strong, especially after the Value gauge recently broke out to fresh all-time highs. If MM is correct and bond yields are close to an inflection point then the huge outperformance from the growth end of town is likely to be over i.e. the white and orange lines on the chart below should start to converge NB Value stocks include Banks & Resources while Growth includes things like IT & Healthcare stocks.
MM prefers Value overgrowth into 2020 / 21.
US Value & Growth Indices Chart
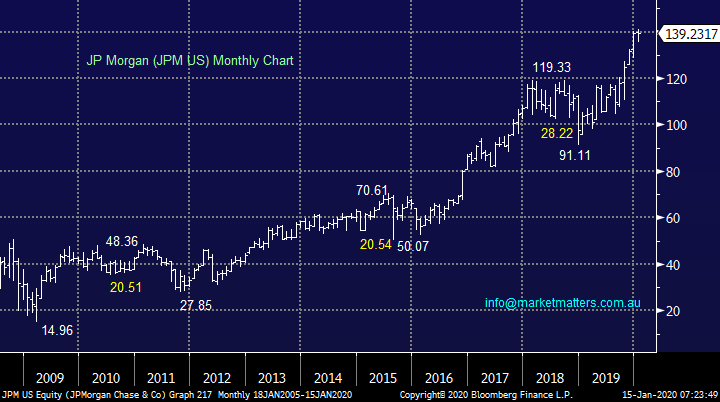
Overnight JP Morgan reported, and the market overall liked what it heard sending the stock up around +1.5% on a quiet night. Both profit and revenue exceeded analysts’ expectations with bond trading revenue surging 86% to $US3.4bn helping 4th quarter profits to rise 21% to $US8.52bn. However, it wasn’t all good news as margins were compressed in the retail and commercial banking businesses as interest rates fell – not a great read through for our banks who will breathe a collective sigh of relief when interest rates eventually turn higher.
MM remains bullish US banks which ties in with our “value overgrowth” view although the sector as a whole might need a rest after recent strong gains.
NB MM holds JPM in our International Portfolio.
JP Morgan (JPM US) Chart
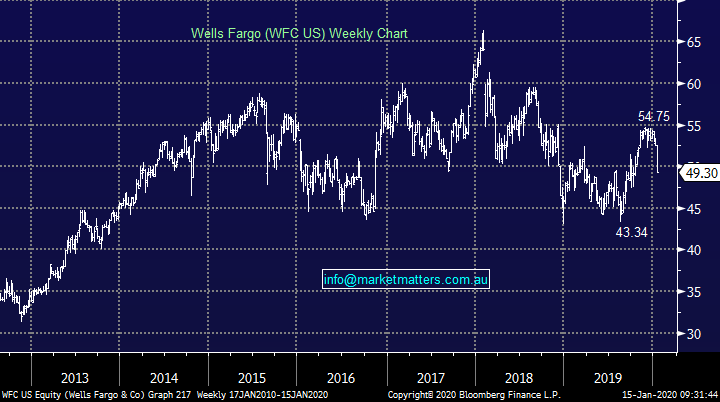
Wells Fargo also reported 4Q19 earnings however they missed the mark, the stock ending more than 5% lower. The most obvious takeaway being weaker than expected interest income blamed on lower interest rates. WFC is a bank in a turnaround phase however this could take time.
NB MM holds WFC in our International Portfolio and the position is now in review.
Wells Fargo (WFC) Chart
MM International Equites Portfolio
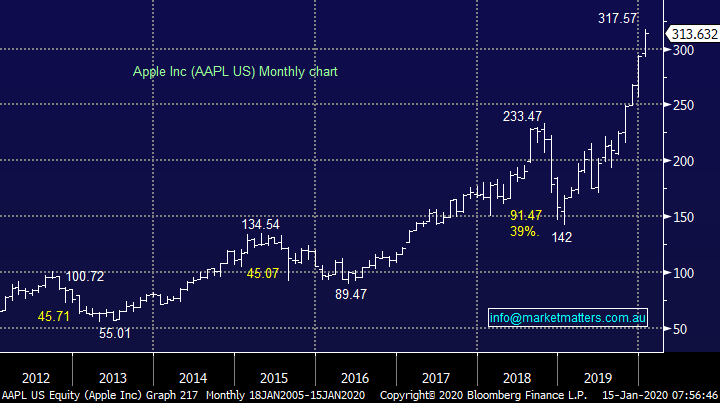
Our international portfolio remains 53% invested however at the stock level there have been some stellar performances in the last 6 months (since the portfolio begun). Apple (AAPL) the standout now trading at US$312.68 after we bought below $US200.
There were no changes to the portfolio last week with our cash position remaining at 37% plus we have 8% exposure to a negative facing ETF. : https://www.marketmatters.com.au/new-international-portfolio/
Overall, positions within the portfolio are tracking along nicely with only Wells Fargo (WFC US) and our ProShares short S&P500 ETF in the red, 10 out of 12 feels good.
US facing holdings:
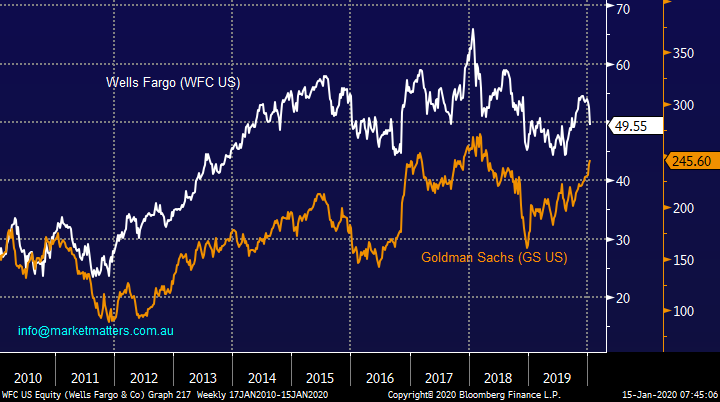
Wells Fargo (WFC) is the main position MM is not particularly comfortable with and we are considering switching after their quarterly overnight to the more trading focused Goldman Sachs (GS US) following the breakdown of JPM’s quarterly report.
Wells Fargo (WFC) v Goldman Sachs (GS US) Chart
Fortunately, at this stage we remain bullish JP Morgan (JPM US), Bank of America (BAC US), United Health (UNH US) and high-flying Apple Inc (AAPL US).
Also, we remain comfortable with Barrick Gold (GOLD US) which has noticeably outperformed its Australian peers.
Apple Inc (AAPL US) Chart
European facing:
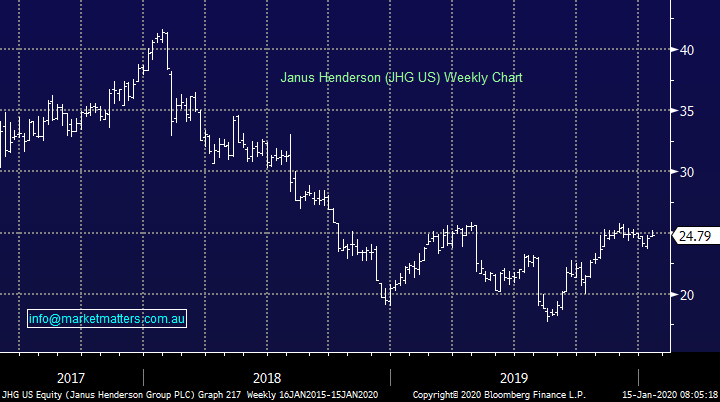
MM only has Janus Henderson (JHG US) residing here and we remain bullish targeting a push above 2019 highs, but we will be monitoring the position if / when this move unfolds.
Janus Henderson (JHG US) Chart
Emerging Markets facing:
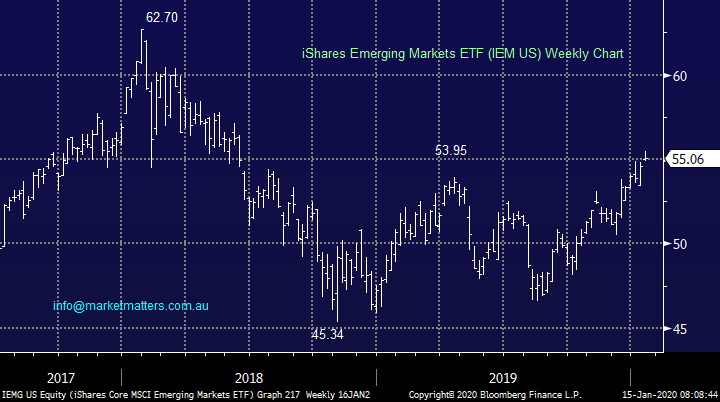
No Change, MM continues to like the Emerging Markets moving into 2020, a view strongly supported by our bearish $US view but one that previously came under some pressure in 2019 due to ongoing trade war concerns and social unrest in Hong Kong. Hence any buying this month is likely to be focused in this region.
Our preferred method to implement this view are adding to our Samsung (005930 KS) and Ping An (2318 HK) positions plus internet and e-commerce goliath Tencent (700 HK).
NB We can include BHP (BHP LN) here due to its large correlation with EM, MM remains bullish BHP targeting a break of 2019 highs.
Emerging Markets ETF (IEM US) Chart
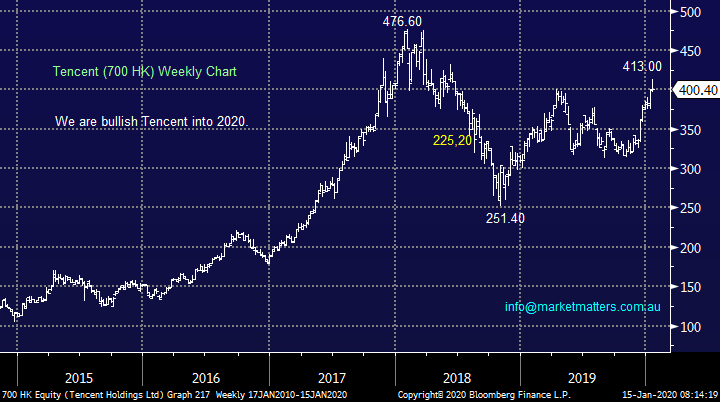
On-line goliath Tencent struggled in 2018 and the majority of 2019 before rallying in December in-line with global markets, after spending the previous 6-months basically trading sideways a significant move higher now feels underway, at MM we can see fresh all-time highs in 2020.
MM is bullish Tencent (700 HK).
*Watch for alerts
Tencent (700 HK) Chart
Conclusion (s)
MM likes the Value Sector and Emerging Markets into 2020, we plan to continue skewing our portfolio in this direction along with increasing our footprint to the EM region.
Watch the pm reports for alerts.
The MM Global Macro ETF Portfolio
This portfolio is designed to showcase our key macro calls. Subscribers can utilise the portfolio in one of two ways, either by replicating it or using it as a snapshot outlining our macro views and importantly the conviction behind those views.
The MM Global Macro Portfolio remains 51.5% in cash as we continue to watch bond yields closely. : https://www.marketmatters.com.au/new-global-portfolio/
At this stage we are happy with are position mix but anticipate some restructuring in Q1 of this year:
1 – Our precious metals exposure via both gold and silver ETF’s remains ok, especially considering the strength being displayed by equities. Ideally, we will consider taking some $$ into a break of 2019 highs.
2 – No surprise after early commentary that we remain happy with our long copper COPX US ETF position.
3 – We remain comfortable with our core bullish $A view hence the AUDS ETF which continues to tread water not a concern to us.
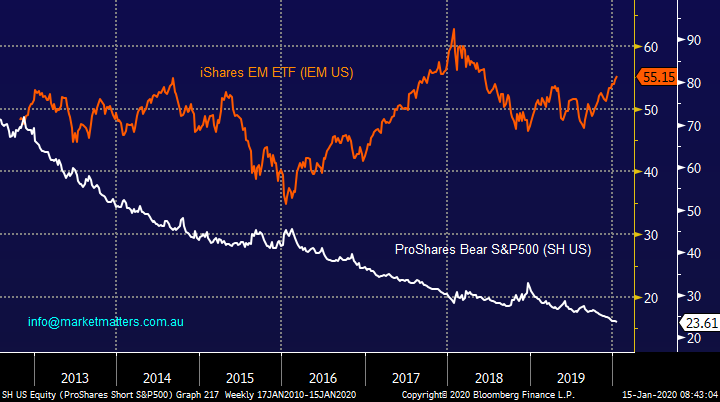
4 – Lastly the long EM v short S&P500 position which is not currently balanced in size. MM believes that EM will outperform the US in 2020/21 hence we are looking to take both positions up to 10% however we might try and add some alpha here and “leg on” the respective increases.
iShares EM ETF (IEM US) v ProShares Bear S&P500 (SH US) Chart
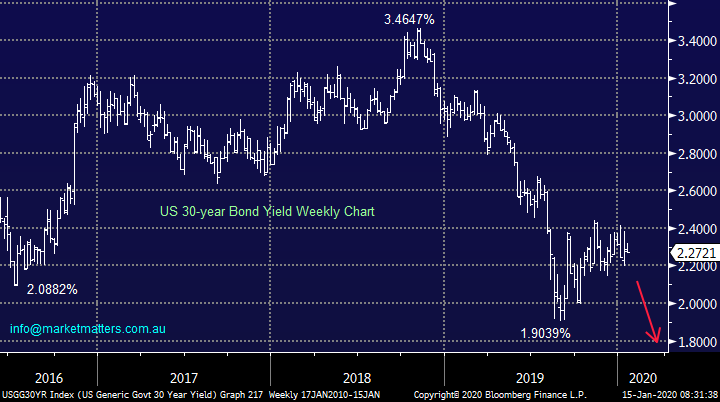
Moving forward bond yields feel 50-50 as to whether they will follow our ideal path down to fresh lows and we must remain open-minded that they have already bottomed. The logical 2 purchases for this Macro ETF Portfolio remain add to the IEM ETF and buy the IWM ETF.
US 30-year Bond Yield Chart
Conclusion (s)
We are unlikely to implement these 2 ideas / plans in the coming week, but January / February is a strong possibility.
Overnight Market Matters Wrap
- The US equity markets closed mixed overnight, with the Dow outperforming its peers as investors take a step back and digest its round of quarterly earnings.
- Overnight, better than expected results were seen by Citigroup and JP Morgan – we expect our Aussie, Macquarie Group (MQG) to follow suit and outperform the broader market today.
- On the commodities front, crude oil tapered its 5-day slide, while Iron Ore gained ahead of a quiet period once the Lunar New Year festivities begin towards the end of this month.
- BHP is expected to trade with little change, testing the $40.00 level, while on the M&A front, talks of a divestment of some of Cimic’s (CIM) subsidiaries to lure investors to acquire at least some of its assets is being considered.
- The March SPI Futures is indicating the ASX 200 to maintain its route to hit another fresh all-time high towards the 6980 level this morning.
Have a great day!
James & the Market Matters Team
Disclosure
Market Matters may hold stocks mentioned in this report. Subscribers can view a full list of holdings on the website by clicking here. Positions are updated each Friday, or after the session when positions are traded.
Disclaimer
All figures contained from sources believed to be accurate. All prices stated are based on the last close price at the time of writing unless otherwise noted. Market Matters does not make any representation of warranty as to the accuracy of the figures or prices and disclaims any liability resulting from any inaccuracy.
Reports and other documents published on this website and email (‘Reports’) are authored by Market Matters and the reports represent the views of Market Matters. The Market Matters Report is based on technical analysis of companies, commodities and the market in general. Technical analysis focuses on interpreting charts and other data to determine what the market sentiment about a particular financial product is, or will be. Unlike fundamental analysis, it does not involve a detailed review of the company’s financial position.
The Reports contain general, as opposed to personal, advice. That means they are prepared for multiple distributions without consideration of your investment objectives, financial situation and needs (‘Personal Circumstances’). Accordingly, any advice given is not a recommendation that a particular course of action is suitable for you and the advice is therefore not to be acted on as investment advice. You must assess whether or not any advice is appropriate for your Personal Circumstances before making any investment decisions. You can either make this assessment yourself, or if you require a personal recommendation, you can seek the assistance of a financial advisor. Market Matters or its author(s) accepts no responsibility for any losses or damages resulting from decisions made from or because of information within this publication. Investing and trading in financial products are always risky, so you should do your own research before buying or selling a financial product.
The Reports are published by Market Matters in good faith based on the facts known to it at the time of their preparation and do not purport to contain all relevant information with respect to the financial products to which they relate. Although the Reports are based on information obtained from sources believed to be reliable, Market Matters does not make any representation or warranty that they are accurate, complete or up to date and Market Matters accepts no obligation to correct or update the information or opinions in the Reports. Market Matters may publish content sourced from external content providers.
If you rely on a Report, you do so at your own risk. Past performance is not an indication of future performance. Any projections are estimates only and may not be realised in the future. Except to the extent that liability under any law cannot be excluded, Market Matters disclaims liability for all loss or damage arising as a result of any opinion, advice, recommendation, representation or information expressly or impliedly published in or in relation to this report notwithstanding any error or omission including negligence.