Should we be backing the “BOJO” horse? (WOW, RMD, A2M, IRE, VUK, JHG, PDL, BVS)
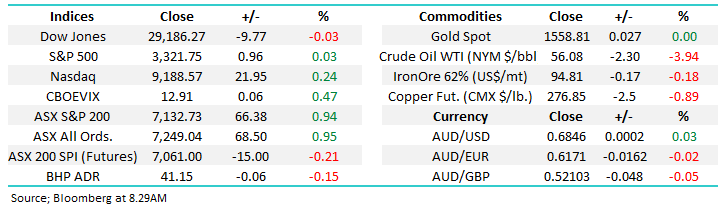
The ASX200 surprised many, including ourselves, by its strength yesterday soaring +0.94% to yet another all-time high – making it an astonishing 448-point / 6.7% advance in the first 3-weeks of January. The markets revelling in the almost perfect environment for stocks, yesterday’s consumer sentiment numbers showed enough weakness to maintain optimism that the RBA will cut rates in February but they weren’t bad enough to ignite fears of a looming recession. However the most important fact to acknowledge is the path of least resistance for stocks remains up implying this liquidity led rally still has $$ on the sidelines.
Local stocks have shrugged off the concerns around the China originated Coronavirus even though the death toll has now increased to 17 and hundreds of people are known to be infected, China has taken the drastic step to quarantine Wuhan as things start to play out like a movie. Personally I believe it’s dangerous to discount this threat to the global economy but as always time will tell. Equities are undoubtedly in a classic accelerating phase where picking a top is a dangerous almost foolish game, our guess of a 7000-7100 trading range for a few weeks is already wrong! If I were a trader I would be taking $$ but as an investor there’s not many alternatives hence the market probably has further to run even if some consolidation is overdue.
The market breath in stocks remains extremely bullish, Wednesday lived up to its name as “drive day” with winners trumping losers 4:1, importantly while we will eventually see a period of consolidation MM sees no short-term reason not to buy such a pullback – at this stage for the very active subscriber we now envisage a 2020 to unfold in a similar manner to that outlined by Martin Crabb in yesterday’s video i.e. we see strength into February, a pullback followed by a rally toward the risky May / June period where we do plan to take some $$ from the table.
Investors should never lose sight of risk and as the ASX200 marches through 7100 the risk / reward is obviously diminishing rapidly – stocks are now very expensive generally on traditional metrics as risks slowly increase on the economic front, overall a perfect backdrop for the “Active Investor “as volatility often increases as interest rates fall – we believe there will be a typical 8-10% pullback at some stage this year, we look forward to steering investors through this current fascinating investment landscape and attempting to identify the turn (s) when they do arrive.
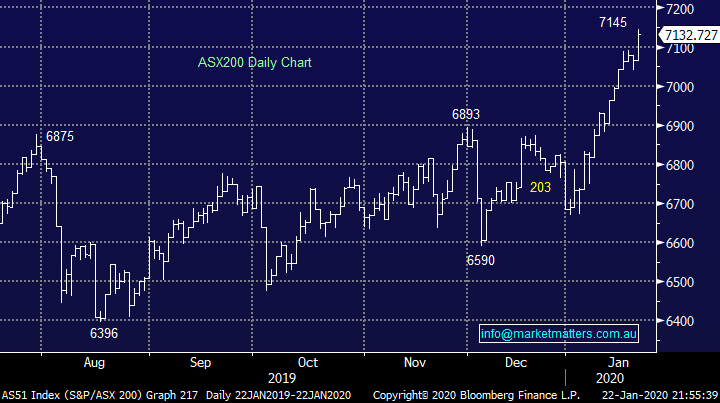
MM remains bullish the ASX200 while it holds above 6930.
Overnight US stocks were better earlier on before sellers emerged later in the session, the S&P500 closed flat on the day, SPI futures are calling our market to open down ~15pts this morning.
Today we’ve looked at the Australian UK facing stocks following comments by Martin Crabb yesterday that the UK is one of his favourite investment geographies. Overnight, the Brexit deal cleared its final hurdle in parliament after almost 4 years of back and forth.
ASX200 Chart
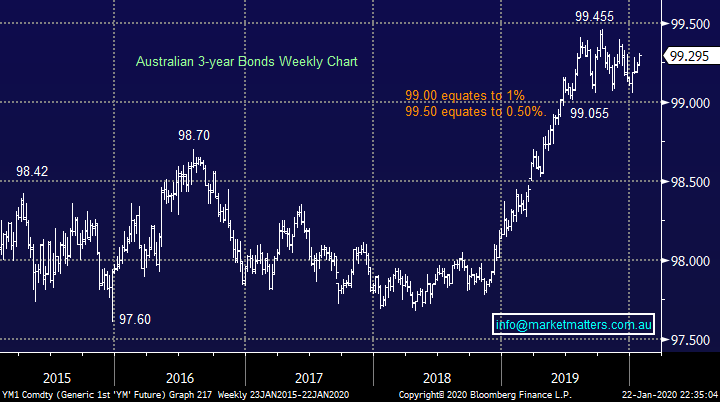
The reaction to yesterday’s consumer sentiment data maintained the dominant tailwind which equities have enjoyed since the start of 2019 – the chart below shows clearly how the Australian 3-year bonds took off at the start of last year and they haven’t taken a meaningful backward step since – remember as bond prices rally yields fall. We are bullish Australian 3-year bonds targeting fresh all-time highs probably taking their yield under 0.5%, we feel this move may easily create a “pop” in the yield play stocks which we will be looking to fade i.e. sell into strength.
MM remains bullish Australian 3’s i.e. bond yields lower in the short term.
Australian 3-years Bonds Chart
The market received an additional piece of positive news (when it rains it pours) yesterday when German supermarket giant Kaufland surprised everyone as it announced the withdrawal from Australia saying its decision was to allow the company to focus on its European operations although rumours are citing the tough drought and bushfires as being the catalyst in their decision.
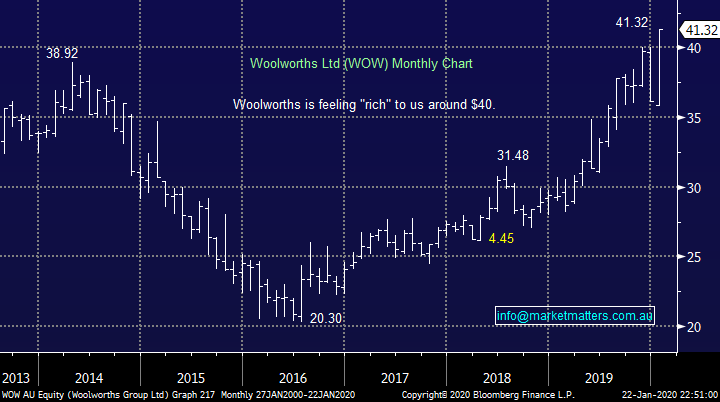
The follow through optimism for existing supermarket margins saw Coles (COL) and Woollies (WOW) both rally over 3% but with a P/E for 2020 of 28.4x we see little logical upside from current levels.
MM is neutral / bearish WOW & COL at current levels.
Woolworths (WOW) Chart
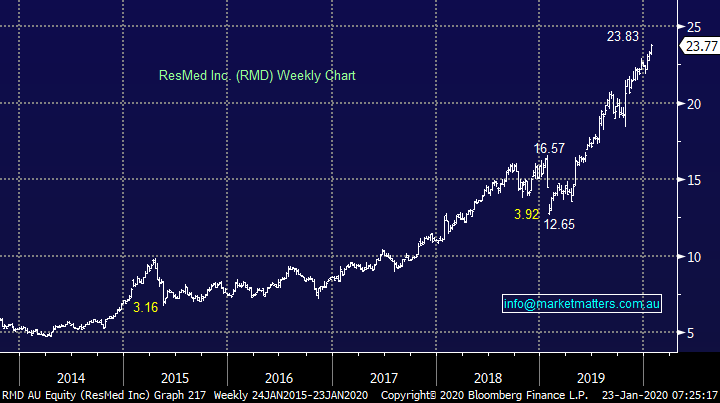
Overnight sleep disorder business ResMed (RMD) disappointed the market with its sales numbers leading to a fall of ~6% by the stock, we’ve previously successfully bought RMD on a spike lower after an earnings update but currently we want a pullback nearer to 15% before raising our buyers hand.
MM is neutral RMD at current levels.
ResMed (RMD) Chart
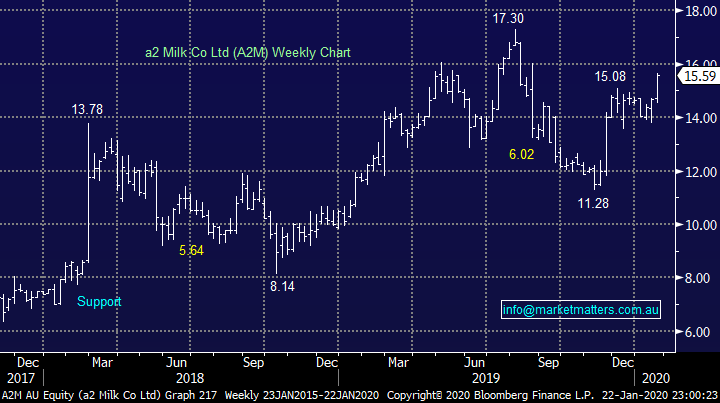
In the Weekend Report we named a2 Milk (A2M) as a stock we like and yesterday it frustratingly took off over 5%, we remain bullish with technical stops below $15 (4%) but we feel it is vulnerable to increased concerns around the Coronavirus hence at this stage any buying we consider is likely to be in a couple of tranches leaving room to buy weakness as opposed to getting scarred out at lower levels.
A2 Milk (A2M) Chart
How to “play” BREXIT & BOJO
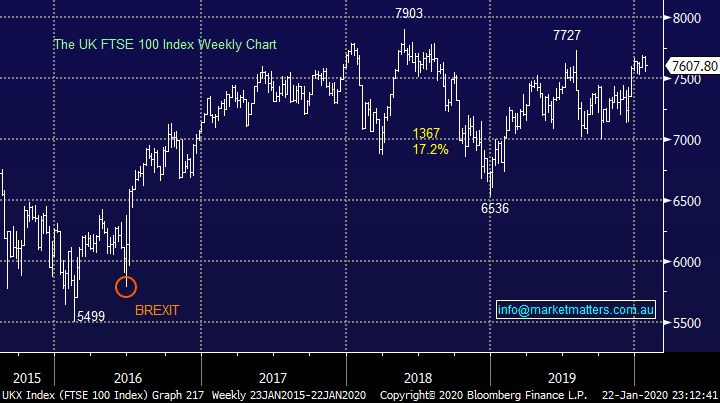
The UK now has what appears to be a robust government in place led by the charismatic Boris Johnson (BOJO) which in our opinion is an exciting platform for growth in the UK in the years ahead i.e. the combination of a govt. who looks set to spend money combined with a central bank (BOE) which is likely to cut rates = great for the UK economy & therefore stocks after a long period of underperformance.
The upside is magnified by the fact that UK equities are arguably trading on a 30% discount to global peers which is at a 30-year low, that’s an awful lot of bad news built into the UK and its stocks because of Brexit – importantly as within all markets not all stocks / sectors are “cheap” compared to their international peers.
UK FTSE Index Chart
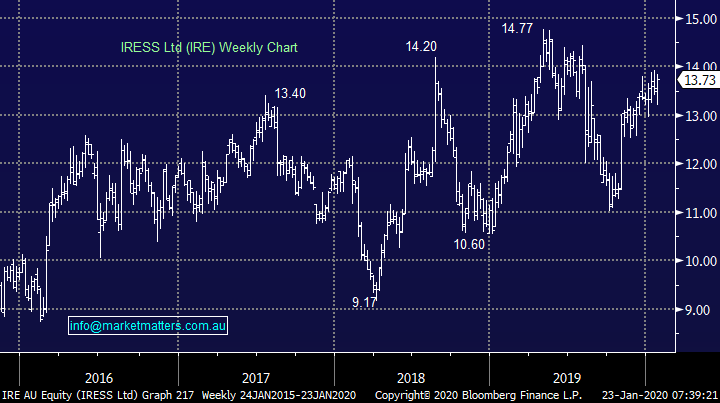
1 IRESS (IRE) $13.73
Software provider to the financial markets has a major footprint in London with around 30% of its revenue generated from the region versus ~50% in Australia. They also have operations in South Africa and Canada. The stock is not particularly cheap trading on an Est P/E of 32.54x while yielding 3.35% part franked however they do have a very sticky customer base, we pay them enough each month!
Technically, the ~$15 level could be challenged however its hard to get excited about IRE at current levels.
MM is neutral IRE
IRESS (IRE) Chart
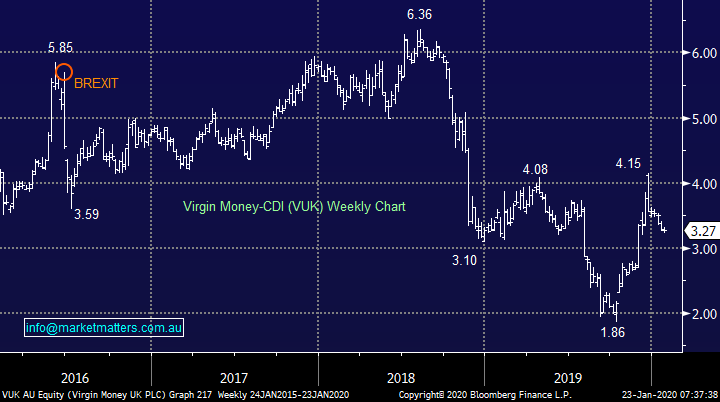
2 Virgin Money $3.27
The UK based Virgin Money which we previously knew as Clydesdale (CYB) has had an extremely choppy 12 months, culminating with the merger / takeover from Virgin Money. This deal was an important one for CYB giving them a better brand and better distribution networks which they clearly lacked. There is an aggressive cost out program underway which has yielded mixed results and there is a lot more to do in this context, while they also have a poor funding mix to contend with.
Theoretically, a bounce in UK economic actively should have a strong positive influence on VUK, however it is clearly a volatile beast and not for the faint hearted.
MM is neutral VUK
Virgin Money (VUK) Chart
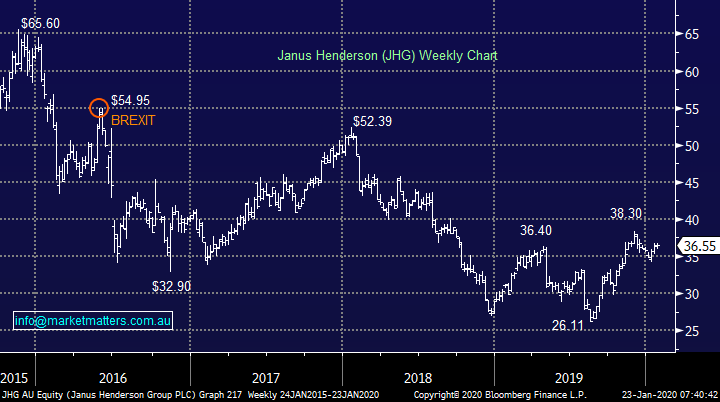
3 Janus Henderson (JHG) $36.55
Global fund manager Janus Henderson screens as one of the cheapest stocks in this space trading on an Est P/E of just 10x, almost unheard of in such an expensive market. Fund outflows following weak performance, a move to passive investments and the closure of some funds has put pressure on earnings resulting in essentially no growth being forecast for the next two years.
One obvious theme playing out in this market, and I discussed it yesterday at lunch with a bigger fund manager, is the concept of money flowing into the best company in each sector, almost without an anchor on value. CBA for instance an example in the banks.
JHG remains cheap and has reasonable exposure in the UK. Technically, the stock targets a move above the $40 area.
MM is bullish JHG
Janus Henderson (JHG) Chart
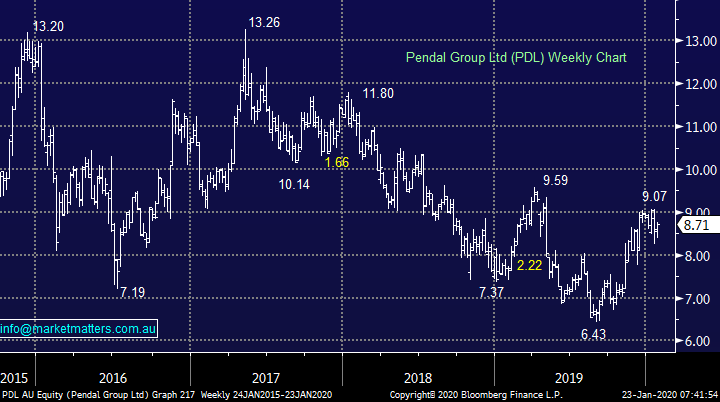
4 Pendal Group (PDL) $8.71
Another (unloved) fund manager that is trading at a significant discount to prior highs, PDL recently saw some weakness following a Funds Under Management (FUM) update however total FUM at the end of December was actually just near all-time highs set at the end of 2018, and with the strong performance in equity markets during January, total FUM should be at the highest level ever, well above $100b.
Better fund flows coming from the UK should drive earnings and with performance fee’s at a historical low, upside here also seems likely. On an Est P/E of 15.5x and a very attractive yield of 5.4%, there is a lot to like about PDL. Technically, it looks strong with atleast target ~8% higher
MM is bullish PDL
Pendal Group (PDL) Chart
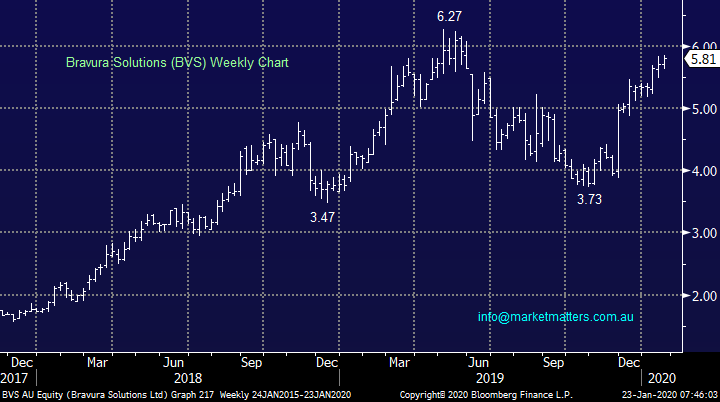
5 Bravura Solutions (BVS) $5.81
Financial services software provider BVS has over 50% of its business in the UK primarily through its flagship Sonata Wealth Management software business. While the stock clearly experiences bouts of volatility and is heavily influenced by prevailing market conditions, they do enjoy a strong earnings outlook over the coming years. On an Est P/E of 34.79x while yielding ~1.74% unfranked, it is priced accordingly.
Technically, it looks likely to rally towards $6.50 however the risk / reward here is uninspiring.
MM is neutral / bullish BVS
Bravura Solutions (BVS) Chart
Conclusion
MM’s preferred best 2 plays for UK exposure are JHG and PDL, we own both in our Growth Portfolio so no change likely in the near future.
Overnight Market Matters Wrap
· The SPI is down 15 points as US markets made some small gains overnight. The Dow and S&P 500 closed close to flat while the NASDAQ rose 0.14%.
· Chinese authorities said that more than 17 people have died from the Coronavirus with over 500 cases confirmed. People have also been diagnosed with the virus in Hong Kong and the US. Investors are concerned that travel and therefore economic growth could be moderated if the virus starts to spread to more people.
· Data last week showed US homebuilding was at a 13 year high in December and last night we saw US home sales rose 3.6% last month, the highest in nearly two years. Tech stocks were the winners in trading overnight with IBM profit forecasts ahead of expectations, while Tesla is now the second largest auto maker by market cap in the world.
· Most metals on the LME fell, while iron ore and gold were steady. Oil fell to a seven week low, down nearly 3% as traders are concerned that the Coronavirus will impact demand for travel and fuel
Have a great day!
James & the Market Matters Team
Disclosure
Market Matters may hold stocks mentioned in this report. Subscribers can view a full list of holdings on the website by clicking here. Positions are updated each Friday, or after the session when positions are traded.
Disclaimer
All figures contained from sources believed to be accurate. All prices stated are based on the last close price at the time of writing unless otherwise noted. Market Matters does not make any representation of warranty as to the accuracy of the figures or prices and disclaims any liability resulting from any inaccuracy.
Reports and other documents published on this website and email (‘Reports’) are authored by Market Matters and the reports represent the views of Market Matters. The Market Matters Report is based on technical analysis of companies, commodities and the market in general. Technical analysis focuses on interpreting charts and other data to determine what the market sentiment about a particular financial product is, or will be. Unlike fundamental analysis, it does not involve a detailed review of the company’s financial position.
The Reports contain general, as opposed to personal, advice. That means they are prepared for multiple distributions without consideration of your investment objectives, financial situation and needs (‘Personal Circumstances’). Accordingly, any advice given is not a recommendation that a particular course of action is suitable for you and the advice is therefore not to be acted on as investment advice. You must assess whether or not any advice is appropriate for your Personal Circumstances before making any investment decisions. You can either make this assessment yourself, or if you require a personal recommendation, you can seek the assistance of a financial advisor. Market Matters or its author(s) accepts no responsibility for any losses or damages resulting from decisions made from or because of information within this publication. Investing and trading in financial products are always risky, so you should do your own research before buying or selling a financial product.
The Reports are published by Market Matters in good faith based on the facts known to it at the time of their preparation and do not purport to contain all relevant information with respect to the financial products to which they relate. Although the Reports are based on information obtained from sources believed to be reliable, Market Matters does not make any representation or warranty that they are accurate, complete or up to date and Market Matters accepts no obligation to correct or update the information or opinions in the Reports. Market Matters may publish content sourced from external content providers.
If you rely on a Report, you do so at your own risk. Past performance is not an indication of future performance. Any projections are estimates only and may not be realised in the future. Except to the extent that liability under any law cannot be excluded, Market Matters disclaims liability for all loss or damage arising as a result of any opinion, advice, recommendation, representation or information expressly or impliedly published in or in relation to this report notwithstanding any error or omission including negligence.


