Overseas Wednesday – Can stimulus ignite a recovery for stocks? (MSFT US, V US, MCD US)
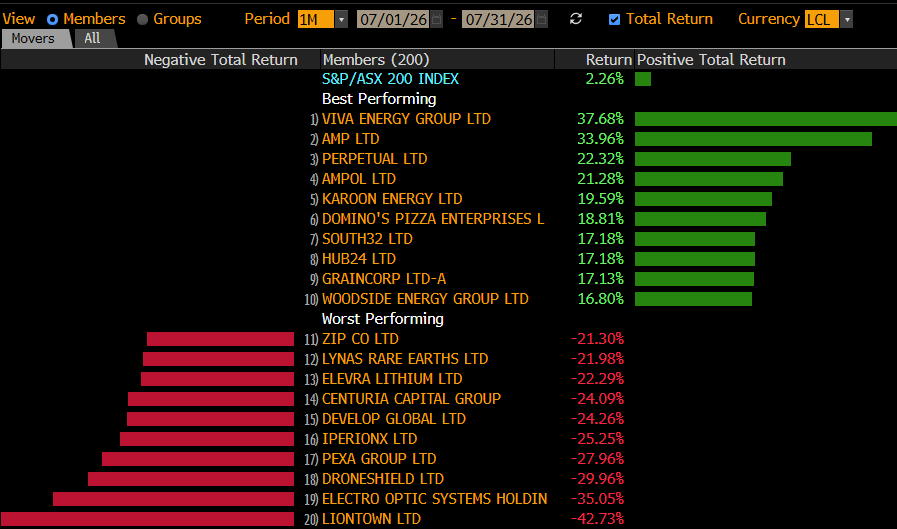
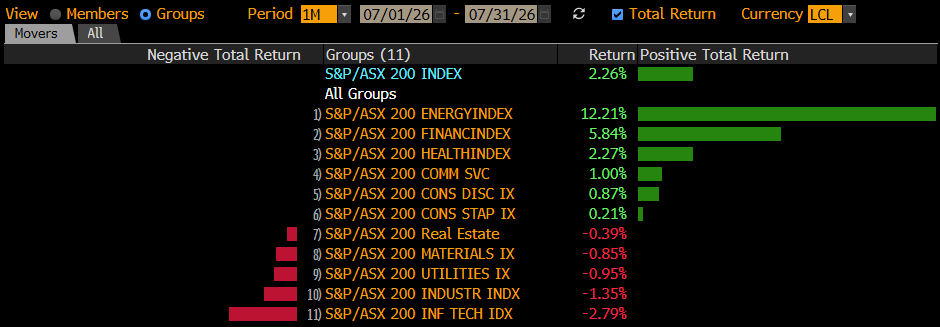
The ASX200 staged a phenomenal recovery yesterday rallying 500-points from its lows, if it wasn’t for the previous days -7% plunge the bulls would be getting very excited by this more than 3% gain on the day. Tuesday was all about “risk on” and perhaps a degree of covering the profitable “risk off” trades of the last few weeks – 10 stocks surged over 10% with the common theme being they had been whacked previously e.g. NRW Holdings (NWH) +13.8%, South32 (S32) +12.5% and Costa Group (CGC) +10.8%, conversely almost 20% of the ASX200 still closed in the red with this group dominated by the safe havens of Gold, Real Estate and Utilities.
Importantly if we get another spike lower by equities which feels a strong possibility in today’s market environment we now have some strong clues as to what’s likely to recover the fastest e.g. MM may consider adding South32 (S32) to its Growth Portfolio.
The markets changing its rhythm almost hourly at the moment hence we must keep our cautious optimism in perspective, the markets only recovered about 24% of its recent plunge. However we now know where some major investors / fund manages believe the ASX200 offers some compelling risk / reward buying – close to the 5500 area. If / when we do see another wave of panic selling in the come days or weeks we would now regard any dip under 5500 by the ASX200 as a buying opportunity from both a technical and fundamental perspective.
Our “Gut Feel” is we now see a choppy recovery back towards 6200 / 6400 before we get another test on the downside, this is the usual roadmap for panic sell-offs. When COVID-19 rolls through the US as it appears to be doing elsewhere we may have our catalyst for further panic in financial markets, at this stage the US appears to be in “wait and see mode” on the ground level which doesn’t bode well for the coming weeks after seeing what China implemented to stem the spread of the virus.
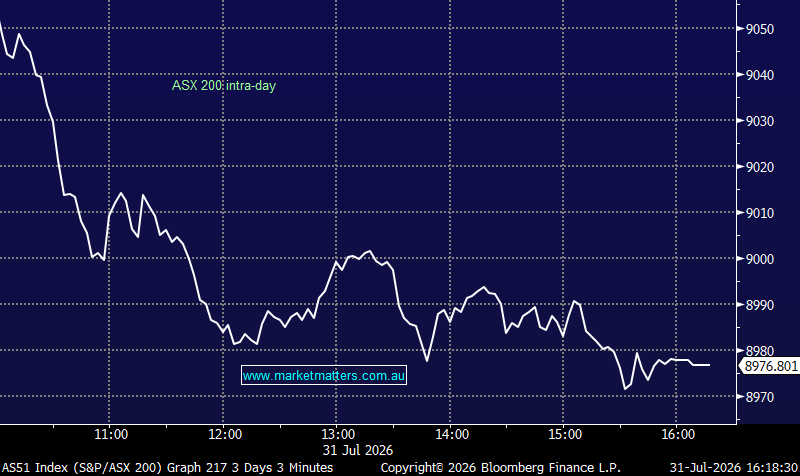
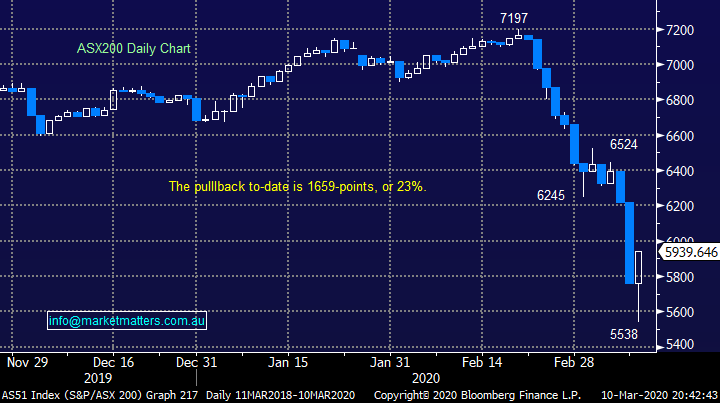
The chart below illustrates the rapid and steep decline by the ASX, we’ve been swinging about in normal weekly ranges almost hour to hour as panic has reigned supreme.
MM reiterates the key is don’t panic: valuation across the ASX has returned to mid-2018 levels but local 10-year bond yields have plunged from above 2.5% to under 0.8% this morning i.e. value relative to interest rates is clearly emerging.
ASX200 SPI March Futures 60-mins Chart
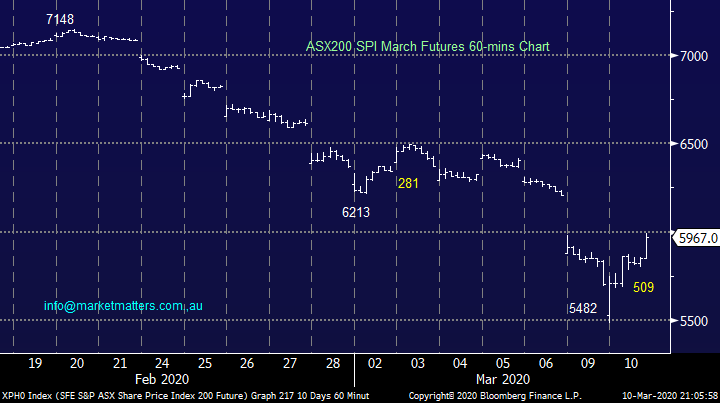
Stimulus was the underlying catalyst for yesterdays impressive recovery although I’m sure the 23% decline in just a few weeks became too much to resist for some fund managers.
1 – In an unscheduled evening statement President Trump promised “very substantial” stimulus to negate the impact of the coronavirus. Global financial markets clearly latched onto his rhetoric but it did feel they were saying that’s enough panic, at least for now.
2 – After Donald Trump’s time In the limelight we had act 2, US Treasury Secretary Steve Mnuchin, and he echoed the President, promising to use “whatever tools we need”.
3 – Scott Morrison’s much discussed $10bn package hasn’t got the weight to move markets like Trumps but it’s expected to have a positive impact locally with aged care and small business rumoured to be the major beneficiaries.
4 – What also caught my attention yesterday was China’s President XI Jinping visiting the outbreaks epicentre Wuhan in a strong message to the global community that all was under control in China and the country is returning to work.
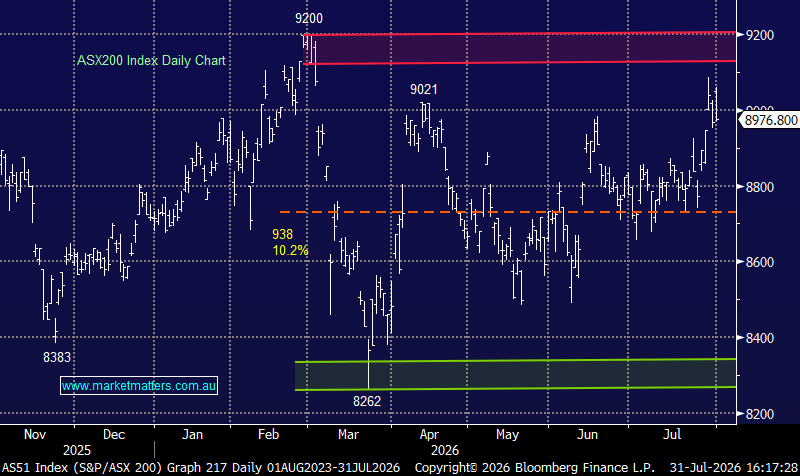
Looking at the path of the ASX’s decline below at least a few days consolidation appears highly likely but Friday might see the return of uncertainty because some of the largest falls have been on Mondays following fresh “bad news” over the weekend.
ASX200 Chart
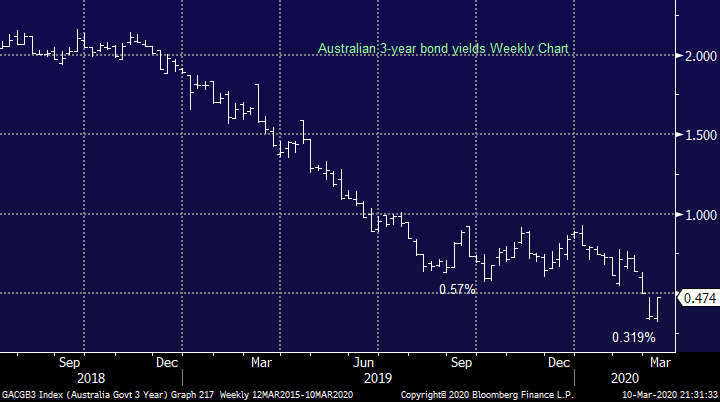
Tuesday’s flight away from safety as “risk on” was the main game in town was illustrated perfectly yesterday by the local bond market which saw 3-year bond yields rally back towards 0.5%, noticeably not significantly lower than their average of the last 6-months – perhaps they are saying one more rate cut will be the maximum for Australia.
MM continues to look for a major inflection point for bond yields i.e. a bottom.
Australian 3-year Bond Yields Chart
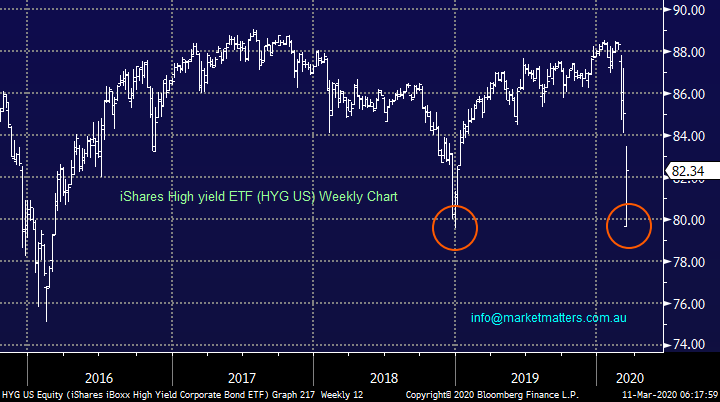
However we also feel its high yield bond prices that are going to be the main influence on equities in the medium term and this is where central banks may be focusing their attention, after all they cannot cut interest rates much further! Very simply Companies, not unlike the everyday man on the street, need the ability to borrow $$ to operate.
The chart below illustrates how the latest Oil Shock initially sent high yield bonds plunging but they appear to have found significant support at the same levels as late 2018. The global Energy Sector carries large levels of debt, with the unprofitable US shale energy companies coming to mind, if we see corporate bond markets unravel this debt will become significantly more expensive as credit spreads blowout – the last 3-4 weeks has obviously been painful but they should be manageable as its not out of recent years levels.
MM believes the high yield bonds (cost for companies to borrow) will determine whether stocks can recover through 2020.
We will cover this topic further in today’s income note, along with our clear views around ASX listed Hybrids.
iShares High Yield Corporate Bond ETF (HYG US) Chart
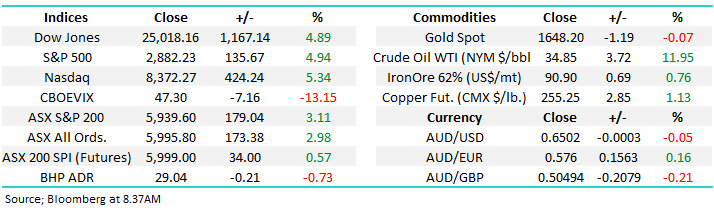
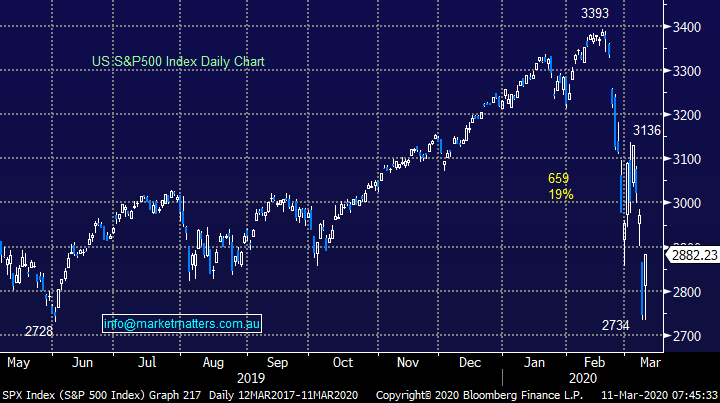
Overnight US stocks bounced strongly, with the Dow Jones putting on 1167pts / 4.89% closing on session highs. Attempting to second guess this beast under the current volatility is a tough, tiring and potentially futile game, I believe the most prudent course at present is to identify levels where we will buy and sell and simply sit back and wait, in this environment they are both likely to be reached sooner rather than later!
At this stage MM will look to reduce risk around the 3000 level, or 5% higher, while our buyers hat is likely to be donned into a spike below 2700, 5% lower – a 10% band is not that much in today’s market!
MM has now transitioned to short-term neutral / bullish stance on US equities.
US S&P500 Index Chart
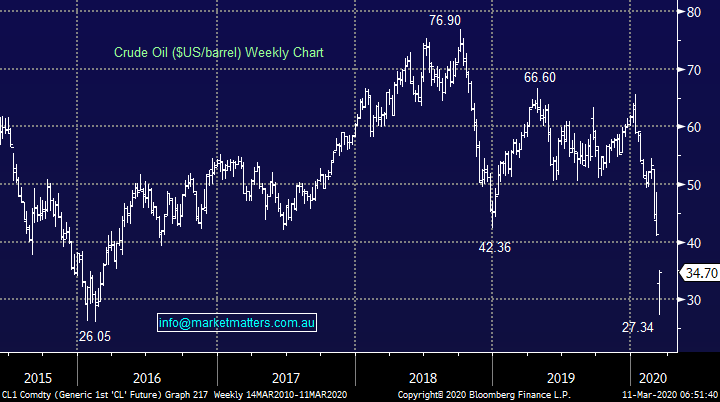
Trying to unravel the thought process, or future actions, of either Russia or Saudi Arabia is bordering on madness in itself but again we can identify areas where the risk / reward will become simply too compelling. In this case it would be another leg lower to test or break its 2016 lows ~$US26/barrel otherwise these 2 petulant children can play on their own!
MM will consider increasing our oil exposure if prices panic again below their 2016 lows.
Crude Oil Chart
MM International Equites Portfolio
MM continues to hold 21% of our International Portfolio in cash “looking to go shopping” into the current weakness in equities: https://www.marketmatters.com.au/new-international-portfolio/
Patience has paid of to-date with this portfolio but we are sharpening the pencil as some “bargains” unfold in front of us, we have tweaked our shopping list slightly from last week :
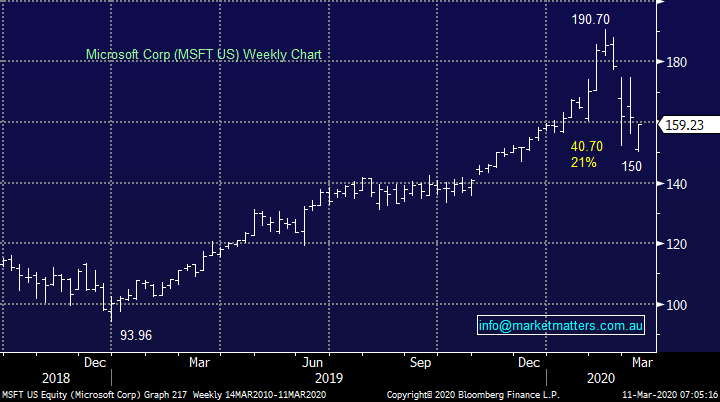
1 - Microsoft (MSFT US) : we are looking to average our position around current levels leaving us the ammunition / flexibility to increase our holding further around the $US140-145 region.
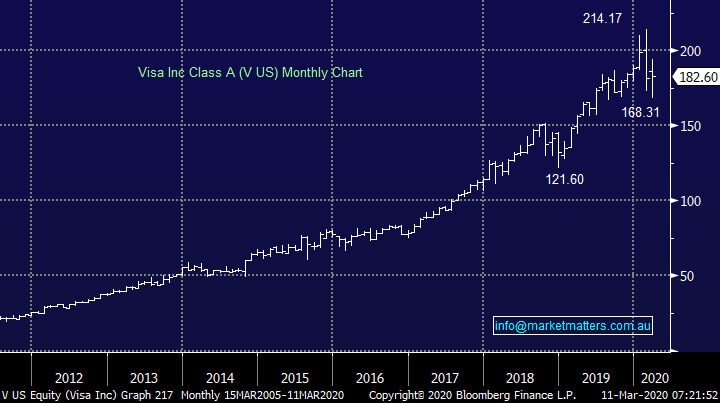
2 – Visa (V US) : we are keen to average our exposure to Visa under $US170.
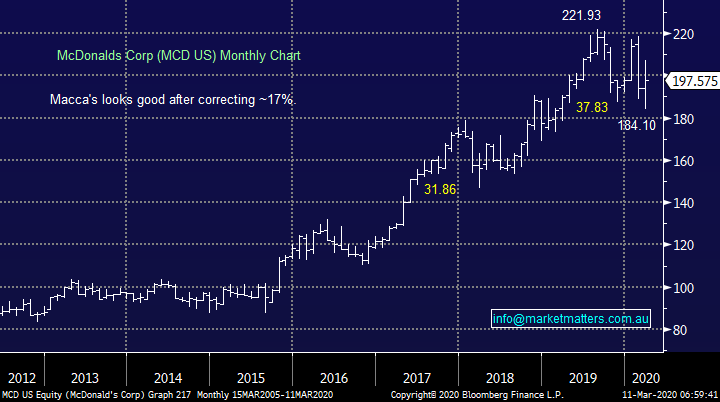
3 – McDonalds Corp (MCD US) : we like MCD at current levels, this remains our favourite play in case stocks have finished their correction.
MM is looking to slowly deploy our 21% cash position.
Microsoft (MSFT US) Chart
Visa (V US) Chart
McDonalds Corp (MCD US) Chart
MM Global Macro ETF Portfolio
No change, MM’s cash position remains at 39% in our Global Macro ETF Portfolio with current volatility throwing up opportunity: https://www.marketmatters.com.au/new-global-portfolio/
Similarly to the International Portfolio patience has paid of here reasonably well, we now have 4 plays in our sights for the coming weeks.:
1 – Switch our iShares Silver ETF (SLVP US) position into the Invesco DB Agricultural Fund (DBA US) i.e. increase the position size of the later.
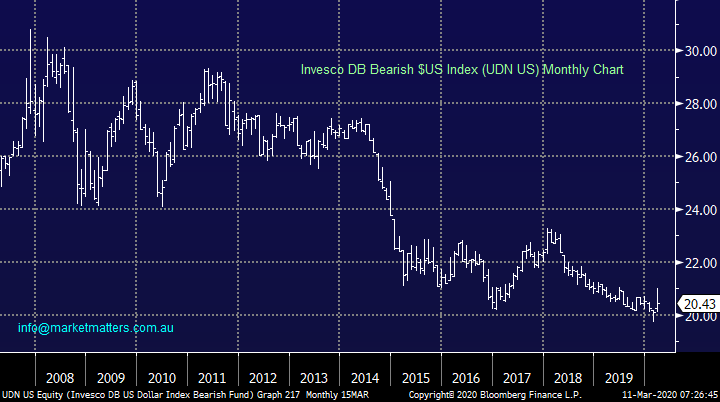
2 – Buy Invesco Bearish $US Index ETF (UDN US), we are looking for at least a 15% appreciation in this ETF.
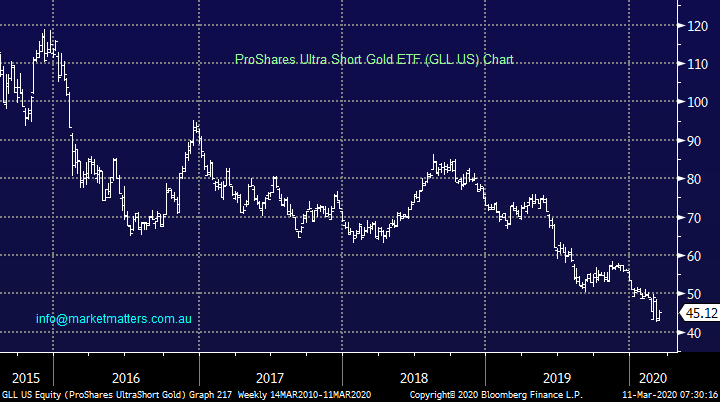
3 – Buy the ProShares ultra-short Gold ETF (GLL US) around current levels - https://etfdb.com/etf/GLL/#etf-ticker-profile
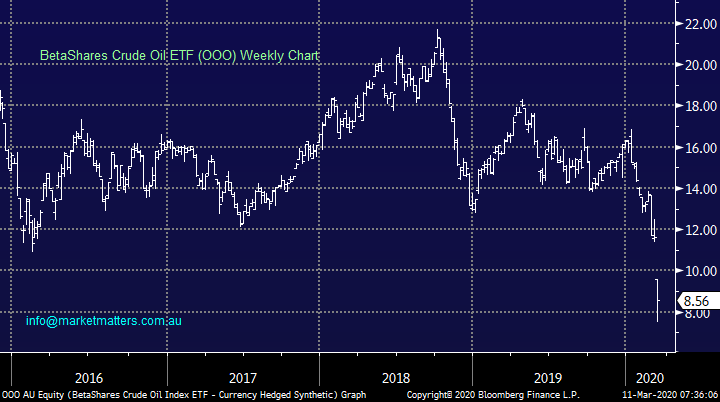
4 – Buy the BetaShares crude oil ETF into a fresh dip lower for the underlying commodity - https://www.betashares.com.au/fund/oil-etf-betashares/
NB Number 3 & 4 ETF’s have been corelated of late hence position size will be determined accordingly.
Invesco DB Bearish $US Index (UDN US) Chart
ProShares Ultra-Short Gold ETF (GLL US) Chart
BetaShares Crude Oil ETF (OOO) Chart
Overnight Market Matters Wrap
- A volatile session overnight across Europe and the US, the Dow hitting the red early in the session, before recovering strongly to rally and close on its highs as investors digested the likely stimulus package.
- Crude oil rose 11.95% on the back of the potential stimulus, while the Saudis and Russians remain a concern.
- LME metals were weaker, while iron ore edged higher, however BHP is expected to underperform the broader market after ending its US session off an equivalent of -0.73% follow a rebound in yesterday’s session.
- The March SPI Futures is indicating the ASX 200 open 63 points higher, testing the 6000 level this morning.
Have a great day!
James & the Market Matters Team
Disclosure
Market Matters may hold stocks mentioned in this report. Subscribers can view a full list of holdings on the website by clicking here. Positions are updated each Friday, or after the session when positions are traded.
Disclaimer
All figures contained from sources believed to be accurate. All prices stated are based on the last close price at the time of writing unless otherwise noted. Market Matters does not make any representation of warranty as to the accuracy of the figures or prices and disclaims any liability resulting from any inaccuracy.
Reports and other documents published on this website and email (‘Reports’) are authored by Market Matters and the reports represent the views of Market Matters. The Market Matters Report is based on technical analysis of companies, commodities and the market in general. Technical analysis focuses on interpreting charts and other data to determine what the market sentiment about a particular financial product is, or will be. Unlike fundamental analysis, it does not involve a detailed review of the company’s financial position.
The Reports contain general, as opposed to personal, advice. That means they are prepared for multiple distributions without consideration of your investment objectives, financial situation and needs (‘Personal Circumstances’). Accordingly, any advice given is not a recommendation that a particular course of action is suitable for you and the advice is therefore not to be acted on as investment advice. You must assess whether or not any advice is appropriate for your Personal Circumstances before making any investment decisions. You can either make this assessment yourself, or if you require a personal recommendation, you can seek the assistance of a financial advisor. Market Matters or its author(s) accepts no responsibility for any losses or damages resulting from decisions made from or because of information within this publication. Investing and trading in financial products are always risky, so you should do your own research before buying or selling a financial product.
The Reports are published by Market Matters in good faith based on the facts known to it at the time of their preparation and do not purport to contain all relevant information with respect to the financial products to which they relate. Although the Reports are based on information obtained from sources believed to be reliable, Market Matters does not make any representation or warranty that they are accurate, complete or up to date and Market Matters accepts no obligation to correct or update the information or opinions in the Reports. Market Matters may publish content sourced from external content providers.
If you rely on a Report, you do so at your own risk. Past performance is not an indication of future performance. Any projections are estimates only and may not be realised in the future. Except to the extent that liability under any law cannot be excluded, Market Matters disclaims liability for all loss or damage arising as a result of any opinion, advice, recommendation, representation or information expressly or impliedly published in or in relation to this report notwithstanding any error or omission including negligence.