A tough week let’s be positive at least its Friday!
It was a strange night in the US, no volatility measures triggered, no huge swings in stocks, weakness was bought, but not aggressively so, strength was sold but to the same tempered degree while the technology stocks resumed their market leadership. A subdued night overall which has proven a rarity in recent weeks, The S&P 500 added 0.47% while the Nasdaq advanced 1.58%.
On our market yesterday, stocks were sold down to a new low despite the Australian Government and Reserve Bank (RBA) now clearly taking the COVID-19 pandemic extremely seriously. Their respective actions escalated yesterday to combat the virus head-on from both a humane & financial front:
1 – Scott Morrison has banned all non-Australians entering our country as its estimated that ~80% of the local COVID-19 confirmed cases have been flown onto our shores.
2 – This measure follows closely on the coattails of the banning social gatherings of over 100-people.
We will continue to monitor the pandemic statistics closely but as we’ve said over recent weeks “it feels like it’s going to get worse before it gets better”.
On a positive note every day that passes is irrefutably one day closer to the end of the coronavirus pandemic.
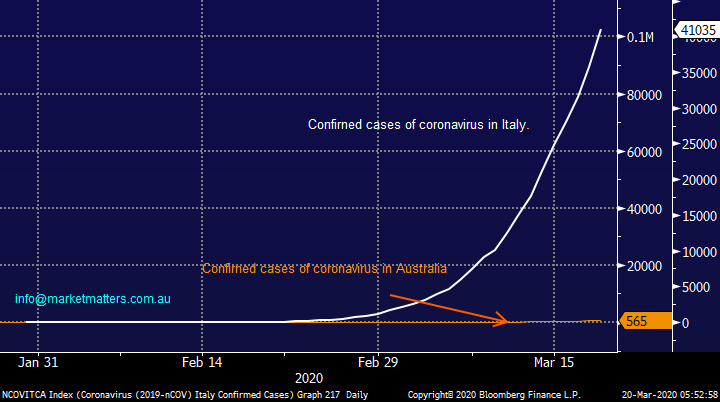
Coronavirus in Italy & Australia Chart
On the financial level the RBA stepped up their aggressive intervention to prop up our economy and ensure the financial system doesn’t grind to a halt while also laying some foundations for a springboard when we come out the other side of this devastating outbreak. The main 2 actions were as follows:
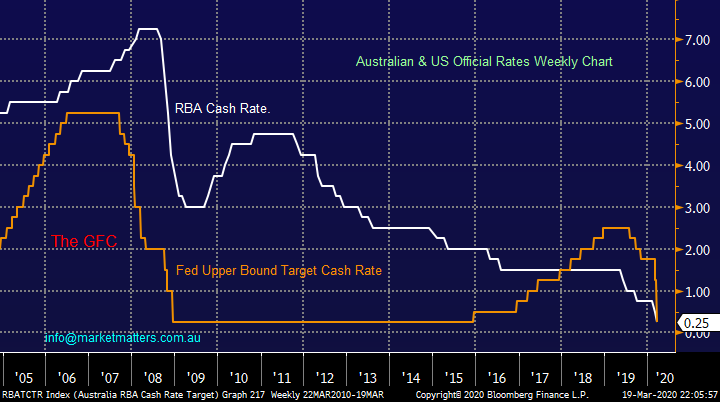
1 – The RBA again cut interest rates another 0.25%, to their lowest in history, we’re now only 0.25% / one more cut away from zero!
2 – They also offered a $90bn loan to banks at 0.25% for 3-years to lend to small business and companies under pressure from the COVID-19 pandemic.
Arguably most importantly the RBA have committed to implement “whatever it takes” to help the Australian economy cope with the outbreak.
The RBA & Fed’s official cash rates Chart
From a markets perspective, stocks started falling a month ago (21st February) and have now declined ~34% in 20 trading days. To put this, move into context, during the GFC, it took 47 weeks for the market to fall the first 32% before eventually declining by ~50% over 15 months. The move we have seen in the last month is an unprecedented one.
Technically we’ve been suggesting a break to fresh lows below 4873, towards the 4800 area as the ideal platform for a strong countertrend bounce - the momentum is clearly still down making the next 24-48 hours fascinating to MM, this morning we have SPI Futures pricing a rally of ~100pts implying the ASX 200 will trade back towards 5000 this morning - a step in the right direction however this is an extremely fickle market and +/- 100pts moves have been playing out at whim.
Technically the next 15% move should be up – perhaps central banks are about to press more buttons.
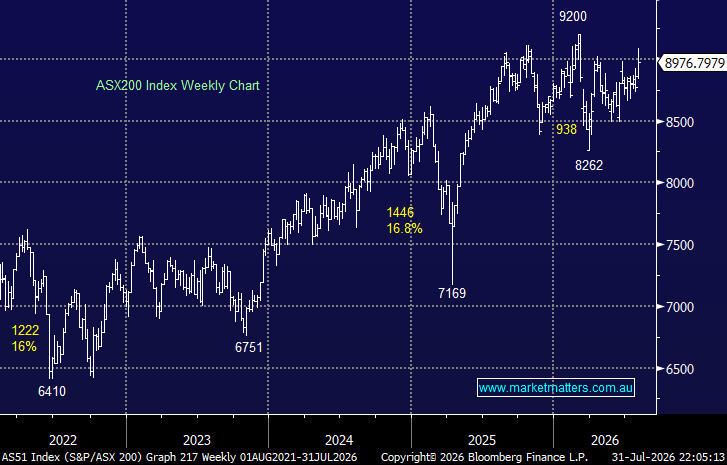
ASX200 Chart

Building the ideal portfolio for today’s market
The chart below is from Shane Oliver at AMP, a permanent bull on the market however I think it’s often good to take a step back and look from a historical perspective at asset class returns to provide context about why we do what we do, why we focus so heavily on the share market as a source of growth.
History tells us that investing in Australian shares is an excellent long-term investment with an average return of 11.5% pa. Volatility however is also high and when we think about returns per unit of risk, the dynamic is less attractive for those that do not have a longer-term mindset and ability to handle the inevitable bumps in the road.
The relative performance of investments in Australia
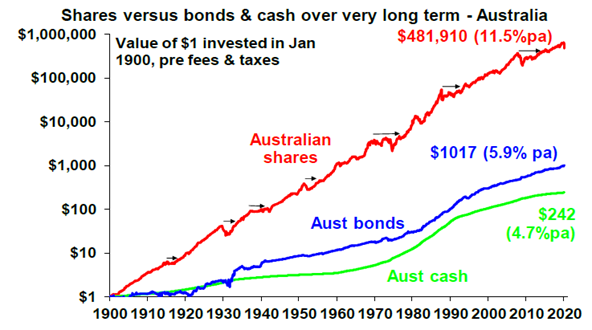
Source: Bloomberg / AMP Capital
Today we’ve briefly looked at the major sectors which make up the ASX200 as a precursor to this weekend’s note, which will focus on how we see our portfolios positioned moving forward. Our view remains that we need to take this opportunity to ‘up spec’ our portfolios, gravitating up the quality spectrum to set a portfolio (s) that will give us best returns relative to risk from here.
As part of that framework, sector allocations are important. i.e. where do we want to be overweight / underweight from here, and what sectors do we want to avoid completely.
Firstly, there are 3 major macro-economic assumptions MM will be using in our analysis:
1 – Things will eventually return to normal post COVID-19 although consumer confidence will certainly not return over night.
2 – The huge / unprecedented amount of financial stimulus that’s being pumped into the global economy will awaken that sleeping beast called inflation.
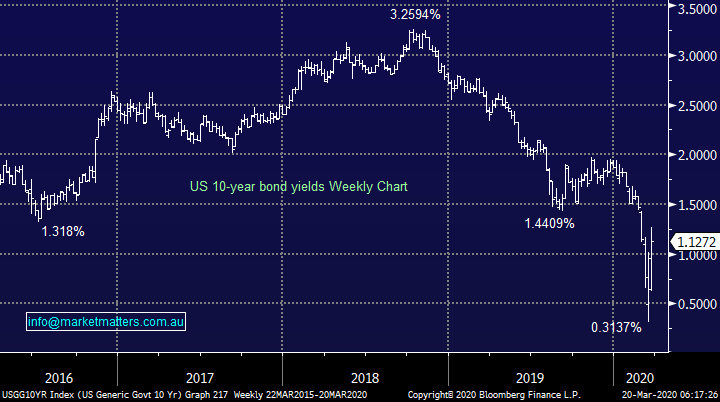
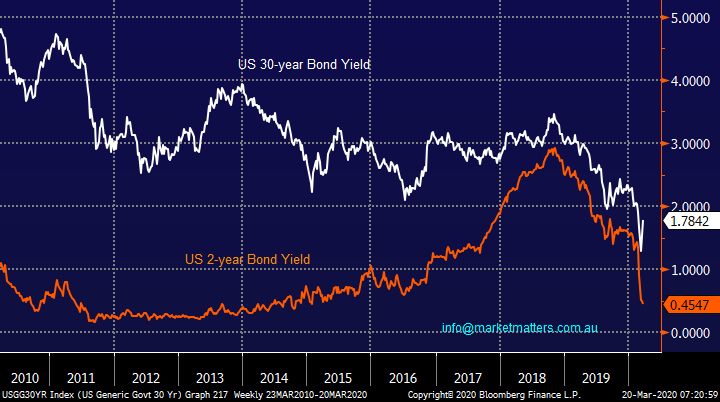
3 – Global bond yields have now bottomed which will alter the investment landscape moving forward.
US 10-year Bond Yields Chart
Part 1 – a brief review of the 11 sectors of the ASX200
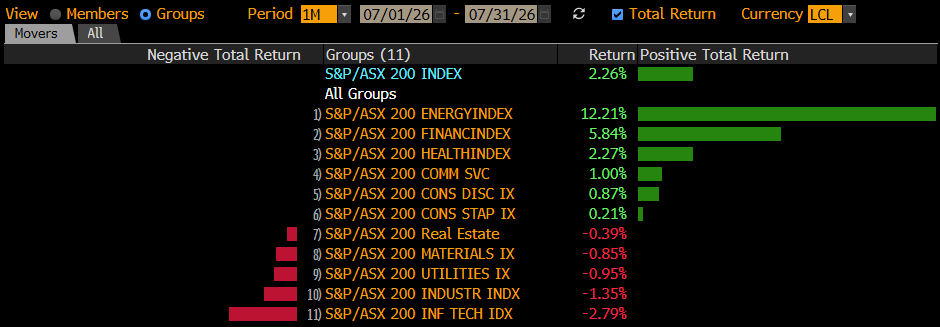
The ASX200 is divided into 11 clearly defined sectors which we have illustrated below, this morning I have briefly looked at the largest 5 components which make up over 70% of the ASX200 as we build the foundations for our Weekend Report where MM will be identify the sectors we like the most and importantly the stocks within those sectors we want to own, if not already.
MM will continue to tweak our portfolios to maximise upside while be reducing long term risk to capital
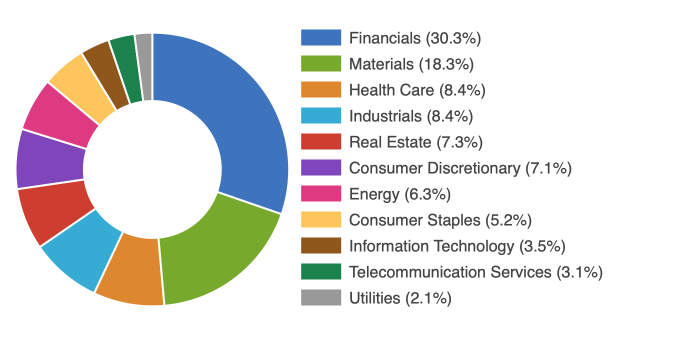
Source: asx200list.com
At a sector level, financials clearly dominate with around 30% of the market followed by materials and healthcare, while the largest deviations / alpha generation can therefore come in from the lower half of that list, and of course through stock selection.
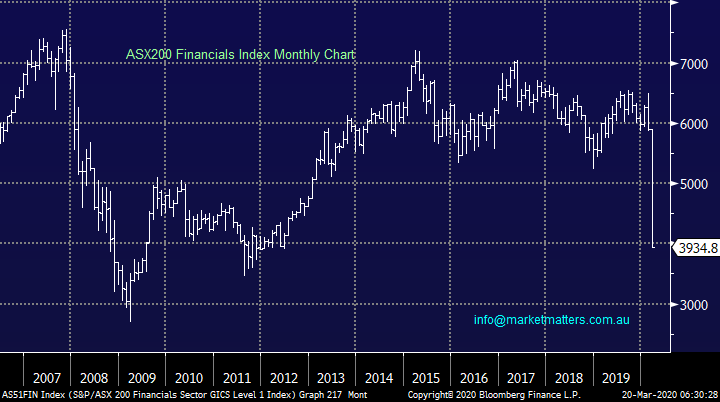
1 The ASX200 Financials
The Financials have actually traded sideways since the GFC with obvious pockets of major under / out performance.
Primary members include the Banks, Insurers and Fund Managers, as the chart below illustrates it’s been a tough time all round, however the size of the recent rout over a 1-month period is an obvious takeaway.
Our view on bonds yields (bottomed) and inflation (upside risk in time) will have a major impact on the Financial sector.
MM believes the government / RBA will be forced to help maintain a strong banking sector but plunging interest rates while bond yields rise will cause issues on margins within the banking space.
Importantly, avoiding pockets of extreme pain / risk will be key here, not all financials are equal and this ‘new world’ environment we find ourselves in will cause problems for some business models. This is complex area to navigate in times of financial stress, and care must be taken to position well amongst this group.
Overall, this sector is likely to be a mixed bag for MM.
The ASX200 Financials Index Chart
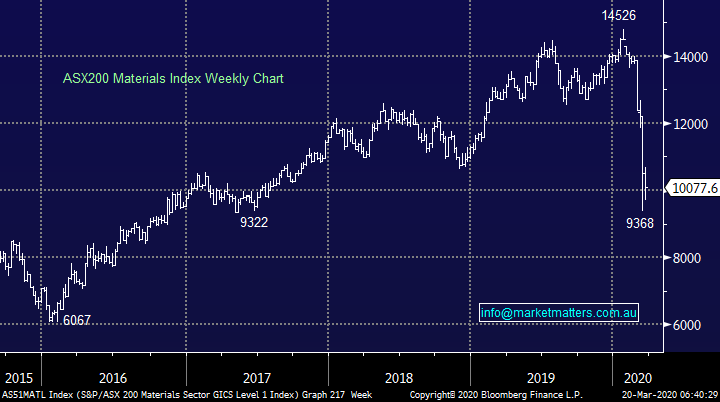
2 The ASX200 Materials Sector
The Material sector is dominated by the resources companies, but it also includes stocks like Bluescope (BSL), Boral (BLD) & packaging company Orora (ORA). The sector has been sold off aggressively as the global economy grinds to a halt but it should be a beneficiary of the huge stimulus tailwind with “cash cows” like BHP (BHP) and Fortescue (FMG) looking particularly attractive.
The majority of Australian resource stocks are in a ‘net cash’ position or if they’re not (like BHP, RIO, FMG) they could be very easily. This is a sector that has learnt from past mishaps and balance sheets overall are in incredibly good shape.
MM remains very keen on the Materials stocks moving forward.
The ASX200 Materials Index Chart
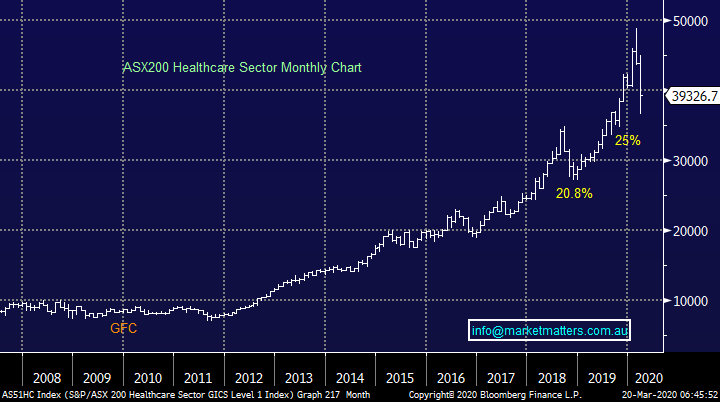
3 ASX200 Healthcare Sector
The Healthcare Sector should undoubtedly contain some gems of performance over the years ahead considering the nature of the current global crisis, however again, there is a big variance amongst the exposures of the various constituents within the sector, a topic we’ll delve into on the weekend.
MM likes some of the Healthcare stocks after their ~25% correction.
ASX200 Healthcare Index Chart
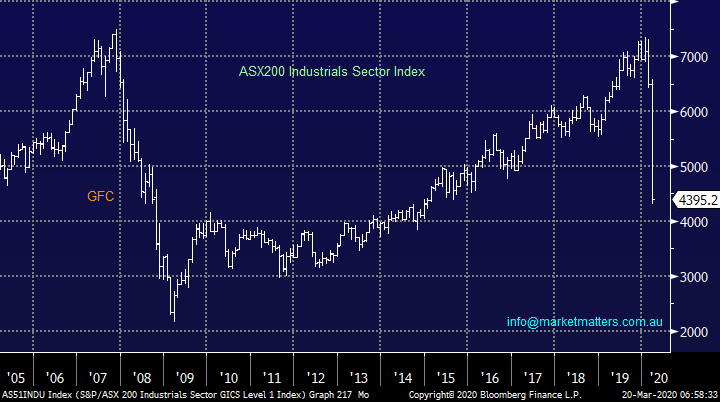
4 The ASX200 Industrials Sector
The Industrials Sector like much of the market has surrendered more than 5-years gains in just a couple of weeks, a great illustration of the unprecedented times we are currently living in.
This is a very diverse group of stocks containing household names like Seek (SEK), Bingo (BIN) and Sydney Airports (SYD) plus many lesser known companies, these need evaluating on a very stock by stock basis, and many of these companies do carry reasonable debt levels.
MM likes parts of the Industrial sector at today’s levels.
ASX200 Industrials Index Chart
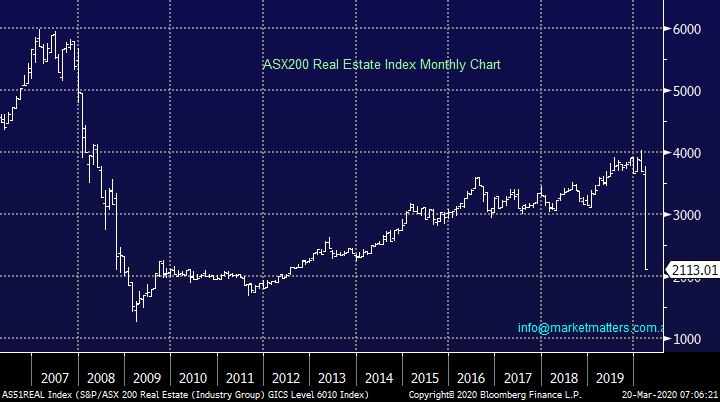
5 ASX200 Real Estate Sector
The Real Estate Sector has plunged of late reminding us of how badly it fared during the GFC, this is not a case of it being cheap simply because its halved. While gearing has been low on historical metrics, underlying asset prices have been high thanks mostly to cheap funding. That funding has now become more expensive and forced selling in a sector like this can create a lot of downward pressure.
The bulk of the sector is now trading at a discount to asset backing.
MM is wary of this sector with bond yields looking bullish.
ASX200 Real Estate Index Chart
Conclusion
Of the 5 sectors touched on today our favourite two are the Materials – with a skew towards resources and Healthcare stocks but there will be some value and exciting opportunities in at least 2 of the other 3.
An updated snapshot of Global Markets
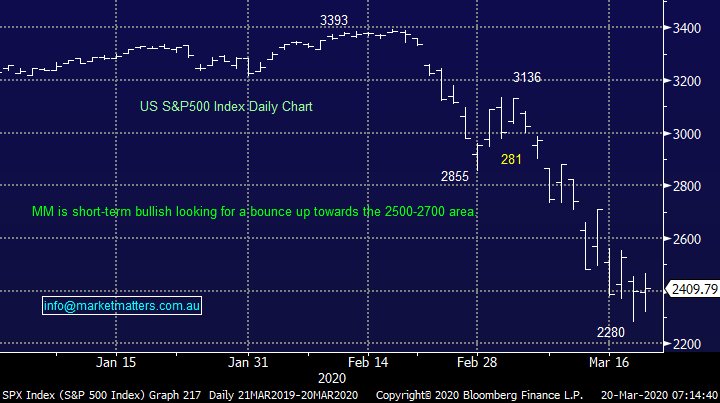
US stocks bounced last night, potentially confirming our view that the downside momentum is actually waning, we like US stocks for a good bounce from last 48-hours low.
At MM we have refrained from aggressively pushing the buy button for our International Portfolio, it just “felt wrong” previously but we are likely start again in the coming weeks.
US S&P500 Index Chart
Bond yields are moving in different directions depending if you look short or long-term, inflation prospects pushing up long term yields while central banks push down short-term rates, a very tricky environment for the banking / financial sector.
MM believes longer duration US bond yields have bottomed in 2020.
US 10-year Bond yield Chart
Overnight Market Matters Wrap
- The US closed in positive territory overnight led by the tech based Nasdaq - the Bank of England set its benchmark interest rate to a record low at 0.25%
- Crude oil gained strongly, over 10% as the Fed reserve launched a new lending facility to support US money-market mutual funds as well as expanding its currency exchange program with its central banks counterparties.
- The June SPI Futures is indicating the ASX 200 to open around the 4975 level this morning
Have a great day!
James & the Market Matters Team
Disclosure
Market Matters may hold stocks mentioned in this report. Subscribers can view a full list of holdings on the website by clicking here. Positions are updated each Friday, or after the session when positions are traded.
Disclaimer
All figures contained from sources believed to be accurate. All prices stated are based on the last close price at the time of writing unless otherwise noted. Market Matters does not make any representation of warranty as to the accuracy of the figures or prices and disclaims any liability resulting from any inaccuracy.
Reports and other documents published on this website and email (‘Reports’) are authored by Market Matters and the reports represent the views of Market Matters. The Market Matters Report is based on technical analysis of companies, commodities and the market in general. Technical analysis focuses on interpreting charts and other data to determine what the market sentiment about a particular financial product is, or will be. Unlike fundamental analysis, it does not involve a detailed review of the company’s financial position.
The Reports contain general, as opposed to personal, advice. That means they are prepared for multiple distributions without consideration of your investment objectives, financial situation and needs (‘Personal Circumstances’). Accordingly, any advice given is not a recommendation that a particular course of action is suitable for you and the advice is therefore not to be acted on as investment advice. You must assess whether or not any advice is appropriate for your Personal Circumstances before making any investment decisions. You can either make this assessment yourself, or if you require a personal recommendation, you can seek the assistance of a financial advisor. Market Matters or its author(s) accepts no responsibility for any losses or damages resulting from decisions made from or because of information within this publication. Investing and trading in financial products are always risky, so you should do your own research before buying or selling a financial product.
The Reports are published by Market Matters in good faith based on the facts known to it at the time of their preparation and do not purport to contain all relevant information with respect to the financial products to which they relate. Although the Reports are based on information obtained from sources believed to be reliable, Market Matters does not make any representation or warranty that they are accurate, complete or up to date and Market Matters accepts no obligation to correct or update the information or opinions in the Reports. Market Matters may publish content sourced from external content providers.
If you rely on a Report, you do so at your own risk. Past performance is not an indication of future performance. Any projections are estimates only and may not be realised in the future. Except to the extent that liability under any law cannot be excluded, Market Matters disclaims liability for all loss or damage arising as a result of any opinion, advice, recommendation, representation or information expressly or impliedly published in or in relation to this report notwithstanding any error or omission including negligence.