Subscribers questions (NAB, MQG, WEB, APT, HBRD, BPT, MHH, COH, MXWO, CWNHB, IGL, TCL, SWM, CBAPF)
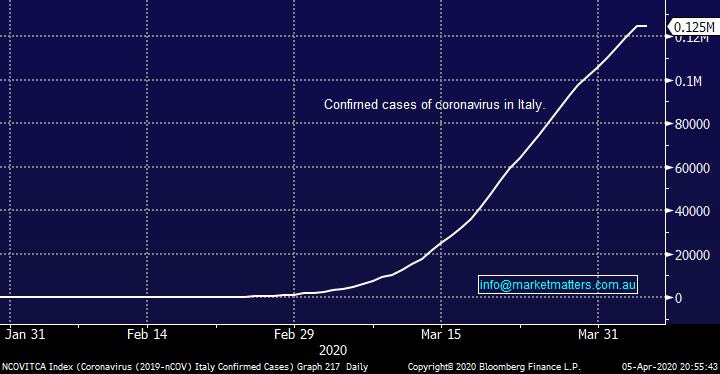
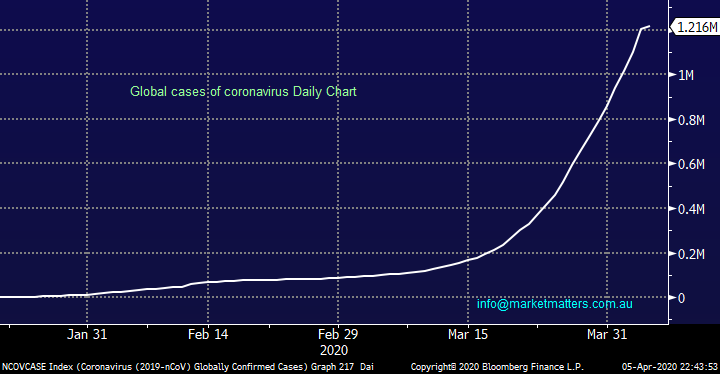
While I have no choice but to discuss the Coronavirus, I’ve deliberately kept it to a few salient points as I’m sure members already have more than enough exposure from the TV and Social Media. Unfortunately, we now have over 1.25m confirmed cases and 68,000 deaths across the world, undoubtedly these statistics will get far worse before they improve as the virus rolls through countries like the US, India and Indonesia. This time last month Italy only had around 5,000 cases, roll on one devastating month and the number has magnified by more than 25x and the deaths alone sit at more than 15,500. This beautiful southern European gem enables us to consider some worst-case scenarios if a country is too slow to react, my first thought being President Trump and the US.
The good news is that Italy has just registered its lowest death toll for a week as the government extends its lockdown which started on April 13th, also the new active cases is down significantly from a fortnight ago. Our simplistic modelling suggests a plateau around 4-weeks after lockdown and then another month to really “break the back” of the virus – when Scott Morrison said the Australian lockdown was for at least 90-days we feel he was somewhere between “on the money and being sensibly a touch conservative”. In other words for parents Term 2 will be all home schooling and restaurants / cafes that we all enjoy & take for granted might not be fully back in business until mid-late June.
MM is optimistic that Australia will be “on top of” COVID-19 by early June.
Italian Coronavirus confirmed cases Chart
Italian Coronavirus deaths Chart
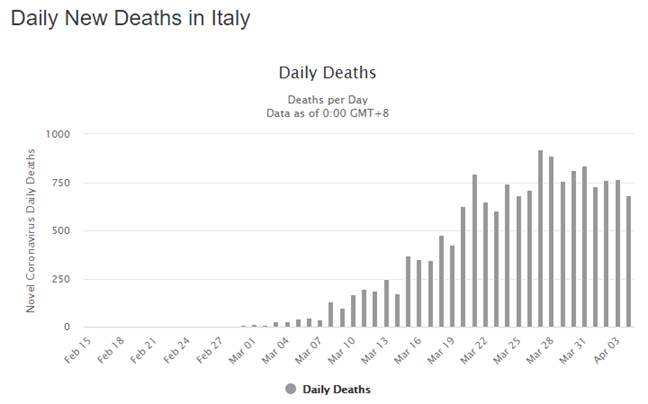
Source: www.worldometers.info
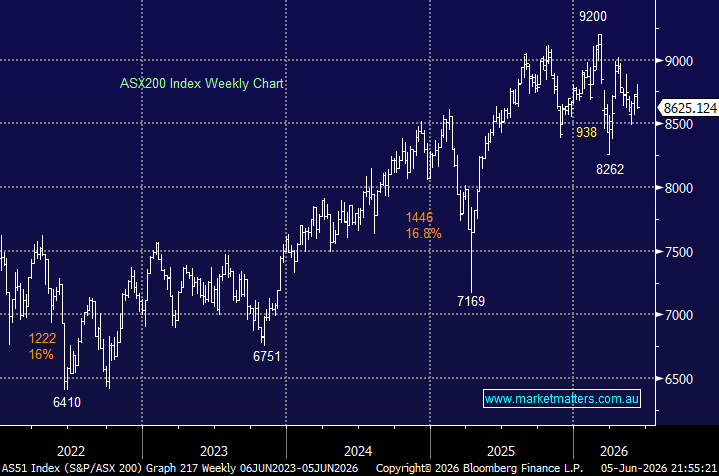
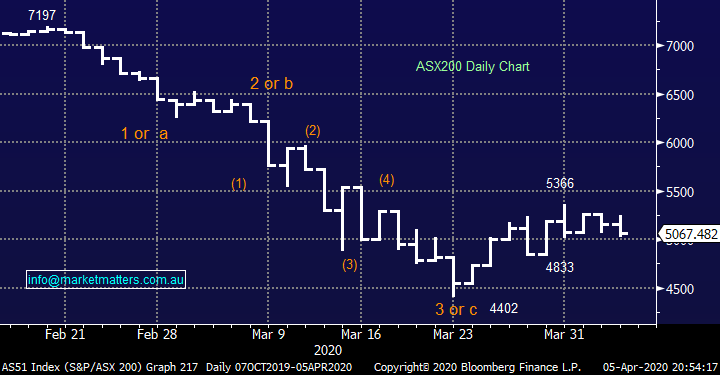
If we are correct the local humanitarian impact of COVID-19 will be improving significantly by mid-June then theoretically the economic landscape will improve not too long afterwards hence we feel stocks are presenting good value at current levels, especially if we assume interest rates will be hovering below 1% for at least a few years. However, these are fickle times and MM / subscribers alike must remain open to variations on our view for markets.
MM is in “buy mode” believing stocks should be accumulated around current levels.
ASX200 Index Chart
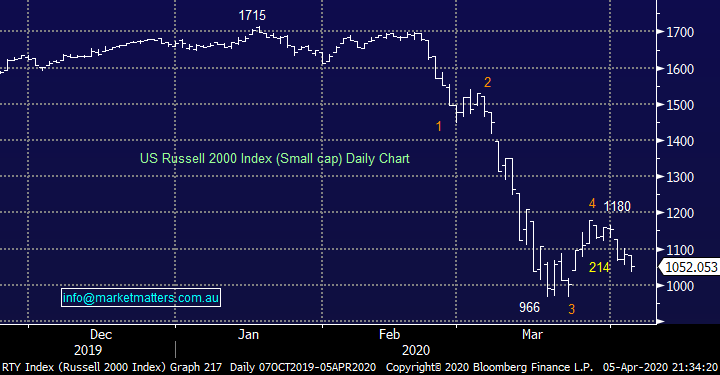
On Friday night US stocks slipped lower with Dow declining by 360-points, a fairly benign move compared to most of March. We have 2 scenarios evolving for US stocks, we’ve used the small cap Russell 2000 chart below to illustrate both:
1 – US stocks decline another ~10% to fresh 2020 lows providing an excellent buying opportunity.
2 – Last week’s consolidation of the recent bounce will create a platform for stocks to extend their 10-day recovery. In the case of the Russell 2000 a close above Fridays high will generate an excellent risk / reward buying opportunity i.e. just 3% higher.
MM is anticipating another choppy but quieter week.
Russell 2000 Index Chart
Thanks for the questions this morning, we’re chuffed to read the numerous thanks as we attempt to navigate these awful times on all levels. Please excuse the brevity in most answers but I’m sure everyone understands we’re living in very busy times for financial markets.
Question 1
“Question for James please I noticed that you still own Bank hybrids in the income portfolio. I also have a few holdings in my income portfolio but am thinking to switching to the underlying equity (e.g. NAB hybrid for Nab etc) Is this a good idea, and is this the best time to do this or do we wait pls? The premise being that when stocks bounce the underlying equity will bounce more than hybrid. Is this your view as well or different pls? Whilst these are in my "income portfolio" I had essentially parked my money in hybrids (assuming quasi-cash) however these have also taken a hit but not as large as the underlying bank stocks.” - Many thanks Subhas D.
Hi Subhas,
A reminder we provide general advice rather than personal advice, so the answer does not take into consideration your personal circumstances.
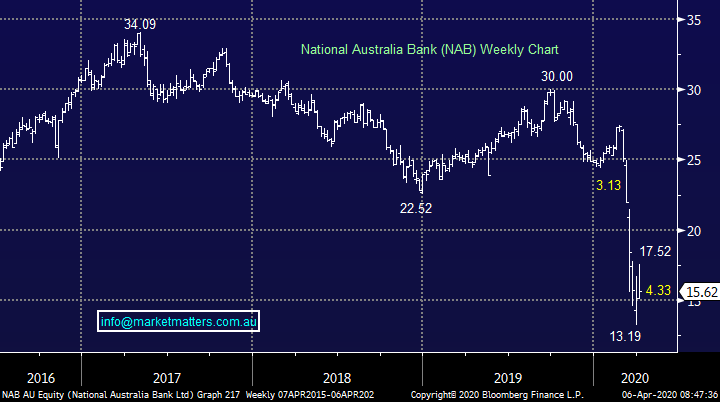
Over time, we would expect better returns from currently depressed share prices such as NAB’s over and above the returns from Hybrids, however, shares will have greater volatility and are higher up the risk spectrum than hybrids.
About a month ago (to early) we marginally reduced our allocation to income securities and marginally increased our weightings towards stocks in the MM income portfolio. Now the portfolio sits at 55% stocks and 42.5% income securities including hybrids. We can take this up to a 70/30 split and will likely do that when we get a better handle on where dividends will land for stocks. Remember, hybrid yields are a set margin over bank bill while bank dividends are less certain. Over the last week, bank dividend estimates have been cut by 20.5% across the big four banks. ANZ by 27.7%, CBA by 13.6%, NAB by 33.2% and WBC by 32.2%.
MM likes CBA, then WBC followed by NAB & ANZ in that order
National Bank (NAB) Chart
Question 2
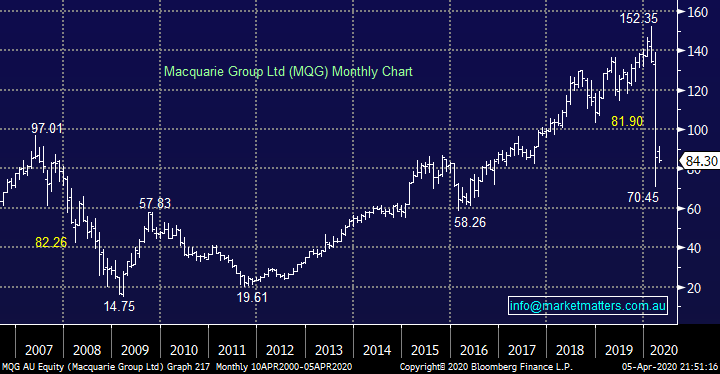
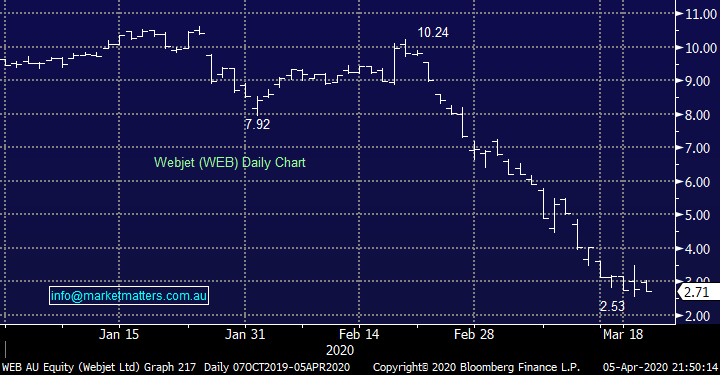
“Sub. question. Hi James and team, keep up the good work! Can we read anything into MQG's notices that it either ceases or becomes a substantial holder in anything? On 27/3 it ceased to be a substantial holder in WEB and on 30/3 it became one. Should we read this in the same way as a Director buying and selling their own stock. Getting in = good, getting out = bad, for example? Or is it just noise?” - Cheers Dave B.
Morning Dave,
Thanks for the appreciation, it’s both exciting and tough going in equity land. I feel far more information can be garnered from insiders (directors) buying / selling stocks compared to banks / institutions. Banks hold stocks for others and the moves can be for a whole number of reasons, not just outright buying and selling of a stock. In short, director buying / selling is far more important while major shareholder movements are also worth monitoring - investment bank movements I tend to glance over.
Macquarie Bank (MQG) Chart
Webjet (WEB) Chart
Question 3
“Hi James, knowing your position on APT and the BNPL stocks, let me start with a disclaimer... I am a fan of APT and over the years have enjoyed success investing in them. I would appreciate your thoughts around the recent MS and MUFG buying of APT shares. When one combines their total holdings it amounts to almost a quarter of APT shares (24% voting rights)? Is this a good thing or a bad thing - long term, short term ?” - Thanks & regards, Jan P.
Hi Jan,
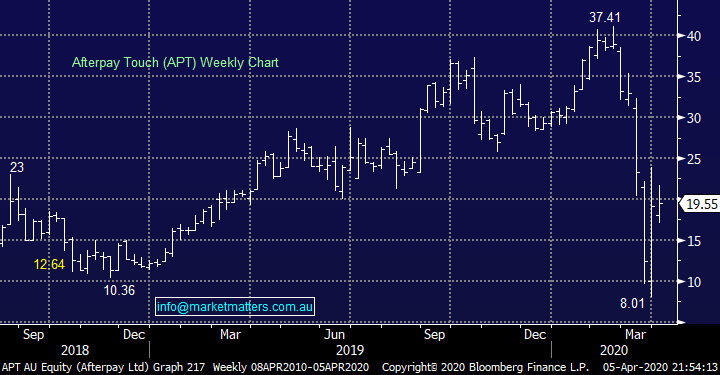
APT has enjoyed some extraordinary success since it listed in mid-June 2017 but unfortunately like much of the ASX the last few weeks have been very humbling. APT has been under pressure due to concerns that COVID-19 will cause a huge negative impact on unemployment, spending , funding of their book and finally bad debts. However if you’re a believer that the global economy will be back on track in 2021 we feel any weakness back towards $15 offers some good risk / reward value in this buy now pay later business – governments will be encouraging the public to buy when normality finally returns.
When Morgan Stanley and Mitsubishi Financial buy into APT by definition some large players have also exited, we don’t read anything into this change of ownership.
MM likes APT around $15 from a risk / reward perspective.
Afterpay Touch (APT) Chart
Question 4
“What is your view, in relation to Hybrids. Instead of buying individual what about something like Betashares HBRD. In your view, what are the Pros and Cons of using something like this?” – Thanks Julien K.
Hi Julien,
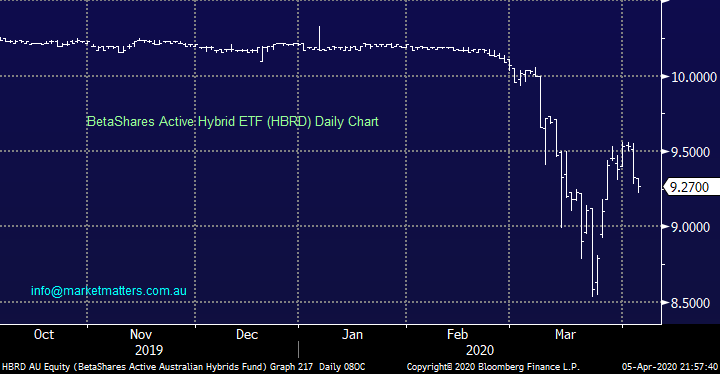
The pro is that you get a more diversified portfolio of hybrid securities that are professionally managed that have a blended maturity profile. The con is that you pay an annual fee for it, in terms of the BetaShares Hybrid Fund (HBRD) this is 0.55% per annum, it’s also important that when buying a security like this, you are cognisant of the underlying value of the fund – the Net Asset Value (NAV), and try not to pay much over it.
The Betashares website quotes this number however I believe it’s delayed by a day – maybe I’m wrong, I think we have some Betashares guys as subscribers that could correct me? The NAV of the fund on a per unit basis as at 2nd April was $9.30, however check the website to confirm.
MM remains positive on Hybrids overall & it’s a personal decision whether or not to pay for professional management or buy and hold directly
BetaShares Active Australian Hybrids Fund (HBRD) Chart
Question 5
“Hi guys, thanks for the ongoing commentary and analysis during these extraordinary times. I haven’t had the courage to buy yet. A simple question – does ‘expected income’ really reflect the expected dividends i.e. does it incorporate inevitable estimated dividend reductions?” – Thanks Simon W.
Morning Simon,
Thanks for the thumbs up, always a nice way to start the day. The expected dividend figure used in the income note sources Bloomberg consensus. Normally I would say this is a good guess given it combines all analysts’ expectations, however right now, the situation is more fluid. As mentioned above for instance, expectations for bank dividends were cut by 20% over the past week.
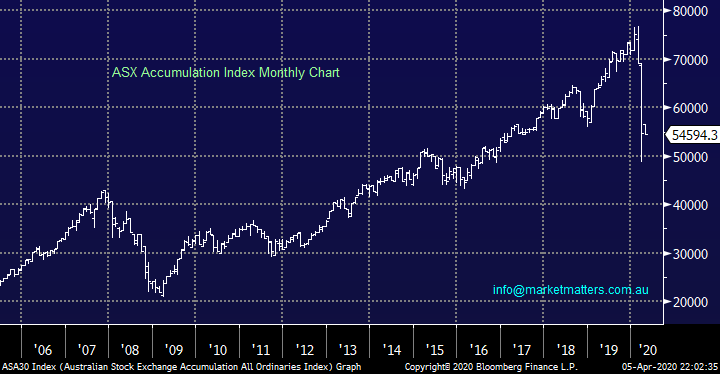
This is typical of an environment like this, where companies will be looking to strengthen their balance sheets hence dividend payout ratios are likely to fall but this theoretically should put the businesses in a far stronger position moving forward. The Australian market has been an income investors dream compared to markets like the US although they have not surprisingly produced better capital gain as earnings have more often been ploughed back into businesses to deliver growth.
The chart below illustrates the ASX Accumulation Index (if dividends were reinvested straight back into stocks) and while it’s had a major correction the trend is still up post the GFC, we feel income investors can consider accumulating stocks at current levels but we need to be patient over the next 12-months, or more, as companies are likely to retain more earnings to repaid balance sheets.
ASX Accumulation Index Chart
Question 6
“Good morning, I just want to ask you why there no correlation between oil price and share price of WPL, BPT, STO in the last couple of days. Thank you.” -Tony N.
Hi Tony,
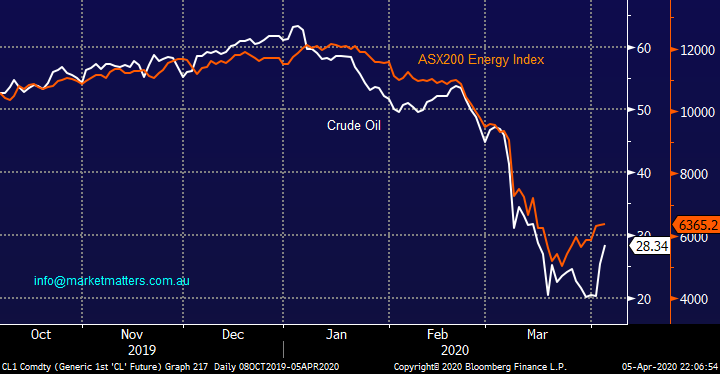
I think the below chart illustrates the correlation is still pretty good but the oil stocks have been looking for a low as they have turned up before the underlying oil price - its common price action that stocks turn ahead of their underlying fundamentals, this might be another classic case.
NB In the Weekend Report we discussed a similar situation where the VIX (volatility Index) looks unlikely to make fresh highs even if equities do again break lower.
Crude Oil v ASX200 energy Index Chart
Question 7
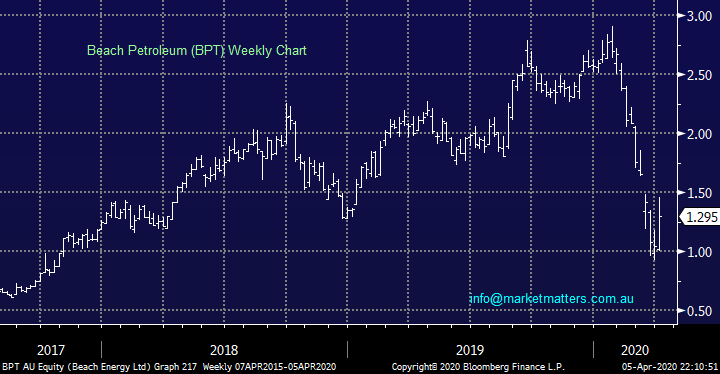
“Hi MM Team, thanks for your measured words in a worrying time, which are greatly appreciated! (1) On 31 Mar you suggested allocating weighting from BPT to STO, but for people who own STO already (but not BPT) would buying BPT on weakness be a useful move, given the likelihood of the Crude Oil price rising in due course? (2) I note some of the better margin lenders are either reducing LVRs on, or totally removing from Recommended Lists, stocks that were previously quite ok, but now have a little more debt or have other troubles – presumably this is to be expected at such a time, hence MM’s own preference now for ‘quality’?” - Regards, Gil
Morning Gil,
Thanks for more positive feedback! If we had no exposure to the Oil / Energy Sector we would be buying Santos (STO), Beach Petroleum (BPT) and BHP Group (BHP) at today’s prices, which is exactly how we are positioned.
Margin lenders are indeed flocking up the quality curve with their LVR’s as they understandably de-risk like many market players, the same thing is happening in the options market with the ASX increasing margins across the board. Worth remembering that the value of margin loans peaked just before this market rout. Indicators like that paint a contrarian message for us – i.e. it is a bullish sign.
Beach Petroleum (BPT) Chart
Question 8
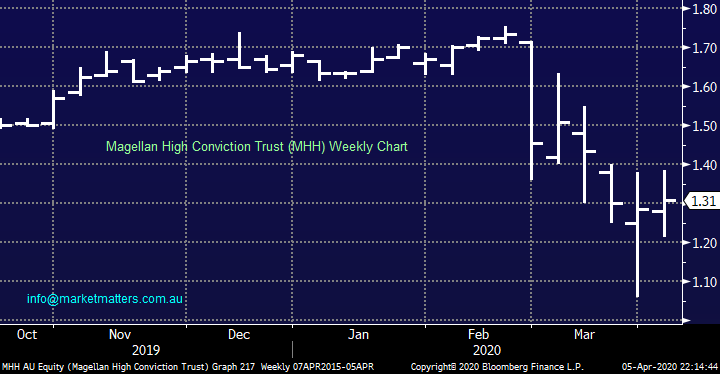
“Dear MM, I've enjoyed reading the newsletter in past weeks, particularly your bullish calls at a time when all it seems, including me, were on the brink of abandoning all hope. I was inclined to be sceptical, but the markets have validated your call. A question if I may regarding your recommendation on the hybrid CBAPF which reflects total ignorance on my part as to how hybrids work and the fact that I haven't been able to find information about it anywhere else. When you say CBAPF has two years to run, I'm wondering what the implications of holding it to maturity. Is there a fixed price that you receive or is it purely dependent on market price? And another question if I may regard MHH. I notice they've been buying their own shares and I'm wondering is this adding value to one's shareholding i.e. is it reducing the amount of shares on offer or could Magellan be simply trading their own ETFs in order to profit by selling them again later, or for some other reason? Presumably the fact that they are buying back their own ETFs suggest that they think they are good value at current prices, better maybe than the other companies they invest in? Would appreciate your thoughts on this.” - Regards, Peter E.
Morning Peter,
There’s always hope but we must remain open-minded even while MM does currently have a bullish bias towards equities.
1 – CBAPF: is a typical tier 1 bank hybrid which should be called at its first call date in 2 years’ time, however there is reason why hybrids pay more in yield than term deposits and bonds. Firstly, CBA is the safest bank and we like their debt securities, tick. Secondly, CBAPF is paying 6.92% yield to maturity which combines about $4.50 upside in price plus the running yield, tick. Thirdly, it only has 2 years to run, the shorter the time period, the less that can feasibly go wrong, tick.
That said, we need to think about what could actually go wrong in the next 2 years and what will happen. If CBA’s tier 1 equity drops below 5.125% or APRA decide that CBA is under significant financial stress, is insolvent or can’t raise money elsewhere, then these hybrid securities will convert to equity. They often call hybrids ‘bail in’ securities, if things really do deteriorate for the issuer, holders of hybrids can end up with stock. This is highly unlikely but possible, hence the premium that these securities pay. We did a deeper dive into Hybrids back in 2017 in an early income note, its old however it still has some relevance in general terms (click here)
MM remains positive on CBAPF
2 - MHH: They have an on market buy-back going on which is designed to try and close the gap between the share price and the value of the underlying portfolio. As at 31st March, the portfolio was worth $1.44 per unit which today is trading at $1.31. It’s the concept of buying $1.44 worth of stock for $1.31 – makes sense. The MHH holds Magellan’s 8-12 best global ideas in a concentrated portfolio.
Magellan High Conviction Trust (MHH) Chart
Question 9
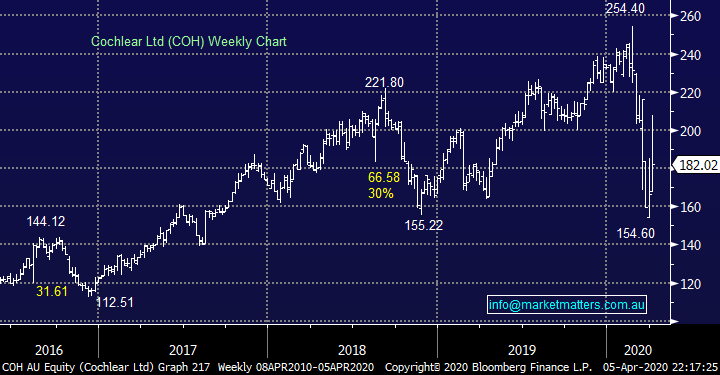
“Morning team, I bought some COH share today and I read your email and see you wrote “ A reminder for COH shareholders, the retail offer is now open with shareholders able to bid for up to $30,000 worth of new shares at $140”. Could you let me know how to do this and please do not put this to the subscriber questions, I need the answer today if possible, thanks so much” - Tony N.
Hi Tony,
Cochlear’s SPP is has been capped at just $50 million, a disappointing 5.4% of the total $930 million raising. If all 34,000 shareholders apply for the maximum $30,000 new shares in the SPP, that will total more than $1 billion in applications which will lead to an enormous scale back.
Importantly investors needed to own the shares on the 24th of March to be eligible for what looks like being a very small entitlement.
Cochlear (COH) Chart
Question 10
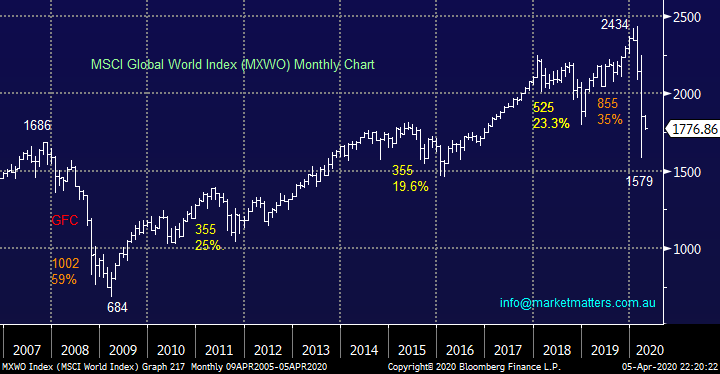
“Hi James and team, I am querying how you feel the market has likely bottomed and will basically rise from here when you state that unemployment is likely to go well over 10%. The lockdown phase will last for months, all the while strangling the economy. Have you heard of anyone even yet discussing what criteria would need to be met before easing lockdown? No sir! Basically, it would need to be a period of likely greater than 2 weeks of no new cases. Any ease up in restrictions in other countries has been rapidly followed by a sharp rise in new cases and reintroduction of restrictions. So, I'm saying that the duration of this is going to be much longer than hoped for. How well do you think the US will tolerate lockdown and the massive unemployment/illness/deaths over the next 1-2 months? This may be the dead cat bounce of all time. It's good to be optimistic but realistically there is serious pain coming over a sustained period of time with no resolution in sight. The US is likely in a few weeks to be looking like Italy/Spain do now. Not something that you bounce back from quickly no matter what stimulus is out there. Sorry to be a wet blanket but just feel that your assumptions are a bit hopeful and premature.” - All the best, Radley S.
Morning Radley,
I believe that everything you have written is on the money, I have had numerous emails from clients / subscribers querying how we could possibly be buying stocks in this environment when things will continue to get worse, but we must remember that equities historically run around 6-months ahead of the fundamentals hence if we are enjoying a “U” or “V” shaped recovery in the global economy by Q4 of this year stocks should be looking for a low right about now.
Remember China is going back to work slowly but surely about 2-months after Wuhan, the epicentre of the pandemic, went into lockdown on January 23rd - cases were first registered in November of last year. I feel these dates are encouraging for a solid recovery before next Christmas. Many people question the validity of the Chinese data, however traffic congestion shows they are back ‘at it’.
MM believes global equities are offering good value after their 35% correction.
MSCI World Index Chart
Question 11
“Hi, You mentioned in this report that it is hard to know if the bottom will be "V" "U" or :L: shaped - Could I dream that it is V or probably U and market gets back to previous levels, form a shoulder to make a substantial Head and Shoulder pattern for a major upward move in time. I viewed that the market did a lot of work, made a substantial strong base from GFC years and brought the rewards of a major Bull Market. With so much change happening in this topsy turvey world with coronavirus, climate change, low interest rates, electric cars, industry wanting new minerals and metals, oil producers selling and taking what they can for their product etc., the dream that it is a large H&S pattern could become reality. Still on deck yours now 89 yr old” – Clive B.
Hi Clive,
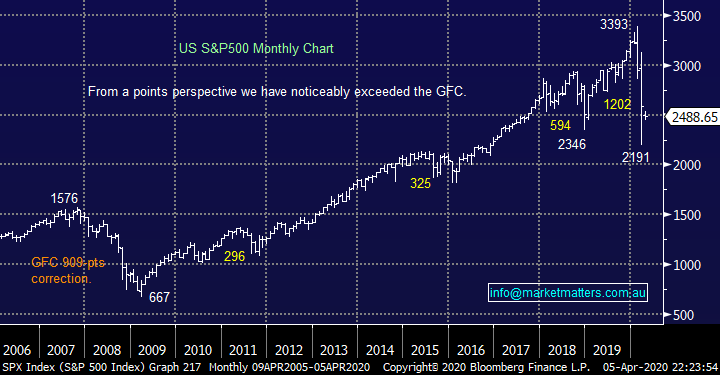
Great to hear from you again, the enthusiasm you bring with your question at 89 is simply awesome. I’m not 100% sure which “Head & Shoulders” pattern you are referring to but when I look at the US S&P500 below the COVID-19 retracement is simply in sync with the correction in 2008-9, the GFC. However, as you rightly point out the industrial backdrop is evolving at an unprecedented speed hence stock selection is vital for successful investing in the years ahead.
MM likes equities around current levels.
US S&P500 Index Chart
Question 12
“I am a relatively new member and appreciate your insights to date - thanks. I am hoping you can help with a listed note I am holding. I am currently holding around $50k in CWNHB and am wondering if you have a view on risks with this Listed Note? i.e. should I sell, realising a loss? Should I retain given your positive view on CWN medium term? Any assistance would be appreciated.” – Gabriel C.
Morning Gabriel, Welcome aboard.
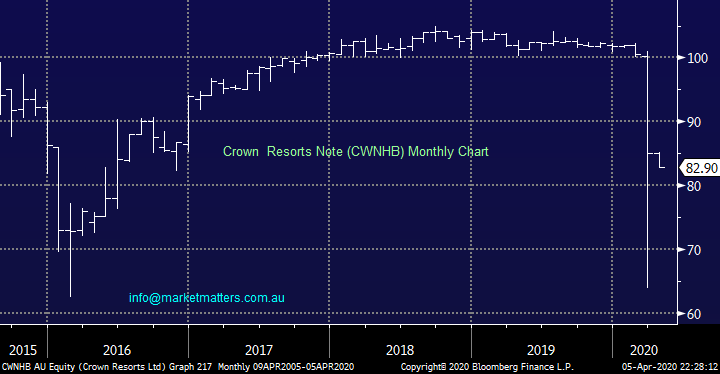
The Crown Notes are higher risk and at MM we generally have a preference for Bank Hybrids, simply because the sector is more heavily regulated. The CWNHB were issued in 2015, there’s $630m on issue and they had an initial margin of 4% over the bank bill rate. They’re a subordinated note so they won’t convert to underlying Crown shares like some notes can under extreme circumstances. They have a first optional call date in July of 2021; however, Crown don’t have to call them on this date and the legal final maturity is not until 2075. The reason why Crown would / wouldn’t redeem them next year is around the availability and cost of capital. If they could borrow more cheaply elsewhere, then they will redeem them, if they can’t, these will likely stay on issue. These are the second subordinated note Crown had on issue, the first was the CWNHA which had a margin of 5% over bank bill, and Crown redeemed these in 2018 at the first optional call date.
At a price of $82.90, the CWNHB are trading on a yield to maturity of 21%, which combines capital gains from $82.90 to $100 plus the running yield. That implies they are unlikely to be called next year. Instead, we would expect these to continue to run until there is more clarity around Crowns financial position, if it deteriorates, they will fall further, if it improves, they will rally, but only to $100. From a risk / reward perspective, these notes are now more like equity, but the upside is capped.
MM likes bank hybrids into weakness more than CWNHB, while we think that Crown Equity has more potential upside than the CWNHB when thinking about it from a risk / reward perspective.
Crown Resorts Note (CWNHB) Chart
Question 13
“Hi Team, thanks for the quality information coming through each day. Just wondering what your current thoughts are on IVE Group (IGL) and WISR Ltd (WZR) - are they part of your quality portfolio going forward? “- Kind regards Steve D.
Thanks very much Steve,
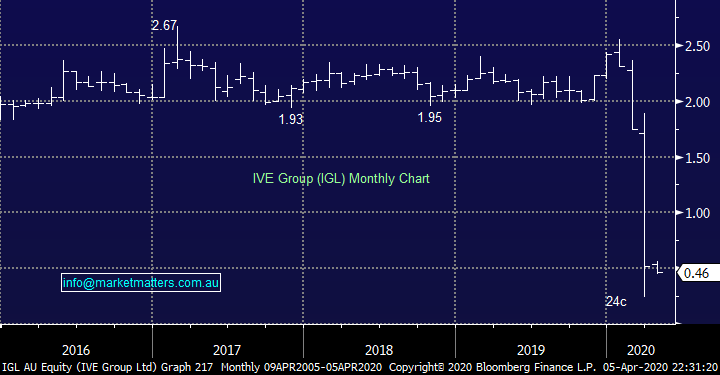
IVE Group (IGL): Debt is their issue and when a company has a high fixed cost base and falling earnings, debt can become a problem. The stock is very cheap, and we like the business in a normal environment however it is clearly now high risk. They withdrew the dividend recently which was prudent and are now bunkering down for a tough time. The time it takes for Australia to get back to work will be crucial for a business like this.
MM likes IGL however concede it’s very high risk.
WISR (WZR): This is a speculative stock that we like at current levels. While you won’t find it in MM Portfolio’s given its size, from what I understand the business is still performing well during this period and when risk appetite comes back, we would expect WZR to do well. That said, the smaller end of the market will take longer than the big end, so we wouldn’t expect an imminent turnaround in fortune.
MM currently has no interest in IGL or WZR.
IVE Group (IGL) Chart
Question 14
“Hi - when you provide instructions to sell within a portfolio, is the percentage provided as a guide based on reducing the amount based on the cost % or the current market %. thanks Steve B.
Morning Steve,
Great question which I’m surprised hasn’t been asked previously. You have actually answered correctly yourself – it’s a guide based on cost %.
Question 15
“Hi James, I’m a loyal subscriber and enjoy the perspective you and the team bring to my investing world. I'm always keen to learn. Now with that positive backdrop I have a few comments, the answers you provide will help increase my investing knowledge and skill. We are all guessing the near-term market movements but confident in the longer term that stocks will rise and outperform over the longer term. That is my focus and I assume yours too.
TCL
1) Could you explain how you set a weighting for your initial buy in generally for your portfolio changes and for this stock (TCL 4%) particularly?
2) What do you look at to arrive at a decision of when to buy a stock generally for your portfolio and for TCL in particular instance?
3) Do you at any stage come up with a valuation for a BUY or use technical analysis?
4) How do you value TCL?
When I look at TCL's 31Dec 19 financials I see:
-accumulated losses $3,733M
-goodwill and other intangible assets $26,833 (466+26367) THATS 280% of shareholders’ equity
-total borrowings $19,436M (1830+17606) equals 203% of shareholders equity (extremely High)
As my old bank manager used to say (old days when we had real bank managers) "the bank has more to lose than the owners do"
People in the know tell me that infrastructure businesses are valued differently from other businesses and TCL ranks right up there with the best businesses listed on the ASX (like CSL).
From an uneducated/inexperienced investor's viewpoint TCL doesn't look like even a passably adequate business.
It looks to me like a business in need of a substantial shareholder equity raising just as a starting point before we even look at profitability!
If you took the intangibles out the company would be trading whilst insolvent.!!!!
Just in comparison ALX another ASX listed toll road operator has:
-debt to equity of 63% (much better than TCL but still not ideal in the old bank managers lingo "less than 50%needed)
-Goodwill & Other intangibles 2438M (72% of shareholders equity)
-accum losses $222M.
If you wrote the intangibles off ALX would still be solvent.
Just on these brief metrics ALX would be less risky and a superior investment to TCL
I also must say that I have experienced a toll road business wipe out having lost substantial funds in the Brisbane Clem Seven toll road operation failure not so many years ago. It was a start-up business and inherently more risky as a result but I don't want another experience like that with TCL. In times like we have now, remaining at home with no job to attend, it does allow one more time for quality thinking and analysis which I'm trying to take advantage of here and now. I hope you realise I'm asking for a better understanding of your rational for the investment decisions your subscription service makes. I am not seeking to be critical. Quite the opposite I support and love the uniqueness of your subscription service. I am not seeking investment advice in any way. I am trying to make myself a better self-directed investor which I assume is the type of subscribers you want. Please explain where my investing logic in wrong with the case of toll road operator TCL. Thanking you in advance for your detailed reply.” - Yours faithfully Marvin C.
Morning Marvin, thanks for the question.
I want to give your question enough time and today I don’t have it. I briefly covered TCL last week below, however I thought a good way to answer this question and provide some context on our investment process more generally would be a video. I will do at some stage this week. Keep an eye out for a more in-depth review of TCL in the coming days addressing the queries you raised.
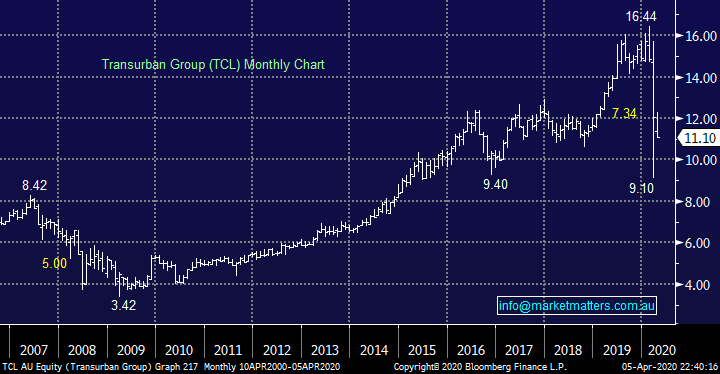
Infrastructure assets are different to another business insofar as they are very expensive to build and in the case of a toll road, they are generally operated on a concession basis over a specific period of time before the asset is passed back to Government. So, the big cost to build the asset is accounted for over the life of the concession and this leads to a large annual (non-cash) depreciation expense. This effectively reduces the E in the P/E and makes the P/E look unattractive.
While not a silver bullet either when looking for an easy valuation metric for a business like Transurban (TCL) or Sydney Airports (SYD), its arguably better to use EV / EBITDA, which looks at enterprise value (which is market capitalisation + debt - cash, in other words, the total value of the company) / Earnings before interest, tax, depreciation and amortization. SYD trades on 17x EV/EBITDA versus an average of 21x while TCL trades on 23x EV/EBITDA versus an average of 28x
Ultimately when thinking about infrastructure assets, think about the cash flow they generate, the time the asset (s) will generate it for, the predictability and likely growth of the cash flow and their ability to underpin the asset with debt funding, which is what makes an infrastructure asset stack up. The reported earnings (E) are almost always significantly lower than this, hence the high P/E multiple. Both TCL and SYD carry high debt levels at a time when revenues will be hurt, more so for Sydney Airports. On the debt side, both look okay in terms of upcoming maturities.
Regarding return on assets, you are correct in saying that it is low, however offsetting that is stability / predictability. If you look at the return on assets for SYD for instance it’s about 3%, that is then geared (with debt funding) and we get a return on invested capital somewhere around 5-6%.
MM likes TCL into current weakness.
Transurban (TCL) Chart
Question 16
“Hi James, while your focus on Covid-19 in Australia is understandable, from an investing point of view, it's what the virus does to the USA and Europe that will have most medium-term impact on Australian shares. If as I predict the USA and Europe are in virtual lockdown for the next 6 to 8 weeks and allowing another 8 to 12 weeks for people to get back to work so they can earn an income and spend their money on consumer goods, it means that these two huge markets for Chinese manufactured goods won't start buying for possible 20 weeks. While China is waiting for their sales to increase, I fear they will stop buying our raw materials until they see light at the end of their tunnel. So, buying Aussie stocks now doesn't make sense to me for at least another few weeks until we see how serious the impact of the virus is on US and European economic activity.” - Bernie M.
Morning Bernie,
This is a similar question to one earlier and indeed a point we touched on in the Weekend Report. We must all be mindful that equities usually turn ~6-months before the underlying fundamentals and don’t forget a vaccine will be found at some stage and investors want to have a decent market exposure when that headline crosses the newswires.
MM likes equities around current levels.
Coronavirus cases Globally Chart
Question 17
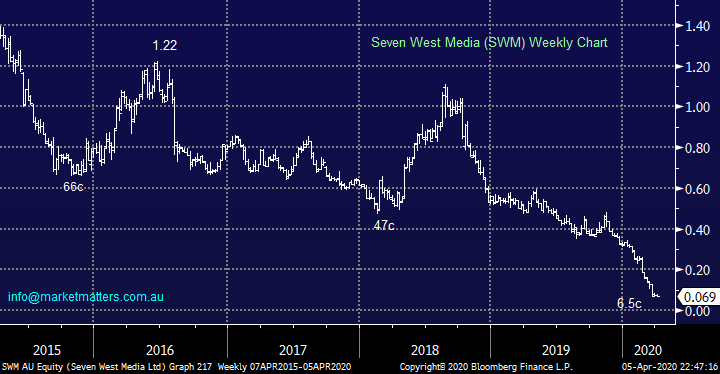
“Hi James, I trust your well. What are your thoughts on SWM – bought them at .11c” - Bakous M
Morning Bakous,
Good to hear from you. Sorry but we regard SWM as too hard, especially in today’s economic backdrop – the chart tells the tale I’m afraid.
MM has no interest in SWM.
Seven West Media (SWM) Chart
Question 18
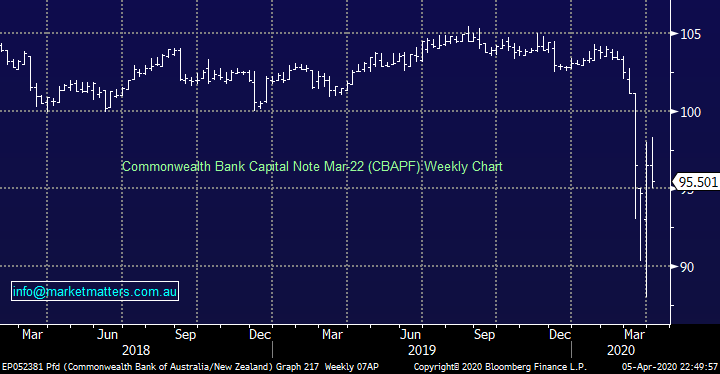
“Hi Guys, Thanks for your support during these times, hope you and your family and friends are doing ok. Subscribers Question for next week. Can you outline the potential danger for a Self-Funded Retiree investing in a bank hybrid, say CBAPF, in order to generate a bit of income when all other income has evaporated.” – Cheers Tim.
Morning Tim,
Likewise, thanks for the appreciation and positive feedback.
The CBAPF is a typical tier 1 bank hybrid which should be called at its first call date in 2 years’ time, however there is reasons why hybrids pay more in yield than term deposits and bonds. Firstly, CBA is the safest bank and we like their debt securities, tick. Secondly, CBAPF is paying 6.92% yield to maturity which combines about $4.50 upside in price plus the running yield, tick. Thirdly, it only has 2 years to run, the shorter the time period, the less that can feasibly go wrong, tick.
That said, we need to think about what could actually go wrong in the next 2 years and what will happen. If CBA’s tier 1 equity drops below 5.125% or APRA decide that CBA is under significant financial stress, is insolvent or can’t raise money elsewhere, then these hybrid securities will convert to equity. They often call hybrids ‘bail in’ securities, if things really do deteriorate for the issuer, holders of hybrids can end up with stock. This is highly unlikely but possible, hence the premium that these securities pay. We did a deeper dive into Hybrids back in 2017 in an early income note, its old however it still has some relevance in general terms (click here)
MM remains positive on CBAPF
Commonwealth Bank Note (CBAPF) Chart
Overnight Market Matters Wrap
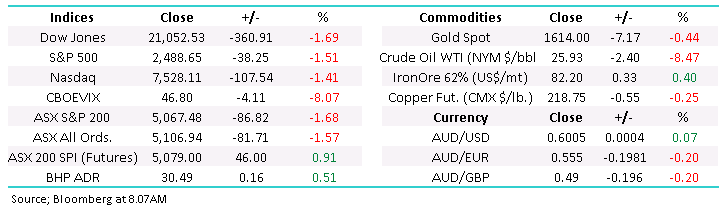
- US investors witnessed its 3 key indices end their sessions off over 1.5% as the expected job report data posted a decline of 701k in March, levels not seen since 2009, adding the unemployment tally to 4.4%.
- Over to the European front, markets also closed 1% weaker following manufacturing PMI data, which slumped to an all- time low level of 29.7 for March vs 51.6 in February as the coronavirus related economic shutdown bites.
- Crude oil rallied ~13% last Friday on the hopes of an agreement to be made with US, Russia and the Saudi’s however this was quashed yesterday when the meeting scheduled for tonight was delayed.
- BHP is expected to outperform the broader market after ending its session up an equivalent of 0.51% from Australia’s previous close.
- The June SPI Futures is indicating the ASX 200 to open 37 points higher, testing the 5100 level this morning.
Have a great day!
James & the Market Matters Team
Disclosure
Market Matters may hold stocks mentioned in this report. Subscribers can view a full list of holdings on the website by clicking here. Positions are updated each Friday, or after the session when positions are traded.
Disclaimer
All figures contained from sources believed to be accurate. All prices stated are based on the last close price at the time of writing unless otherwise noted. Market Matters does not make any representation of warranty as to the accuracy of the figures or prices and disclaims any liability resulting from any inaccuracy.
Reports and other documents published on this website and email (‘Reports’) are authored by Market Matters and the reports represent the views of Market Matters. The Market Matters Report is based on technical analysis of companies, commodities and the market in general. Technical analysis focuses on interpreting charts and other data to determine what the market sentiment about a particular financial product is, or will be. Unlike fundamental analysis, it does not involve a detailed review of the company’s financial position.
The Reports contain general, as opposed to personal, advice. That means they are prepared for multiple distributions without consideration of your investment objectives, financial situation and needs (‘Personal Circumstances’). Accordingly, any advice given is not a recommendation that a particular course of action is suitable for you and the advice is therefore not to be acted on as investment advice. You must assess whether or not any advice is appropriate for your Personal Circumstances before making any investment decisions. You can either make this assessment yourself, or if you require a personal recommendation, you can seek the assistance of a financial advisor. Market Matters or its author(s) accepts no responsibility for any losses or damages resulting from decisions made from or because of information within this publication. Investing and trading in financial products are always risky, so you should do your own research before buying or selling a financial product.
The Reports are published by Market Matters in good faith based on the facts known to it at the time of their preparation and do not purport to contain all relevant information with respect to the financial products to which they relate. Although the Reports are based on information obtained from sources believed to be reliable, Market Matters does not make any representation or warranty that they are accurate, complete or up to date and Market Matters accepts no obligation to correct or update the information or opinions in the Reports. Market Matters may publish content sourced from external content providers.
If you rely on a Report, you do so at your own risk. Past performance is not an indication of future performance. Any projections are estimates only and may not be realised in the future. Except to the extent that liability under any law cannot be excluded, Market Matters disclaims liability for all loss or damage arising as a result of any opinion, advice, recommendation, representation or information expressly or impliedly published in or in relation to this report notwithstanding any error or omission including negligence.