Subscribers questions (BBOZ, VUK, DEG, NAB, FMG, RHC, QBE, IVC, SUL, SPT, TLS, OVH, AVH, MXWO, TNE, QQQ US)
Fridays aggressive 5% decline by the ASX200 has probably got many investors jittery as we enter the infamous month of May, especially as Donald Trump’s banging his anti-China drum as the November US election approaches, it’s now only 6-months away. The unprecedented economic fallout from the COVID-19 is going to be tricky yet fascinating time for investors, let’s hope we also don’t have to navigate a global trade war as Donald Trump attempts every trick in the book in an effort to avoid defeat on November 3rd .
Over the weekend we heard Berkshire Hathaway’s legendary investor Warren Buffets thoughts around on COVID-19, an overall mixed message in my humble opinion:
1 – The Oracle of Omaha doesn’t believe COVID-19 will stop the US economic engine but he did dump his multi-billion position is US airlines - like us he must feel it could be years until people are flying overseas in the same manner as just last year.
2 – He described dealing with the pandemic as “quite an experiment” with an “extraordinary wide” range of possible economic outcomes – never has there been a more important time to remain both flexible and open-minded.
3 – He reported an almost $5bn loss on stock and investments courtesy of the market’s aggressive pullback while their cash level rose 9.3% exceeding $210bn as they keep looking for value opportunities.
So like ourselves Mr Buffett sees no risk / reward value in holding airlines as the sector comes to grips with an enormous structural change over the months and years to come, this will obviously have a flow on impact through the whole tourism sector. What catches my eye was Berkshire were busy dumping airlines not chasing bargains when the market crashed in March, a different scenario to the GFC although everything did happen much faster.
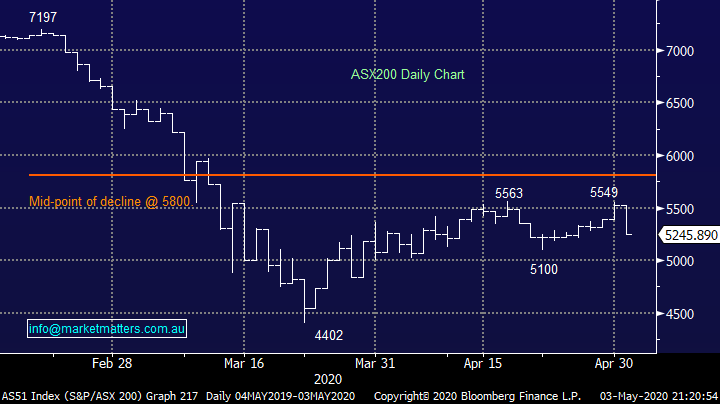
MM is in “buy mode” with our ideal short-term buy area around 3% lower.
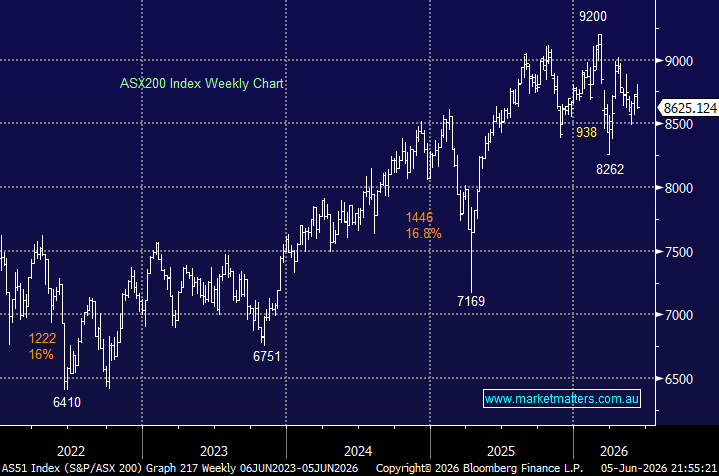
ASX200 Index Chart
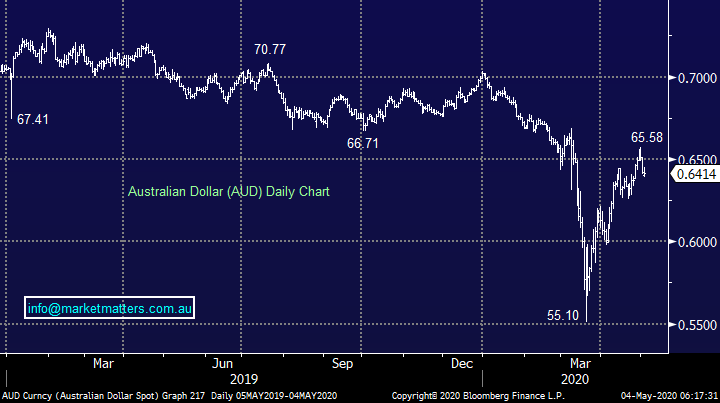
Over recent weeks MM has been monitoring the $A carefully as it is been an excellent leading indicator for stocks, alas this correlation diminished last week as both fell together, not the currency first. At this stage the “little Aussie battler” is looking very similar to US stocks with an ideal support level coming in around 63c, this potentially may coincide with our optimum index buy area for stocks.
Short-term we like the $A around 63c.
NB A strong $A, like copper, is often an excellent indicator for anticipated global economic strength which by definition should translate to a positive influence on stocks.
The Australian Dollar ($A) Chart
Thanks everybody for another big number of questions this morning, again please excuse the brevity at times but please keep them coming, we love having engaged subscribers.
Question 1
“What are your thoughts on ETF's? I have never bought them but I'm thinking if the ASX200 and ASX300 are low at the moment when there is a recovery then the fund prices should go up. Is this a correct way to think? I would be looking at VAS, IOZ, STW & possibly SWTZ for dividends. Any advice appreciated.” – Russell.
Hi Russell,
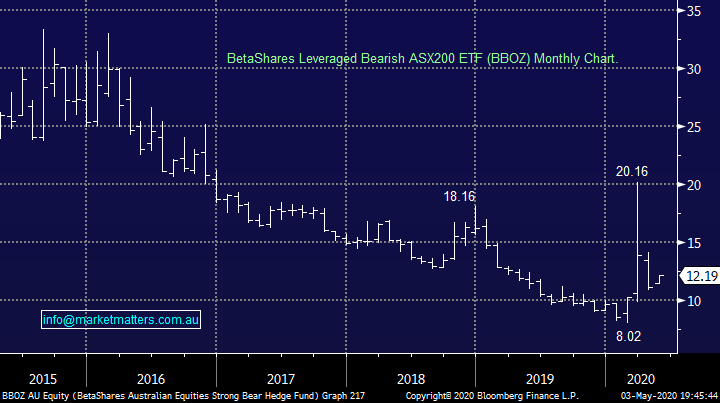
I believe like a lot of financial instruments ETF’s have their place at the correct time, however not all ETF’s are the same. We prefer the more vanilla ETFs that allow us easy exposure to a prevailing view e.g. we have used the bearish BBOZ ETF at times to hedge our Growth Portfolio, it basically doubled in March which would have cushioned a portfolios overall paper loss during the recent crash. However as can be seen on the chart below it’s all about timing as the ETF has since fallen by more than 40% as stocks commenced their recovery.
Your view is basically on point, the first 3 ETF’s you mentioned are billion dollar ETF’s and will basically track the index and hence by definition they should rally if the ASX does indeed maintain its long-term bullish trend. However, the SWTZ is only a $63m ETF that looks to actively manage money in search of yield, it also has a higher fee structure. As an alternative we would also throw our hat in the ring here with our MM Income SMA and of curse depending time and available funds this is an area that subscribers might like to consider – click here for more information.
MM is a believer in ETF’s but they need to be individually assessed.
BetaShares Leveraged Bearish ASX200 ETF (BBOZ) Chart
Question 2
“Hi there, I am new to investing and have been enjoying reading your daily articles. I have been trying to put together a diverse portfolio as a long-term investment to buy over the next few weeks that will withstand the current climate. I was just wondering what you think. MFG MQG ALL CKF JBH WES COH BHP MAH SCG CPU GMG NEA QUAL CBA EOS AVH SOL PAR COL FMG” - Cheers Nick.
Morning Nick,
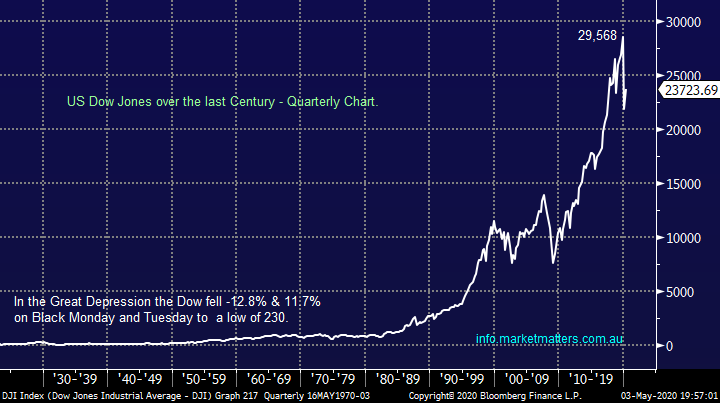
Obviously a huge volume of stocks which should perform if the market maintains its century old bull market, for the record after the huge post-GFC appreciation we remain bullish but can see some multi-year choppy price action similar to 2000-2010 hence stock selection is very important. I have segregated the list into 3 simple groups below:
Very keen: MQG, ALL, COH, BHP and CBA.
Keen: MFG, JBH, WES, GMG, QUAL, AVH, SOL and PAR.
Ok: CKF, MAH, SCG, CPU, NEA, EOS and COL.
MM remains bullish equities long-term.
US Dow Jones Chart
Question 3
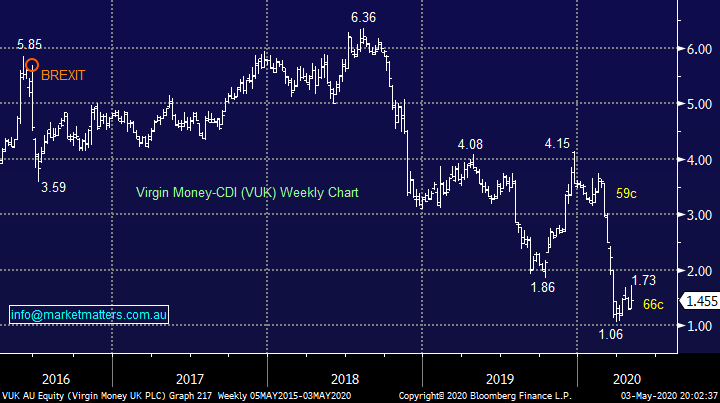
“Hi Edward, I often read in James's report that he used the term 'fresh lows'....what exactly does that mean? Is it a new low for a stock say VUK reached the lowest price of $1.07 in March 2020 and is trading now at 1.395. Fresh lows means lower than 1.07 or lower than 1.395? @ -
Regards Beng.
Hi Beng,
Usually such comments will be accompanied by qualifiers like “fresh lows for 2020, fresh recent lows or fresh all-time lows”. If we have missed the qualifier off in an area of specific interest to you, I’m sorry. With regard to VUK we are still looking at below $1.06 before we would consider an aggressive play, no need to be a hero here in our opinion, this falling knife still has momentum when we look back towards the 2018 highs.
Virgin Money (VUK) Chart
Question 4
Last week’s question 17:Hi James Wondering if you are familiar with this note offer - Alpha Point Securities - Unsecured Notes I Offer ($3m). It brings to my mind if it sounds too good to be true........Paying 18% you thoughts would be appreciated” - Thanks Pauline B.
“Hi James, Thanks for the reply on this offer. I have attached the deed document in question concerning Alpha Point Securities” - Regards Pauline B.
As a follow up to a question last week, Pauline sent me the offer document to review, and while I didn’t read it entirely, I believe I got the gist.
- Company A raises $3m via an unsecured note paying 18% per annum
- Company A lends the funds to company B, a related company
- Company A’s sole asset is a loan to company B
- Note holders are lending to company A, however, have no security over assets or either company
- Company B uses those funds to trade stocks, derivatives, etc.
- Company B needs to have a real crack, because they need to pay at least 18% interest to company A plus make enough money to make this convoluted structure worthwhile – call it another 15%.
- So, Company B is trading on borrowed money, leveraging that borrowed money needing a return of at least 33% per annum.
- If things go well, the investment returns of Company B will look very good, and they will use these returns to try and attract outside capital, remembering that 18% interest will not be shown here.
- However, if they fail in this high risk strategy, Company B has no funds to pay Company A, company A has no assets, there are no director guarantees, there is no security, hence the company would most likely be wound up, leaving unsecured note holders with a worthless piece of paper.
The promoters here have good upside potential with zero downside, the note holders are the ones that wear that for the rubbery promise of 18%.
Question 5
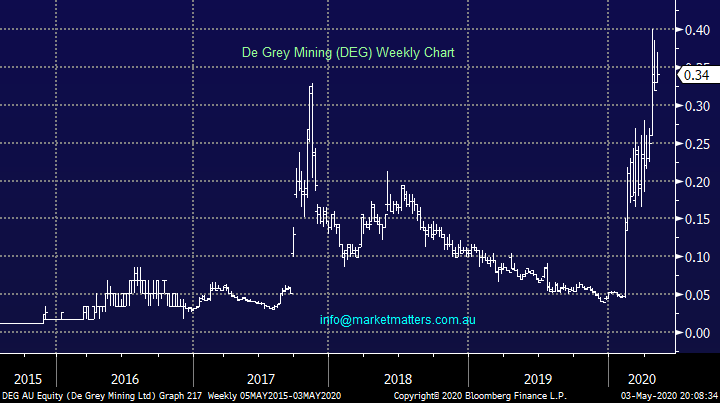
“Hello, You referred to NAB and COH and with their capital raising and the unfair treatment given to retail shareholders.... at least the retail shareholders were allowed to participate. This compares to DEG an exciting gold exploration company with major strikes occurring in the Pilbara in WA where retail shareholders were completely excluded from the very recent significant capital raising... an absolute disgrace. What are your views on this?” - David T., A shareholder in DEG through my super fund.
Hi David,
I am 100% sympathetic to your thoughts and feelings, I’m not sure of the details of this $365m companies cap raising but I do indeed get very frustrated around the implementation of the vast majority of raisings which give little to no consideration to supporting shareholders.
However at least the stocks rallying strongly for you!
De Grey Mining (DEG) Chart
Question 6
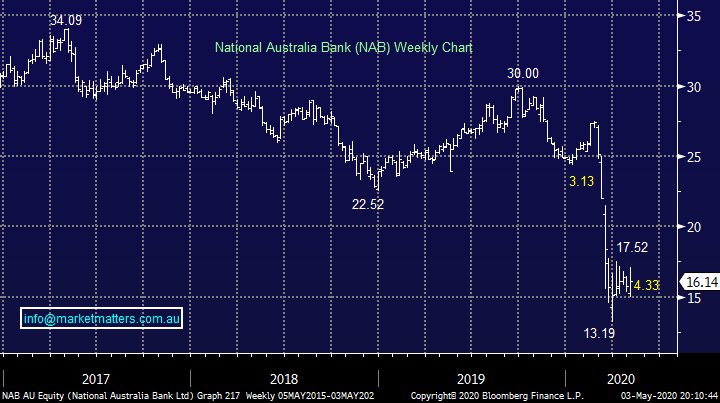
“Thanks for all your detailed commentary on the market and individual stocks. Hoping you can address a question I have regarding the banks in general. NAB has cut their dividend to 30 cents this week and I would expect the other banks to follow suit shortly. Could you please give me your take on whether you believe this cut is a short term and when you believe the dividends will return to their current levels or close too. Thanks again.” – Neil P.
Hi Neil,
The Australian Banks and their dividends have endured a tough time on many fronts with the current dividend cuts a direct result of bad debt provisioning for the impacts of COVID-19. Westpac the latest this morning to defer their dividend. It’s hard to know what the 2H dividends will look like, this will be dependent on how the virus plays out, however over time conditions will normalise and dividends will revert back to normal levels.
With regard to ANZ and WBC who have deferred their dividend, ANZ is most at risk of paying nothing given their capital levels, while WBC spoke this morning about selling businesses, they have a better chance of declaring an interim dividend when more clarity emerges here. CBA & NAB are now the highest capitalised banks.
National Australia Bank (NAB) Chart
Question 7
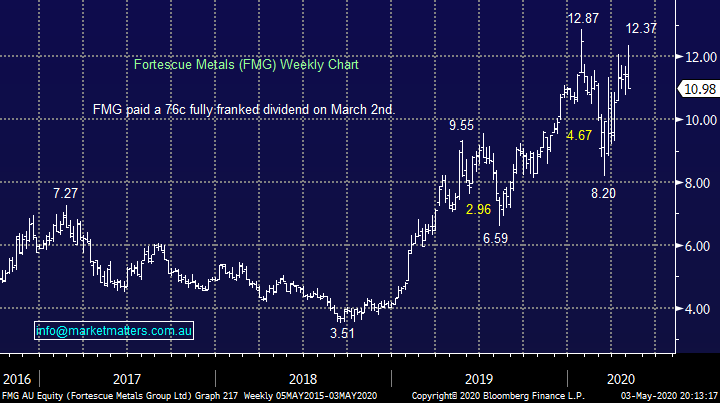
“I have a question about FMG, do you see further upside in this stock?” - Thanks Andrew B.
Hi Andrew,
FMG has been a significant outperformer in 2020 and its one of our misses, we were too fussy when it approached $8. However, if we had taken a large position at these lower levels, we would potentially have taken part profit ~$11.50 – it’s hard to imagine it roaring through $13 unless iron ore prices rally more than we anticipate. We like FMG as a business but feel it’s a bit rich compared to other stocks in the Australian mining sector however it’s a volatile beast and back under $10, MM will again be considering a purchase.
MM is neutral FMG at current levels.
Fortescue Metals (FMG) Chart
Question 8
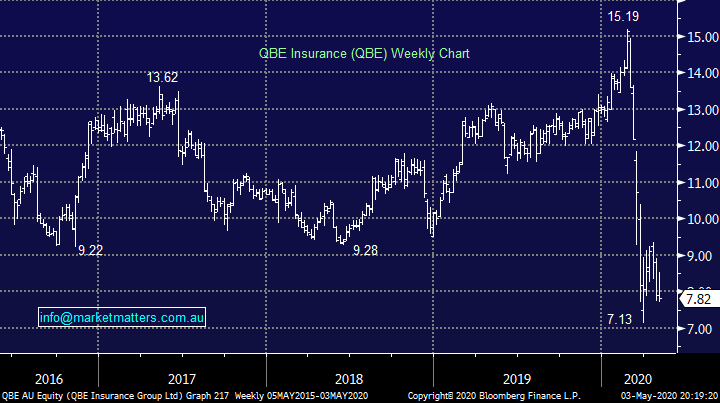
“Hi, you may have covered this and I just missed it, but what were are MM's thoughts on this SPP at a maximum of $56.00?” - Regards, James D.
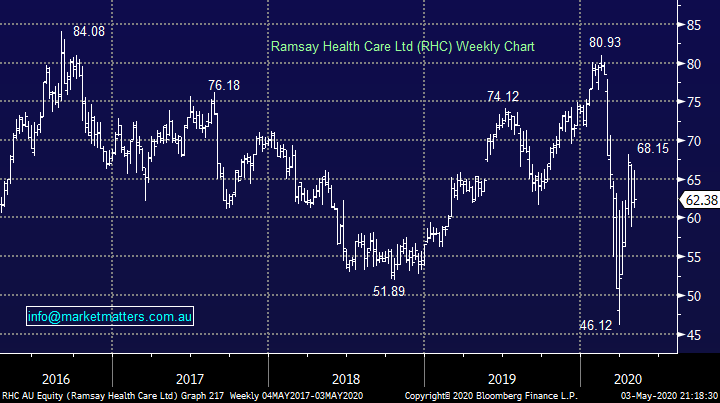
“Should I be buying shares in Ramsay Health capital raise?” – Dale C.
“Hi James, Thanks as always for your terrific insights into the market. Tough choices looming for many of us as to where to put our spare cash ie back into stocks that we currently already hold (via Capital raisings) or into other opportunities on the market which we currently don’t hold…So I wonder whether you could make specific comment on:
1 -Which raisings do you judge to be worth participating in.
2 -Could you please rank them in order of appeal ...
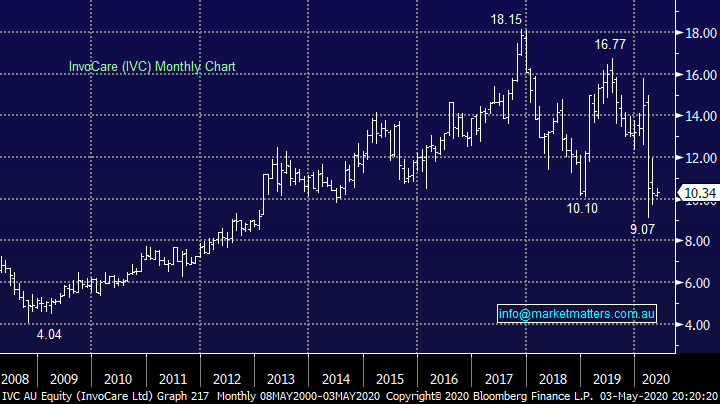
I am specifically interested in QBE, NAB, IVC and RHC ...but if you had time readers may also be interested in the others currently also raising capital” - Many Thanks Don H.
“G’Day again, after reading the Morning Report I am now wondering if I should have anything from NAB about the SPP. Can you tell me when it closes please?” – Waz.
Obviously, a number of questions here so I have grouped together.
There are a heap of equity raises happening at the moment with attached Share purchase Plans (SPPs) for retail investors. The SPP generally allows holders at a set date to apply for up to $30,000 worth of shares at the lower of the institutional placement price , or a calculation based on a 2%discount to the 5 day volume weighted average price leading up to the close of the offer. i.e. of the offer opens today and closes on May 22, if the average price of the shares over the 5 days to 22nd May is lower than the placement price, retail shareholders will get to buy shares at a lower price. This is protection mechanism for retail holders. Below we’ve set out the current SPP’s we have interest in / or have been involved in and what our current view is. This is not an exhaustive list.
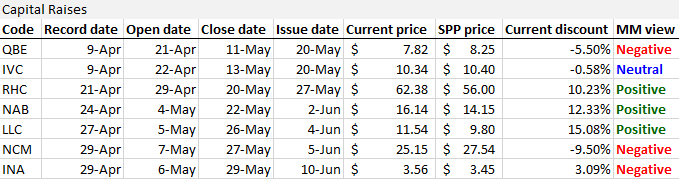
Qube Logistics (QUB): QUB have rolled out a different structure, being a entitlement issue rather than a Share Purchase Plan. For every 6.35 shares owned, retail shareholders can buy 1 new share at $1.95 versus last close of $2.21, however when taking into consideration dilution, the correct price to look at is $2.17. The raise price of $1.95 is a 11.8% discount. The retail offer opens 7th May, closed 21st May with new shares allotted on 28th May. Unlike an SPP, there is no reduction of offer price if the share price dips below the placement price. We did bid into the institutional shortfall book late last week, and the offer was oversubscribed - we did not get any stock. We are positive on this raise, the bulk of which is being used to support growth.
Ramsay Healthcare Ltd (RHC) Chart
QBE Insurance Ltd (QBE) Chart
InvoCare (IVC) Chart
Question 9
“Hello James and team, like your work. My question relates to Portfolio Management. My portfolio goes back 18 years. It contains the four banks which I have added to progressively over the years and they now account for 50% plus of my portfolio. Three of the four are currently down between 30 - 40% on paper, something I would never have believed could happen. If I take into account the substantial amount of Dividends accumulated over the years, I would actually be way in the positive, and then there is franking credits also. Is this a naive / simplistic way of looking at things, or is there some kind of "formula" for including dividends / franking credits into a portfolio? Re Thin Lizzy, if you haven't seen the film A Knights Tale with Heath Ledger you must watch it - they use that song. There is no need to print this email just a reply would do if you like.” - Cheers, Mick H.
Hi Mick,
Thanks for the thumbs up, I will make a point of watching the film and have used your question because it indeed offers definite value to our subscribers. Just a quick reminder to all that at Market Matters we offer general advice rather than personal advice, so comments here are general in nature.
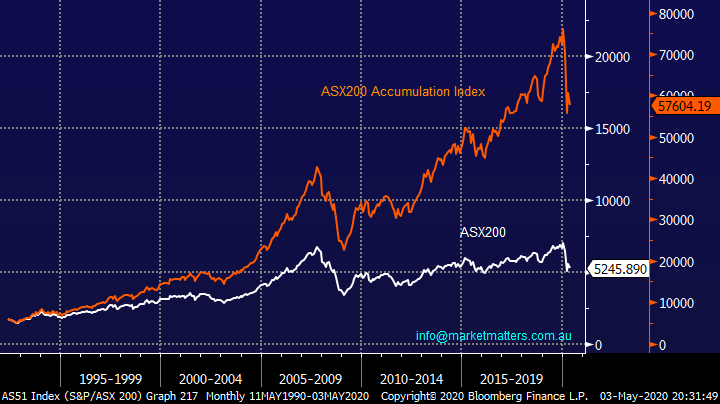
The below chart shows the comparison of the ASX and its Accumulation Index i.e. when all paid dividends are reinvested once they’re paid – a significant reflection on the impressive yield the ASX has paid over the years. Obviously, franking credits are harder to apply because they’re usefulness varies between different individuals.
If we are correct and the Value Index is set to recapture part of its underperformance compared to Growth over the last decade just when things look their worse the Banking Sector might finally put in a few good years.
ASX200 & ASX200 Accumulation Index Chart
Question 10
“Hello, I am a new subscriber and enjoy reading your updates. Can I ask what is your ‘benchmark’ as referred to below?
The Income Portfolio added +1.99% for the week with strong performances by Super Retail Group (SUL) which added +11.88% along with the Bond Fund NBI which added +5.81%. Performance for the current financial year is -10.75% versus its absolute return benchmark of +3.93%. Since inception, the portfolio has added +2.84% vs. the benchmark of +14.85%.
Thank You” – Dave B.
Hi Dave,
Welcome on board! The absolute return benchmark for that portfolio is RBA cash rate plus 4%.
Super Retail Group (SUL) Chart

Question 11
“Hi James. Thanks for your very interesting and informative emails. Two questions: 1. Do you have an opinion on Splitit Payments Ltd SPT and do they have the potential to be the next Afterpay? 2. Will the holders of oil and gas stocks whose production is not tied to long-term fixed-price contracts need to sell before the prophesies described in this article come true?” https://www.firstlinks.com.au/oil-the-storm-before-the-really-big-storm?utm_source=Website+Subscribers&utm_campaign=3471e14b3f-EMAIL_CAMPAIGN_2020_04_24_02_14&utm_medium=email&utm_term=0_953154ac75-3471e14b3f-83918333 - Thanks Bernie M.
Hi Bernie,
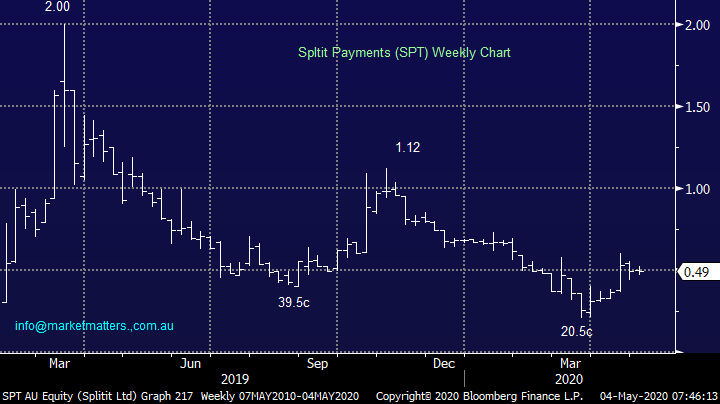
New York based Splitit Payments (SPT) has been a clear underperformer in the BNPL space but at the end of last month it delivered record growth despite the COVID-19 pandemic. Transactions for the first quarter of 2020 were up over +150% compared to 2019, that’s impressive even if it’s off a relatively low base.
Technically we could be buyers with stops below 40c.
NB BNPL refers to buy now pay later.
Splitit Payments (SPT) Chart
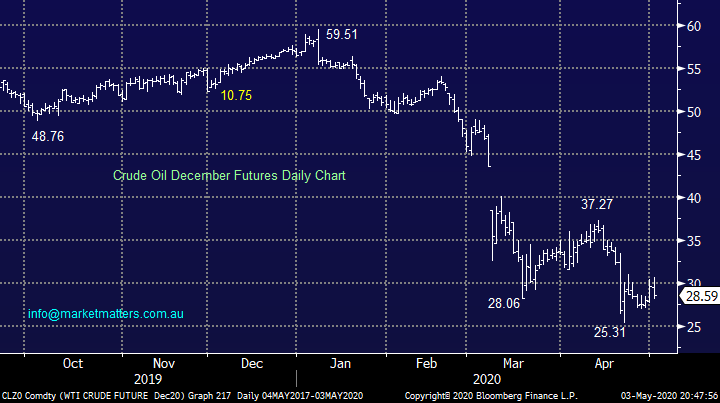
Oil will undoubtedly become a survival of the fittest scenario with many stocks and countries suffering badly, that’s inevitable when a commodity falls by more than 50% - forget the spot futures trading negative that’s an expiry anomaly which may happen again but should not be the main focus of investors. Current prices are unsustainable and there will be casualties which may include the US Shale industry, either way prices will be higher in a few years’ time and quality operators will be in a strong position.
Last week Shell cuts its dividend for the first time since World War 2 as its bunkers down to solidify itself for the unprecedented uncertainty of COVID-19 and the subsequent demand issues for crude oil. However, in our opinion companies like Shell with financial resilience and liquidity represent great value after more than halving in price.
MM likes quality oil stocks into current significant weakness.
December Crude Oil Futures Chart
Question 12
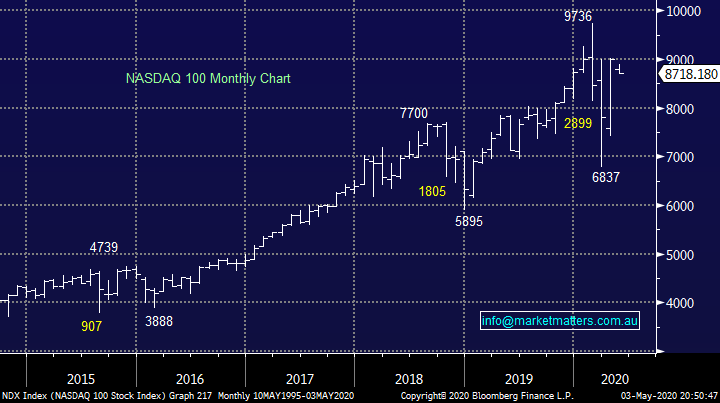
“Hi Guys, Questions for Monday. I’m Struggling to get my head around the NASDAQ/S&P 500 being only 10% below the highs prior to the mid-march panic selling. Surely the economic challenges to come mean too much unrealistic optimism is built into prices right now? What am I missing here?” -
Regards, Scott D.
Hi Scott,
I have to agree 100% on the surface however there is the liquidity issue as governments and central banks attempt to revive their respective economies. We envisage a push – pull style market as investors swing between optimism and pessimism around how effective these measures will be. I agree with you short-term; equity markets need a rest they have got ahead of themselves. Interestingly equities are pointing to a “V-shaped” recovery whereas bonds and commodities are not convinced, the later are usually a better gauge but they don’t benefit as stocks do from the relative valuation tailwind of zero interest rates making it an imperfect science to compare too directly.
MM is bullish equities through 2020 / 2021.
US NASDAQ 100 Chart
Question 13
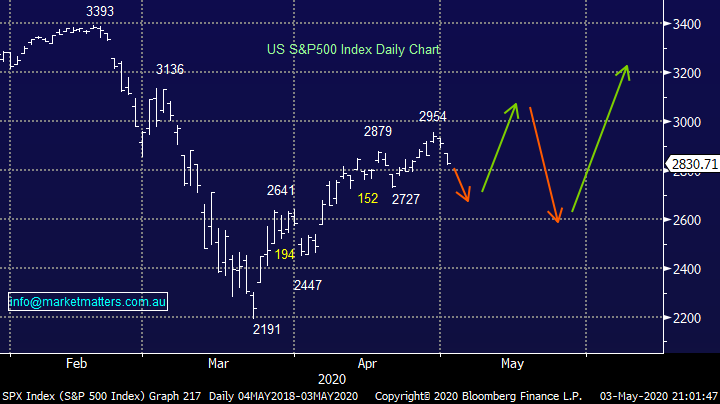
“James, I know you are generally bullish, but with markets now having had a fair bounce, will you turn to profit taking, or do you think this rise can continue until, like the NASDAQ we hit our highs again? Also, what has happened with TLS, and the current lack of love? Final point, I also notice that in recent days, the stocks that held up best during the recent market volatility, such as RMD, FPH, CSL, EVN, XRO, BRG, SKI all pretty solid during the fear, have seen selling as people appear to shift into the high risk, virus affected stocks - WEB, QAN, CCP, ABC, ALL, BLD and oil stocks .... fundamentals seemingly giving way to a quick grab for profits from a bounce. But surely, with the 'worst recession since the great depression' still ahead of us, this is a short term play? Should we sell our oil, gambling, travel and building stocks into the current strong buying?” – thanks Charlie N.
Morning Charlie,
The chart below shows how we currently feel equities will evolve through 2020 hence we are advocates of buying weakness and selling strength depending on your propensity for activity. Unfortunately I do believe it will take a lot for the ASX200 to again scale the 7000 area, we have a struggling Banking Sector compared to the NASDAQ who has the likes of Amazon (AMZN US) and Microsoft (MSFT US) simply booming.
You may have written your question before our Weekend Report, we do believe like the index as a whole the markets appetite for risk and stocks in general will swing significantly through 2020. If we are correct with our path illustrated below then the time to switch back to quality stocks is into the next highs, potentially in May, or June.
S&P500 Index Chart
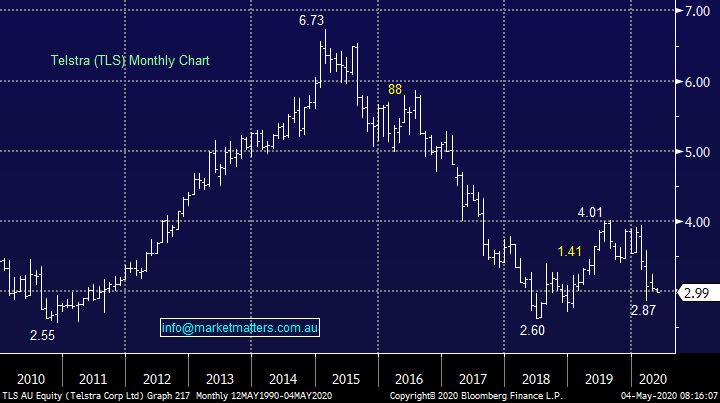
Telstra (TLS) is suffering from a lack of interest more than a lack of love in my opinion, if we see a decline back towards $2.50 we will reconsider our attitude towards the giant Telco.
MM is neutral TLS at current levels.
Telstra (TLS) Chart
Question 14
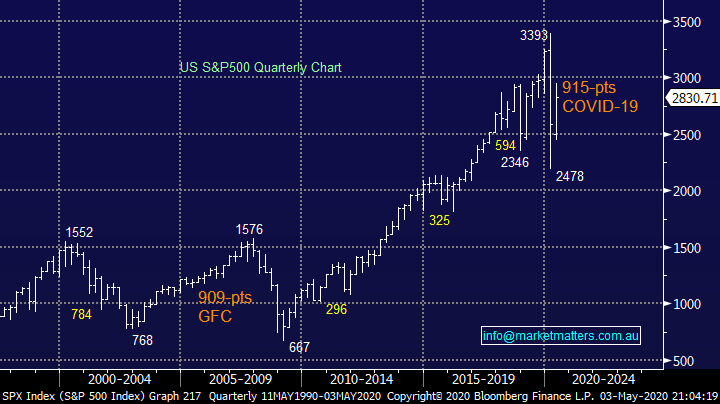
“Hi Team, I am trying to understand the definition of short, medium and long term for you. You mentioned them a lot in your daily updates. Could you please explain what the duration for each of them?” - Thank you, Dylan.
Hi Dylan,
There is by definition some grey / overlap here, especially in today’s market when everything is happening so much faster, but our best guide is:
Short-term: over the next 1 - 4 weeks.
Medium-term: over the next 1 - 6 months.
Long term: over the next 6 months plus
e.g. MM is bullish the US S&P500 long-term initially targeting ~3500.
US S&P500 Index Chart
Question 15
“Dear James, I'm just one of your 'quiet' subscribers. At this time, I'm sorry to say, that upon reading your latest, the Weekend Report (below), that your assessment of the current situation is incorrect. There are many facts to explain my assertion, but I will say only one thing: you and your team are too young to fully grasp the situation we are finding ourselves in. There will not be a quick exit and recovery from this; almost all countries in the world have managed to destroy their futures within just a few short months. Rebuilding and recovery can only come from workers, not from governments and the hundreds of millions all around the world who lost their businesses, their jobs, will not have the funds to meaningfully help the world and its economies to come out of this disaster. Also, when the U.S. market is running on its high, with valuations that just beggar beliefs; and with our market is overvalued too - I wonder from where any upswing would come from? There are and will be pockets of gold around but one will have to be incredibly careful to pick the few that will make it and prosper. Almost like being in a minefield: one wrong step and all blows up. Please feel free to disregard the above as sad rantings of an investor with around forty years of experience; I don't mind.” - Wishing you all the very best. Andrew D.
Hi Andrew,
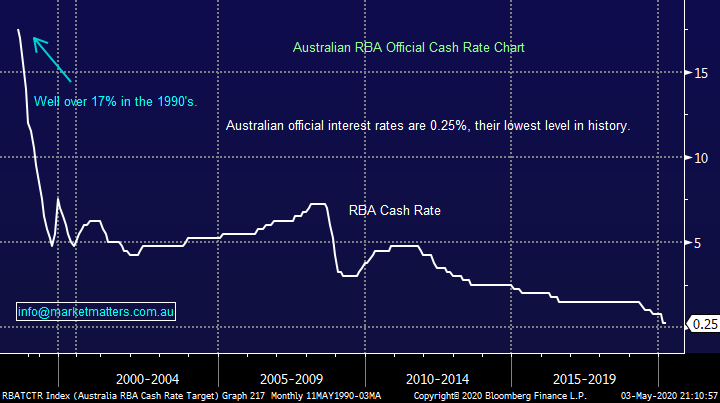
As the saying goes this is by definition what makes a market, I’m sure you don’t mind me saying I truly hope you’re wrong. Time will obviously tell but our opinion is that many stocks / sectors are not overvalued with interest rates around zero although I do believe that life as we knew it will be different in the years ahead, this will both positively and negatively impact many sectors of business and industry, it’s our job at MM to navigate the minefields and identify the gems of opportunity.
The other important concept here is that the stock market is not the economy, small business is, stock market listed entities have better access to capital etc. to rise through this storm. I’m obviously a small business owner, I employ staff, I have bills to pay, I spend more money when I feel better, less when I feel worse. My experience to date is that Government assistance has plugged the gap for now however focus now turns to the duration of shutdown and how consumers emerge out the other side. I’m an optimist and I think being an optimist over the course of time has been the correct stance to have.
Australian RBA Official Cash Rate Chart
Question 16
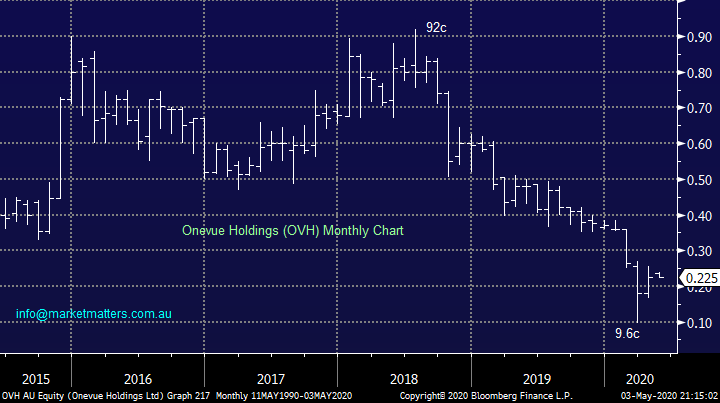
“Outstanding Sunday note. Always a must read. I agree with your portfolio calls over the last month. Question please - OVH:ASX put out last week it's Quarterly, with net inflows +135% yoy. It’s now on Fwd PE of 9x and a 13.6% grossed up yield (committed to 2.19c div at AGM), aiming to also buy back 10% of its stock, with insiders owning 20%. With the AFR reporting Friday, Sargon has a buyer, & OVH Madison sale on track, facts seem to have changed positively. OVH could now be $28m net cash (none restricted) for $60m mkt cap, plus growing. Any view please? Comps NWL/HUB are on a much higher PE multiple of 42x. Very happy subscriber.” - Rod F.
Hi Rod,
Thanks for the kind words, I’ve only really looked at this $60m wealth management business briefly given it’s not an area of the market we often venture into. However for the aggressive amongst us from a risk / reward respective we like OVH around 20c with stops below 15c.
Onevue Holdings (OVH) Chart
Question 17
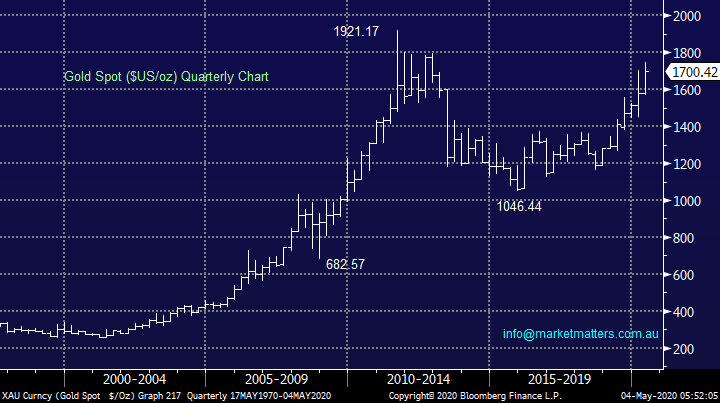
“What is MM’s current view on gold? Time to buy or run? And if buy, are ETFs the way to go or gold producers such as SAR and EVN? Thanks for the honesty of your reports.” - C. Gallus
Hi There,
Gold’s had a great few years although choosing the winners in the local market has been a tougher job even while the precious metal is at all-time highs basis the $A. Short-term we would be taking profits into strength but as believers of inflation raising its head in the years to come it’s a matter of when to reboard to train. Due to the propensity for some of our stocks in the sector to disappoint, especially Newcrest (NCM), I would be more inclined to buy gold ETF’s into weakness, probably later in the year as we feel its time for a rest after the last few years strong run – note we have no interest in going short, it’s about where to buy.
MM likes bullish Gold ETF’s into weakness.
Gold Spot / Cash $US/oz Chart
Question 18
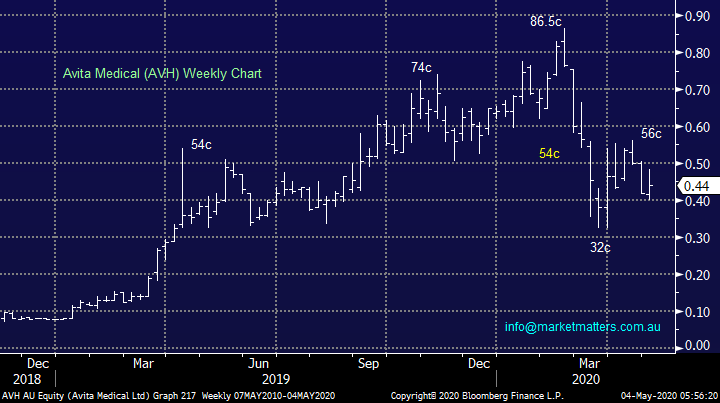
“Hi Team, I am enquiring about your view on a relatively small cap. There is not much coverage in the market although it has a market cap of approx. $939 m, It’s Avita Medical Limited (AVH). Any information would be appreciated” - Thank you, cheers David P.
Hi David,
Skin replacement business AVH is not that small, it’s worth almost $940m basis Fridays close. Last month it delivered strong revenue growth, sales were just under $6m for the quarter but growth of over 65% demonstrates the adoption of its offering. At this stage following the stocks massive appreciation since late 2018 it’s hard to get too excited but for the believers the 40c area looks a logical place to dip your toe in the water.
MM is neutral AVH.
Avita Medical Ltd (AVH) Chart
Question 19
“Hi James and the Team, In 2008-2009 there was some concern that we might face a total freeze / collapse of the world's financial system. In 2020 we are seeing a devastating blow being delivered to the world economy by the virus with the monthly / quarterly figures on virtually every metric going to indicate near economic collapse. While I know the equities market is forward looking - 6-12 months - I have zero confidence / trust this will all be over in that period. I believe we are looking at 2-3 years of economic desolation and disaster. Why do you guys believe we should not be 100% in cash in Govt Guaranteed accounts until we have some certainty we are on the way out? I reckon this is going to be a lot trickier and slower than the pollies think. With your hard rationalist head on - what do you really reckon? BTW I am still fully invested - but really wondering!!!!” – Cheers David M.
Hi David,
This indeed is the million dollar question do we want to have safety with almost zero return or do we believe equities are the better bet, even with higher risk. Remember how bad things looked during the GFC, while the circumstances are very different its arguably very similar today for equities. We are believers in the long-term benefits of investing in the stock market hence for us this is the time to be buying, not selling, even if it feels extremely uncomfortable at times – probably again today! However, each individual investor is different and at MM we simply write in general terms what we are doing in the market.
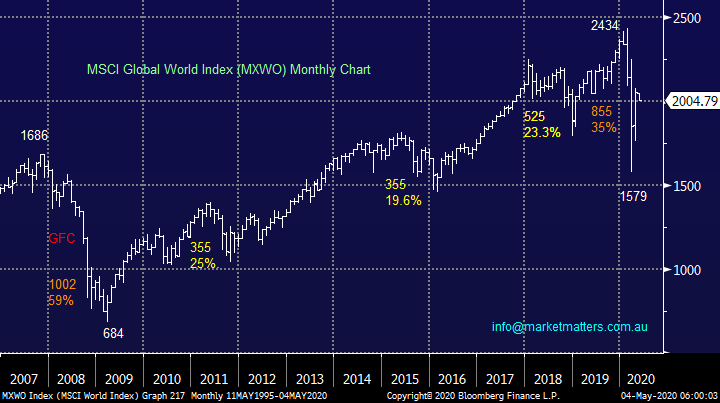
As you know our view is a choppy recovery through 2020 / 2021 which will often have investors wondering if they are doing the right thing but at this time next year I believe stocks will be higher and their yield will have beaten that of bonds.
MM is bullish global equities.
MSCI Global World Index Chart
Question 20
“Hi James & Team, keep up the good work! love it, I have couple of questions today
1. What is the MM view on subscribing to the RHC and NAB SPPs, apology if you have covered it I just want to confirm
2. What is your view on the stocks and buying level for TNE, ALL, TPM, BVS, LYC
Just another thing I want to say that I'm aware that MM are active investors not traders but in today’s rapidly changing market I think many of us are traders (daily, weekly, etc) so I would appreciate if you can provide more daily info and advise for those would like to take that path.” – Thanks, Tony N.
Morning Tony,
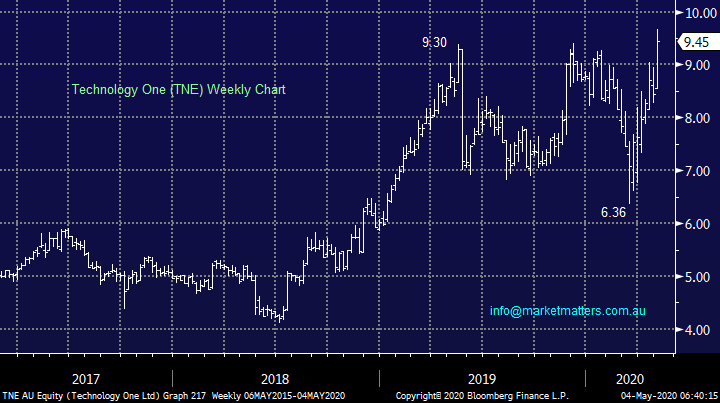
There’s a lot of questions rolled into one, fortunately part 1 has been covered in earlier questions. Part 2 I have answered briefly with prices as time is running short:
TNE ~$9, ALL ~$22, TPM ~$6.75, BVS ~$4.20 and LYC ~$1.40 but it’s not on our radar.
Technology One (TNE) Chart
Question 21
“Hi James, is there an ETF or something similar that can give me exposure to the FANG group of companies, or even the NASDAQ index more broadly, without having to buy international shares directly? I haven’t look closely but I believe Vanguard’s VTS is broad US exposure. Is there something more specific you know of?” - Cheers, Alan P.
Morning Alan,
For ASX listed options, we would consider the NDQ from Betashares which tracks the Nasdaq while ETF securities have a specific FANG ETF that is listed under code FANG.
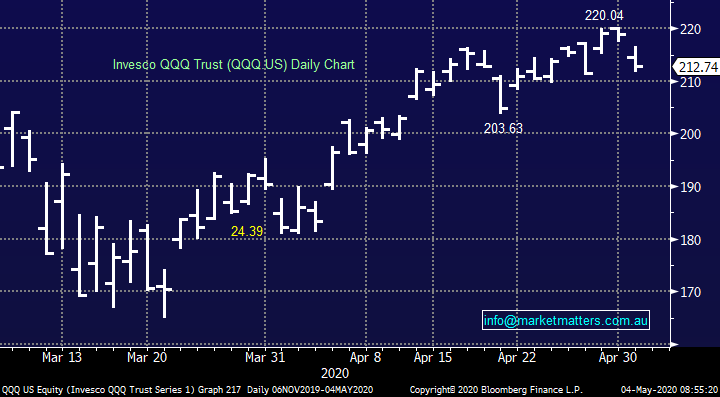
Internationally, our preferred vehicle is the Invesco QQQ Trust, it has a market cap of $US97bn and it tracks the NASDAQ 100 but note it is leveraged almost 2x and is denominated in $US.
MM likes the QQQ around $US200.
Invesco QQQ Trust (QQQ US) Chart
Overnight Market Matters Wrap
- The US equity markets followed the Aussie lead last Friday, as geopolitical tensions mount with China.
- On the energy front without a surprise, Exxon Mobil slid, after posting its first quarterly loss in 32 years!
- BHP is expected to outperform the broader market after ending its US session up an equivalent of 0.85% from Australia’s previous close.
- The June SPI Futures is indicating the ASX 200 to open lower, however US Futures have fallen 1.5% this morning
Have a great day!
James & the Market Matters Team
Disclosure
Market Matters may hold stocks mentioned in this report. Subscribers can view a full list of holdings on the website by clicking here. Positions are updated each Friday, or after the session when positions are traded.
Disclaimer
All figures contained from sources believed to be accurate. All prices stated are based on the last close price at the time of writing unless otherwise noted. Market Matters does not make any representation of warranty as to the accuracy of the figures or prices and disclaims any liability resulting from any inaccuracy.
Reports and other documents published on this website and email (‘Reports’) are authored by Market Matters and the reports represent the views of Market Matters. The Market Matters Report is based on technical analysis of companies, commodities and the market in general. Technical analysis focuses on interpreting charts and other data to determine what the market sentiment about a particular financial product is, or will be. Unlike fundamental analysis, it does not involve a detailed review of the company’s financial position.
The Reports contain general, as opposed to personal, advice. That means they are prepared for multiple distributions without consideration of your investment objectives, financial situation and needs (‘Personal Circumstances’). Accordingly, any advice given is not a recommendation that a particular course of action is suitable for you and the advice is therefore not to be acted on as investment advice. You must assess whether or not any advice is appropriate for your Personal Circumstances before making any investment decisions. You can either make this assessment yourself, or if you require a personal recommendation, you can seek the assistance of a financial advisor. Market Matters or its author(s) accepts no responsibility for any losses or damages resulting from decisions made from or because of information within this publication. Investing and trading in financial products are always risky, so you should do your own research before buying or selling a financial product.
The Reports are published by Market Matters in good faith based on the facts known to it at the time of their preparation and do not purport to contain all relevant information with respect to the financial products to which they relate. Although the Reports are based on information obtained from sources believed to be reliable, Market Matters does not make any representation or warranty that they are accurate, complete or up to date and Market Matters accepts no obligation to correct or update the information or opinions in the Reports. Market Matters may publish content sourced from external content providers.
If you rely on a Report, you do so at your own risk. Past performance is not an indication of future performance. Any projections are estimates only and may not be realised in the future. Except to the extent that liability under any law cannot be excluded, Market Matters disclaims liability for all loss or damage arising as a result of any opinion, advice, recommendation, representation or information expressly or impliedly published in or in relation to this report notwithstanding any error or omission including negligence.