Subscribers questions (ATL, IGL, AVH, IEM, QQQ US, ERA, PDN, STO, MXWO, EOS, QAN, S32, NCM, NXT)
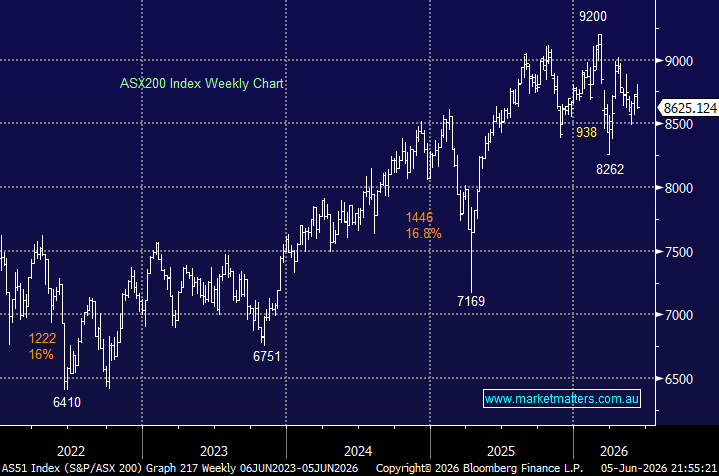
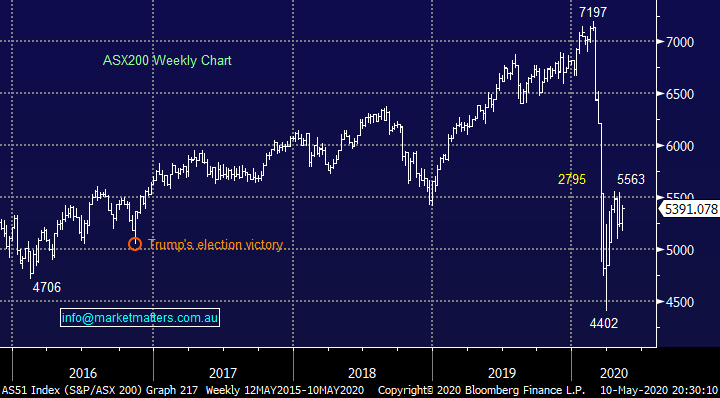
The ASX200 is grinding higher but the upside momentum has slowed over recent weeks primarily because the “Big 4” banks are struggling. These very same banks which make up 20% of the ASX need to come back into favour for the local market to keep pace with its US counterpart and challenge its February all-time high. Global interest rates sitting around zero hinders a banks margins while COVID-19 has also created huge uncertainty around future bad debts, the local sector is prudently cutting dividends diminishing their attraction to retail investors who have a huge presence on their share registers e.g. Westpac (WBC) who cut its May dividend to zero has over 600,000 retail investors.
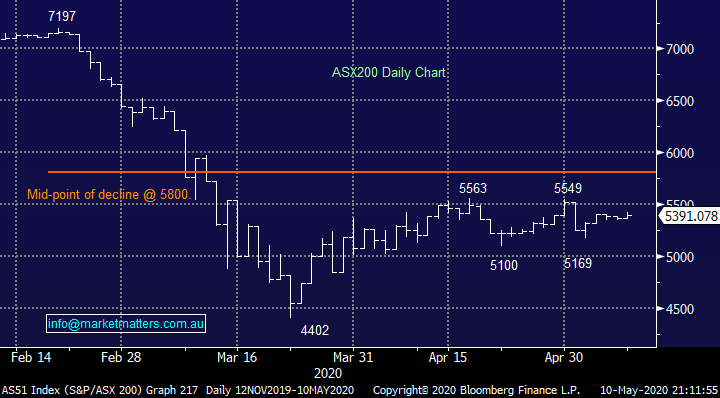
Our best guess remains unchanged, we feel the ASX200 will continue to roughly rotate between 5000 and 5500 as investors evaluate how both the local and global economies will recover as lock down restrictions are slowly but surely lifted. The strong 26% recovery from March’s low has largely been liquidity driven as Central Banks / Governments have moved aggressively to prop up economies during the pandemic, I feel we now need to see some semblance of an earnings recovery to encourage investors to push the market higher. It was encouraging to see property sales tick up on the first weekend for 6-weeks where public auctions were permissible, while we also saw a lot of people head out to the shops.
We saw on Friday that the numbers “today” are still as expected worrisome, the US is experiencing some of the worst economic data in its history, eclipsing the Great Depression which started in 1929 and left around 25% out of work and more than 5,000 banks out of business. Today we’re witnessing the US implode in a comparable manner, over 20 million people lost their jobs in April taking unemployment to 14.7% with the real number probably much higher. This employment data will undoubtedly get worse before it improves as the numbers by definition are a few weeks old but equities are looking ahead as they always do and we should not lose sight of how healthy the US economy was at the start of 2020 – the NASDAQ 100 is amazingly up for the year.
MM remains in “buy mode” with our ideal short-term buy area ~5% lower.
ASX200 Index Chart
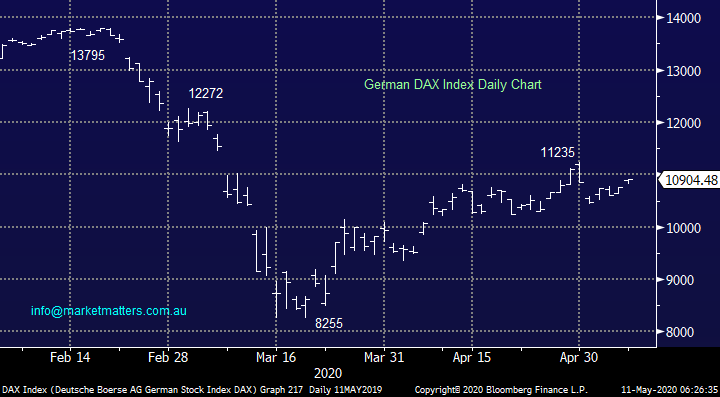
As we mentioned in the Weekend Report Australian stocks are more correlated to their European peers as opposed to the much-followed US – unfortunately we don’t enjoy the likes of Microsoft (MSFT US) which has soared 17% in 2020. Hence it’s no surprise that the German DAX looks very similar to the ASX, hence we also like the stance of “buy weakness and sell strength”.
MM’s current thoughts towards the DAX are buy ~7% lower and sell ~4% higher.
Similar sorts of numbers to the local bourse but under the hood stocks / sectors are running their own race hence just because the ASX might fall over 5% doesn’t necessarily mean that the quality local names both you and I have our eyes on will fall, or if they do don’t assume it will be to the same degree as the underlying index.
The German DAX Index Chart
Thanks everybody for another rewarding number of questions this morning, please keep them coming, we love having engaged and educated subscribers:
Question 1
“Assuming travel becomes limited to Aus/NZ. With the massive grey army getting toey to hook up the caravan. Are there any listed caravan parks that might be good value at this time of trouble?” - Peter H.
Hi Peter,
I like you’re thinking, I certainly think cruises will be off many people’s menu for a while. There are two ways to play this theme. Holiday parks with the main listed player that I know of being Ingenia (INA), they have holiday parks up and down the coast however their more permanent, affordable living communities are where they are focussing more attention. The earnings from holiday parks are somewhat diluted from other parts of their growing business. (NB INA is currently raising capital).
The other way is through RV sales. This is an area that had been performing strongly up until around 5-years ago, our largest manufacturer is private company Jayco which made 11,000 caravans, trailers and motorhomes back in 2016. This industry is probably more mature than many realise with back in 2017 Australia alone having 90 manufacturers employing 2500 people and turning over more than $1 billion however the industry has actually contracted by -1.2% over the last 5-years. Also, cheaper Chinese options have taken the cream off the cake, but they tend to be more active with cheaper offerings.
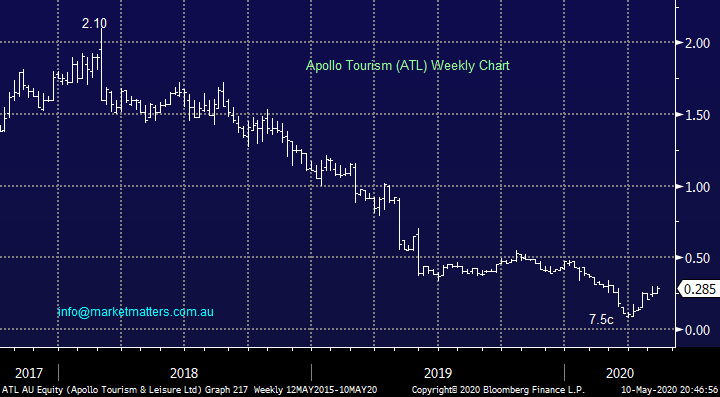
Listed RV manufacturer Apollo Tourism (ATL) has endured an awful few year and its international reach isn’t currently helping as many countries experience a far worse impact from COVID-19 than ourselves. I think it’s now or never for this QLD based business and it is currently tempting after its huge pullback.
MM likes ATL as an aggressive play from ~20c.
Apollo Tourism (ATL) Chart
Question 2
“Hi guys, I always take buy/sell recos, including yours, with a pinch of salt. For no reason though, I followed rather "blindly" your IGL "buy" a bit below $2.00. MY WRONG! But also - YOUR BIG WRONG! IGL was simply a record-breaking, SPECTACULARLY wrong "buy" reco of yours. Being stung immediately after my initial purchase, a few days later I averaged down, which I am still OK with. As of now, I am the proud owner of 40,000 IGL @ 1.232; some 3.2% of my SMSF. My question: What is your IGL exit or looking forward strategies for the next 6m to say, 2 years? E.g. take (part) loss; average price down & wait to see what happens; pray for a winning M&A, or for a miracle of some unknown sort (which, perhaps, is as good as any other option); or, something else?” - Thank you George T.
Morning George,
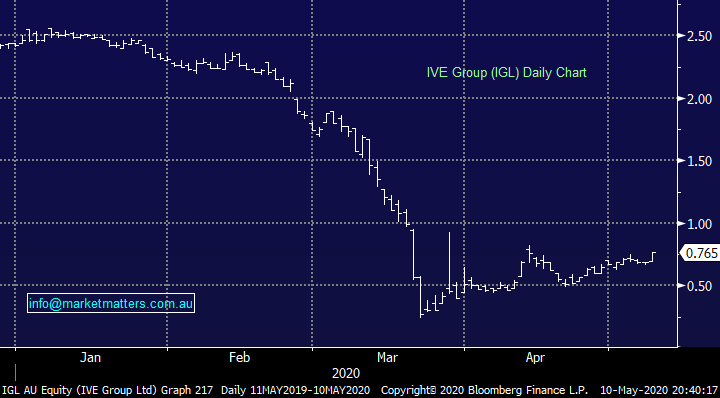
IVE Group (IGL) is an integrated marketing business we’ve held in the Income Portfolio since mid-2018 and its showing a paper loss of 46%. IGL were in the unfortunate position of just making an acquisition prior to COVID-19 hence the pandemic could not have come at a worse time for them. They have a high fixed cost base given the complexity of equipment needed for todays marketing activities while marketing spend is a luxury rather than a necessity, when the country is in lockdown and businesses are fighting for survival, it is an area that sees quick and aggressive cut backs – this is what happened with IGL.
By definition however, when the economic conditions improve, IGL is very leveraged to them. Their clients are bluechip Australian corporates and if IGL can see through this difficult period, they’ll be well placed on the other side.
The main risk at the moment is debt. At their last update they reported net debt of $174m, they also cancelled the interim dividend saving them $12.7m and said cash on hand was $29m, plus trade debtors exceed trade creditors by $30m. Their banking facilities were renegotiated in April 2019 and these don’t mature until 2023, they said they were within covenants however I think it’s very likely that debt will be higher than 3x net debt/EBITDA (on a rolling basis) and this is the largest market concern – I suspect a capital raise at some point is likely.
That said, if they trade through this period then this is a business capable of doing $50m in free cash flow per annum which is about 1/2 their current market cap.
MM is positive IGL at current levels.
IVE Group (IGL) Chart
Question 3
“Can you provide an update on Avita Medical (AVH)? How will the Covid-19 pandemic impact of the AVH skin regeneration trials and the near and medium term prospects of AVH? How will the intention of AVH to redomicile to the United States of America impact on Australian shareholders?” - Regards Ram H.
Hi Ram,
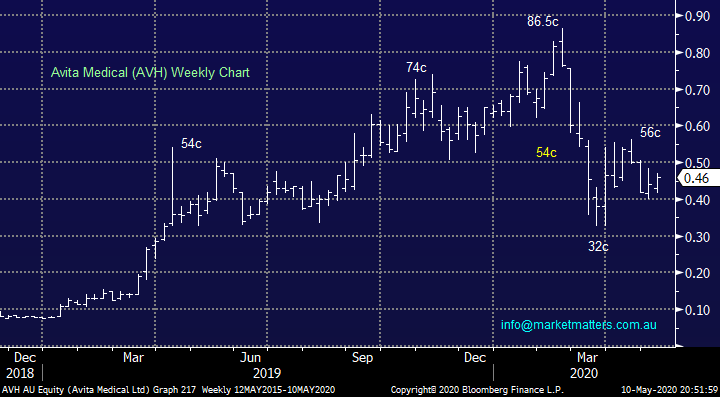
AVH fell almost 9% last month even after announcing an almost 70% increase in ¾ revenue to more than $8m. The obvious recent issue has been the companies almost $1bn valuation with relatively low income i.e. there’s lots of optimism built into AVH just when the market has become more conservative due to the pandemic. Specifically, I’m not sure how the pandemic have impacted their trials but a temporary slowdown would not surprise.
The companies declared intention to move to the US to reduce costs amongst other reasons makes sense and an eventual listing on the NASDAQ should be beneficial assuming the business continues to grow strongly. If the company doesn’t dual list existing shareholders will more than likely simply have their local holdings transferred to US stock.
Technically MM likes AVH with stops below 40c.
Avita Medical (AVH) Chart
Question 4
“Please let me know your thoughts about IEM ETF Is that a good risk / reward purchase at its current price, and do you have any plans to sell or buy more for your Global ETF portfolio.” – Thanks Sadhana P.
Hi Sadhana,
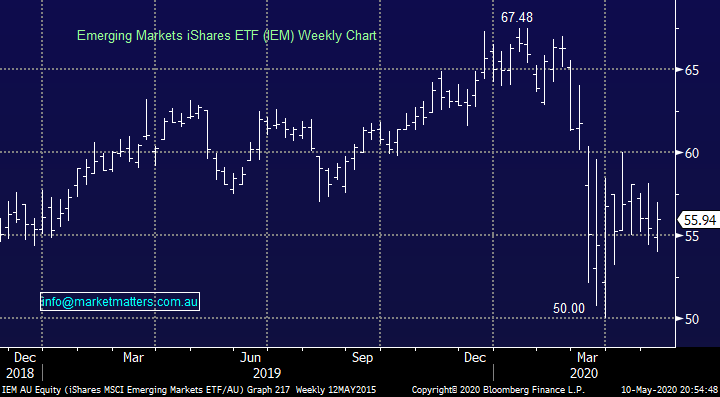
The IEM ETF has tracked global indices through the pandemic which is of no surprise. At MM we are bullish equities over the next 12-18 months hence we are comfortable with our IEM position and we may indeed increase the holding into a pullback.
MM is bullish the IEM ETF.
iShares MSCI Emerging Markets ETF (IEM) Chart
Question 5
“James - a couple of times I have noticed that you refer to the QQQ as being "leveraged". As an investor in this ETF I was concerned about this as I am not a fan on leveraged ETFs. However, I cannot find any information that confirms this. There is a leveraged version, the TQQQ UltraPro QQQ, but the QQQ itself seems like a vanilla ETF that tracks the NASDAQ 100. Can you confirm please?” - Many thanks David M.
Hi David,
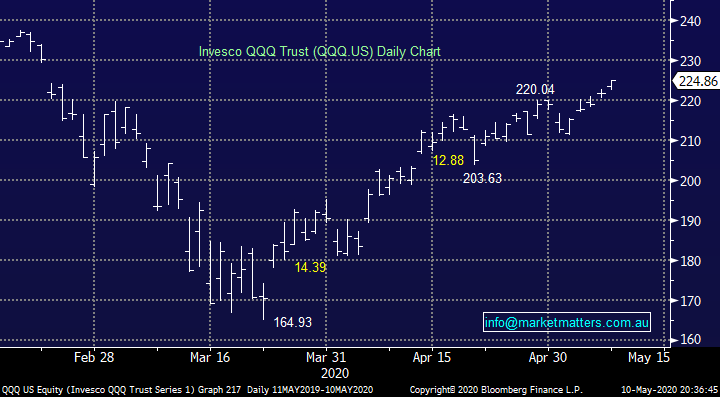
You are right. The Proshares QQQ is leveraged however that trades under code TQQQ. The Invesco QQQ Trust we hold in that portfolio is not leveraged – sorry for the miscommunication around that.
On Friday, the QQQ closed up +1.37% on Friday whereas the NASDAQ 100 finished up +1.3%, basically 1:1 within a margin of simple tracking error.
We are long in our Global Macro ETF Portfolio and remain medium-term bullish the QQQ.
Invesco QQQ Trust (QQQ US) Chart
Question 6
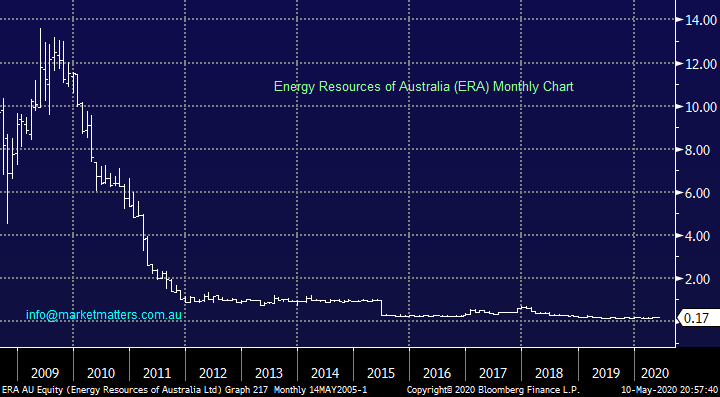
“James, can you give me an update on Energy Resources of Australia. This is the only Australian share held by WA’s biggest and most successful high net wealth fund manager. At this point in time the Fund is 61% cash having sold out of the majority of its equities early and late February. What is the attraction of ERA?” - Regards John M.
Hi John,
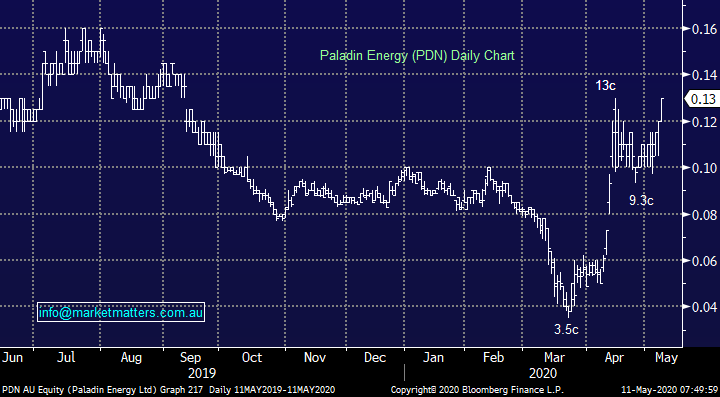
The Uranium price has been a tear as global supply is forecast to move from surplus to deficit over the coming years, plus a number of major producers have stopped production due to Covid-19. In terms of ERA I have no idea why investors / fund managers would want to own uranium miner ERA, we would prefer PDN in the local space as discussed recently.
Technically PDN looks great for further gains.
Energy Resources of Australia (ERA) Chart
Paladin (PDN) Chart
Question 7
“Hi James and Team, Thanks for the great service. A suggestion for one of your reports... I recognise that from time to time you touch on and comment on stocks in the MM portfolios but perhaps you could revisit your holdings and summarise your present thoughts and recommendations at current prices? I suggest this because we know that the investing landscape is not static and MM's current conviction on the stocks held may have changed. Eg. a simple table that has say "ASX ticker", "Buy/Hold/Sell" and "Brief comments". - Thanks, Jan P
Hi Jan,
Thanks for the thumbs up for the MM service, much appreciated. As we can see from a quick glance at the ASX200 chart below the investment landscape has most definitely been far from static in 2020. To your point / suggestion, we are on track to launch a new website in July / August this year and there is a feature within the site which provides a quantum of how bullish / bearish we are on a stock. This should give you exactly what you’re after on an ongoing basis.
ASX200 Index Chart
Question 8
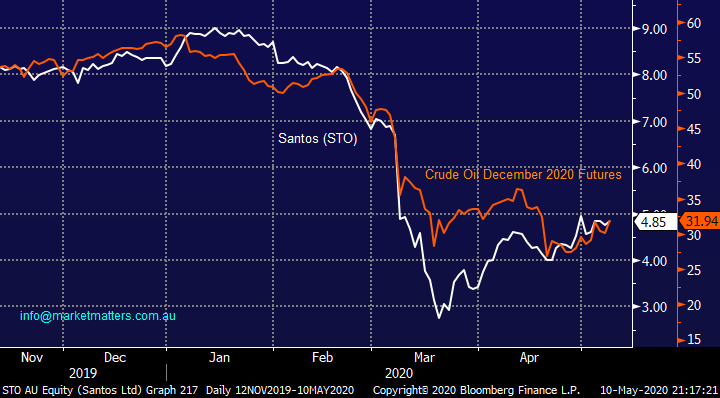
“Hi James and MM team, a question for Monday perhaps, Oil and energy stocks appear to have rallied in advance of the oil price recovery which make sense, but do stocks like Santos have much more room to run? is time to take some profits and deploy funds to others that are yet to recover? Keep up the good work.” – Scott S.
Morning Scott,
I actually believe the likes of Santos (STO) have followed crude oil closely – see below chart. At MM we remain bullish oil initially targeting +15% further upside hence we remain comfortable with our current overweight stance towards the Energy Sector.
Santos (STO) v Crude Oil Chart
Question 9
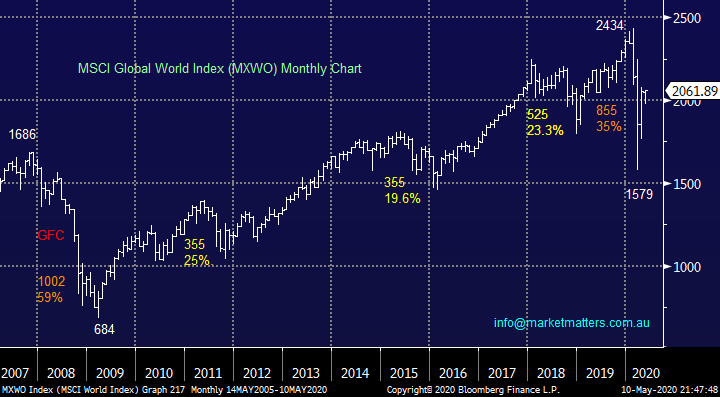
“Hi MM, can you please explain, when the stock market loses a lot of value, as it has done recently. Is any money ever actually lost in a combined net total sense? Or does capital simply move from those who used to have it, to those who now have it (held in other assets such as cash or bonds)?” - Kind regards, Richard M.
Hi Richard,
The total value of the ASX is roughly $1.9 trillion. If the market declines by 10%, the value of the market becomes $1.71 trillion i.e. worth $190 billion less. There will be swings and roundabouts about who made / lost what however the key being the pie is smaller.
Asset prices fluctuate, the alternative is holding cash which has been a shocking investment over time. We believe long term investors should embrace periods of stock market weakness to increase their equities exposure as opposed to selling when the crowd panics.
MSCI World index Chart
Question 10
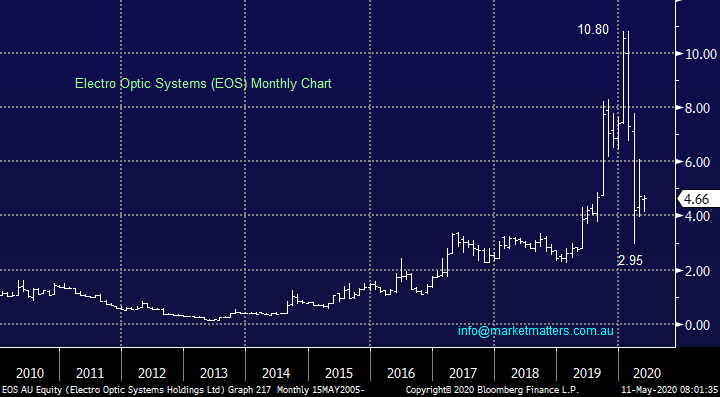
“Hi James, Please can you comment on EOS and SO2. A lot of activity has been going on with both.” - Thanks Laurence S.
Hi Laurence,
Technology business EOS services the space and defence markets with its electro-optic design, a marketplace which one would have expected to be fairly insulated through COVID-19 but alas the stock crashed well over 70%. ESO is Australia’s largest aerospace and defence exporter although it often slides under the radar on the ASX where it arguably offers excellent diversification to many portfolios.
MM likes ESO but we would not go “all-in” at current levels.
Electro Optic Systems Holdings (EOS) Chart
Not sure what you meant with SO2? No stocks by that code / name that I can see.
Question 11
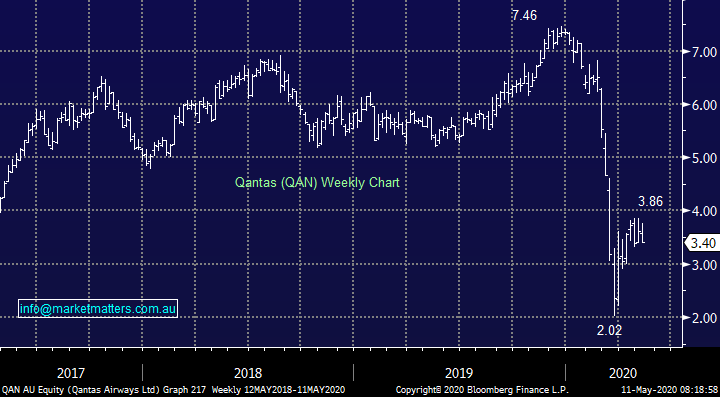
“Hi Team, congratulations on the great newsletter and market Perspective. In your crystal ball where do you see S32 and QAN In 18 months’ time?” - Matthew K.
Hi Matthew,
Thanks for the vote of confidence, much appreciated.
We are not keen on QAN because international travel appears to be miles away (excuse the pun) although the collapse of Virgin (VAH) might help QAN’s margins locally.
If I were keen on QAN my ideal technical buying area would be under $3.
QANTAS (QAN) Chart
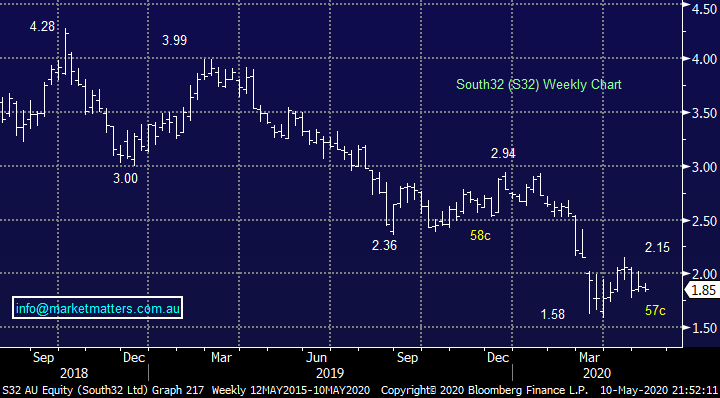
We have talked about this diversified miner a few times, its probably our prime candidate to increase our resources exposure if we see a continuation of its downtrend since Q4 of 2018.
MM remains buyers of S32 into fresh 2020 lows.
South32 (S32) Chart
Question 12
“Hi James, I received an email from NCM today regarding the SSP and the share price offer is at $25.6 which is different to the price you quoted in MM email earlier this week. Could you confirm MM view on this please? Thank you” – Tony N.
Hi Tony,
NCM intends to raise $100m through its SPP at the lower of $25.60 or a 2% discount to the 5-day VWAP, whichever is lower i.e. no more than $25.60. Hence your number is correct – I have updated the table below that was included in last weeks note, the NCM number was incorrect at the time.
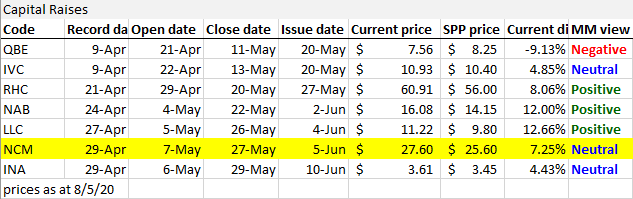
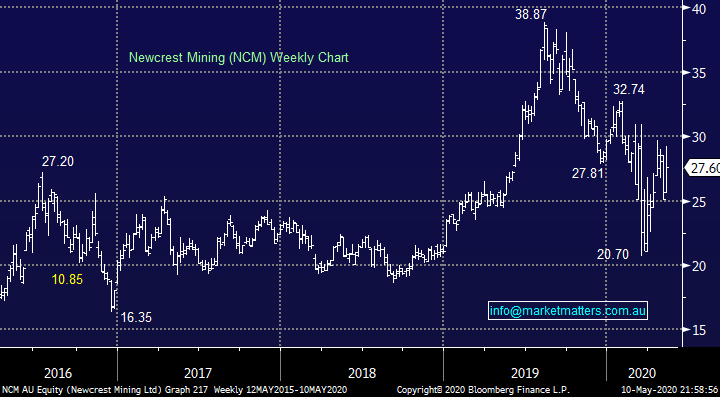
While we are not a fan of NCM as an outright buy here, buying at 7.2% discount to today’s price always sits well.
MM is neutral NCM at present.
Newcrest Mining (NCM) Chart
Question 13
“Hi James and team, I have a question about NXT, do you see further upside in this stock and Target Price. I have bought the max in SPP.” - Thanks Mike F.
Hi Mike,
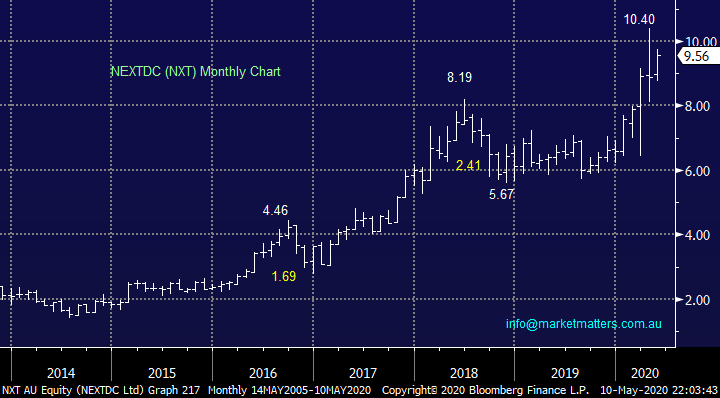
NXT looks good to us as we have said previously, from a risk / reward perspective it’s hard to get too excited at current levels but we still expect fresh all-time highs in 2020 / 2021.
MM remains bullish NXT.
NEXTDC (NXT) Chart
Question 14
“Hi Guys what is your view of the comments regarding equities in this week's Economist:
Key quote:
The risks are...
"The first is the risk of an aftershock. It is entirely possible that there will be a second wave of infections. And there are also the consequences of a steep recession to contend with—American GDP is expected to drop by about 10% in the second quarter compared with a year earlier. Many individual bosses hope that ruthless cost-cutting can help protect their margins and pay down the debts accumulated through the furlough. But in aggregate this corporate austerity will depress demand. The likely outcome is a 90% economy, running far below normal levels.
A second hazard to reckon with is fraud. Extended booms tend to encourage shifty behaviour, and the expansion before the covid crash was the longest on record. Years of cheap money and financial engineering mean that accounting shenanigans may now be laid bare. Already there have been two notable scandals in Asia in recent weeks, at Luckin Coffee, a Chinese Starbucks wannabe, and Hin Leong, a Singaporean energy trader that has been hiding giant losses (see article). A big fraud or corporate collapse in America could rock the markets’ confidence, much as the demise of Enron shredded investors’ nerves in 2001 and Lehman Brothers led the stockmarket down in 2008.
The most overlooked risk is of a political backlash. The slump will hurt smaller firms and leave the bigger corporate survivors in a stronger position, increasing the concentration of some industries that was already a problem before the pandemic. A crisis demands sacrifice and will leave behind a big bill. The clamour for payback will only grow louder if big business has hogged more than its share of the subsidies on offer. It is easy to imagine windfall taxes on bailed-out industries, or a sharp reversal of the steady drop in the statutory federal corporate-tax rate, which fell to 21% in 2017 after President Donald Trump’s tax reforms, from a long-term average of well over 30%. Some Democrats want to limit mergers and stop firms returning cash to their owners.
For now, equity investors judge that the Fed has their back. But the mood of the markets can shift suddenly, as an extraordinary couple of months has proved. A one-month bear market scarcely seems enough time to absorb all the possible bad news from the pandemic and the huge uncertainty it has created. This stockmarket drama has a few more acts yet."
Are we in a fool's paradise? Cheers and thanks!” - David M.
Hi David,
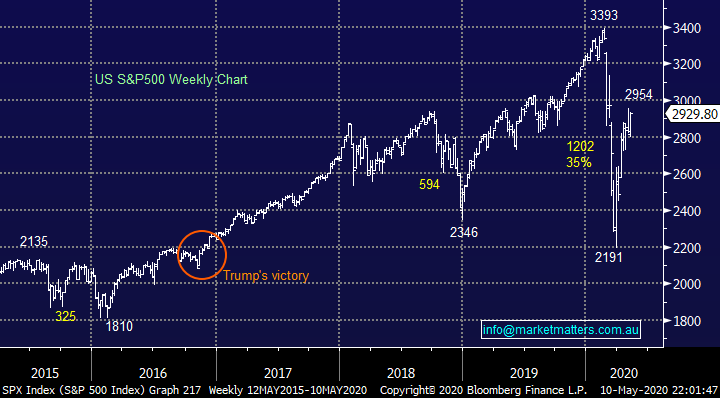
I’m not big on conspiracy theories perse but I do agree there are a few more acts to play out with COVID-19, especially with the US arguably going back to work too soon risking a second wave of infections but we still stick with our underlying view that ongoing periods of weakness are buying opportunities.
Fraud aside the global lockdowns have shown up any companies with vulnerable balance sheets as their income tap has been turned off or reduced through no fault of their own. However as we are seeing with the likes of Microsoft (MSFT US) in the US the cream will float to the top, the pandemic has just accelerated the inevitable in most cases.
US S&P500 Index Chart
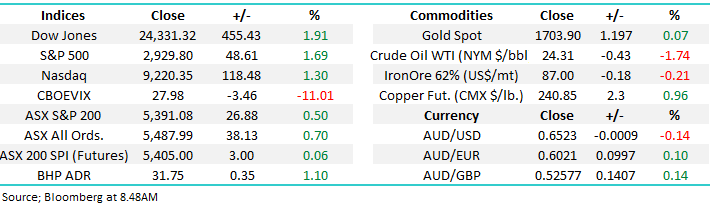
Overnight Market Matters Wrap
- The expected surge in US unemployment rate, the worst since the Great Depression was ignored by investors, sending all its key indices to rally over 1.5%.
- Crude oil this morning lost some of its gains, currently trading 1.74% lower at US$24.31/bbl. while gold closed marginally lower at US$1,703.90/oz.
- BHP is expected to outperform the broader market after ending its US session up an equivalent of 1.10% from Australia’s previous close.
- The June SPI Futures is indicating the ASX 200 to open 20 points higher, testing the 5410 level this morning.
Have a great day!
James & the Market Matters Team
Disclosure
Market Matters may hold stocks mentioned in this report. Subscribers can view a full list of holdings on the website by clicking here. Positions are updated each Friday, or after the session when positions are traded.
Disclaimer
All figures contained from sources believed to be accurate. All prices stated are based on the last close price at the time of writing unless otherwise noted. Market Matters does not make any representation of warranty as to the accuracy of the figures or prices and disclaims any liability resulting from any inaccuracy.
Reports and other documents published on this website and email (‘Reports’) are authored by Market Matters and the reports represent the views of Market Matters. The Market Matters Report is based on technical analysis of companies, commodities and the market in general. Technical analysis focuses on interpreting charts and other data to determine what the market sentiment about a particular financial product is, or will be. Unlike fundamental analysis, it does not involve a detailed review of the company’s financial position.
The Reports contain general, as opposed to personal, advice. That means they are prepared for multiple distributions without consideration of your investment objectives, financial situation and needs (‘Personal Circumstances’). Accordingly, any advice given is not a recommendation that a particular course of action is suitable for you and the advice is therefore not to be acted on as investment advice. You must assess whether or not any advice is appropriate for your Personal Circumstances before making any investment decisions. You can either make this assessment yourself, or if you require a personal recommendation, you can seek the assistance of a financial advisor. Market Matters or its author(s) accepts no responsibility for any losses or damages resulting from decisions made from or because of information within this publication. Investing and trading in financial products are always risky, so you should do your own research before buying or selling a financial product.
The Reports are published by Market Matters in good faith based on the facts known to it at the time of their preparation and do not purport to contain all relevant information with respect to the financial products to which they relate. Although the Reports are based on information obtained from sources believed to be reliable, Market Matters does not make any representation or warranty that they are accurate, complete or up to date and Market Matters accepts no obligation to correct or update the information or opinions in the Reports. Market Matters may publish content sourced from external content providers.
If you rely on a Report, you do so at your own risk. Past performance is not an indication of future performance. Any projections are estimates only and may not be realised in the future. Except to the extent that liability under any law cannot be excluded, Market Matters disclaims liability for all loss or damage arising as a result of any opinion, advice, recommendation, representation or information expressly or impliedly published in or in relation to this report notwithstanding any error or omission including negligence.