Has Aprils almost 50% plunge in new car sales created any opportunities? (AWC, BRG, APE, CAR, ARB, GUD)
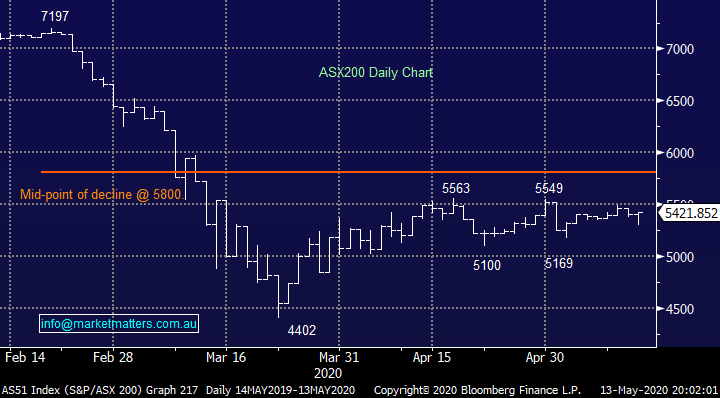
The ASX continues to dance to the same jig - “Sell strength & buy weakness”, yesterday we traded down just over 100-points early in the morning before grinding higher throughout the day, finally closing up 19-points, an impressive +2.3% recovery. On the stock level we might have only enjoyed 43% of the index names closing up on the day but when the ASX200’s largest 7 stocks, which make up over 35% of the index, all rally the odds are in favour of a positive outcome. As we discussed in the MM Income Note market heavyweight CBA more than satisfied the market with a solid trading update sending the stock up almost 2% - I’m glad almost 60% of our “Big Four Banking” exposure for the MM Growth Portfolio is in CBA.
Scott Morrison and co would have been extremely pleased to see an almost stampede to buy their $19bn bond offering yesterday, the largest Australian bond auction in history was almost covered 3x over with bids totalling more than $53bn. This huge result reiterates our ongoing belief that “there’s money in them thar hills”, as we’ve repeated almost at nausea over recent weeks this is a liquidity as opposed to an earnings driven rally and one thing investors should have learnt since the GFC is when central banks pump money into financial markets they rally, hence the phrase “don’t fight the Fed”. This has remained the core reason through the current market rotation MM’s main focus has been buying weakness, as opposed to selling strength despite the almost deafening calls from many well-known investors about valuation.
There will undoubtedly be a time when the buyers become exhausted, more than likely after a classic FOMO style surge in stocks but at this stage unless we get some game changing news around COVID-19 we believe pullbacks will remain shallow, disappointing the cashed up investors hoping to buy at lower levels - today appears likely to be another test of this thesis. We have our eyes on a few names that have been mentioned in recent weeks and if they dip into our buy zones expect alerts to fly!
NB FOMO is the acronym for the “fear of missing out”.
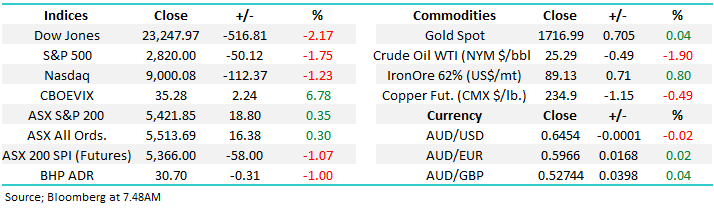
Overnight the Dow has fallen another 500-points, taking the decline over the last 48-hours to around 1000-points, this time fuelled by negative comments from Fed Chair Jerome Powell. However, the SPI futures are only calling the local market to fall 60-points this morning, still above yesterday morning’s low, we continue to look out for “bargains”.
MM remains bullish equities medium-term, hence were in “buy mode”.
ASX200 Index Chart
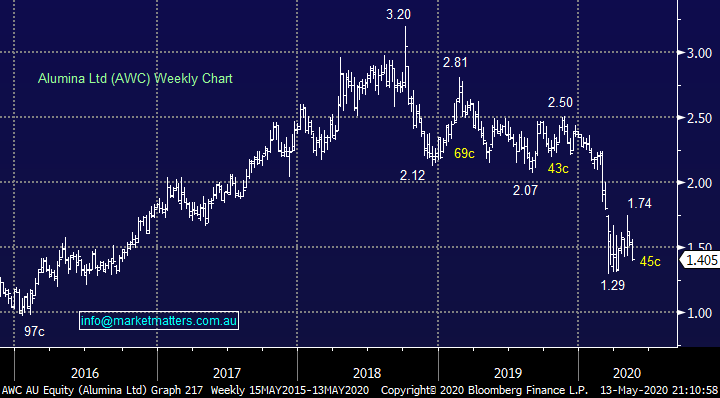
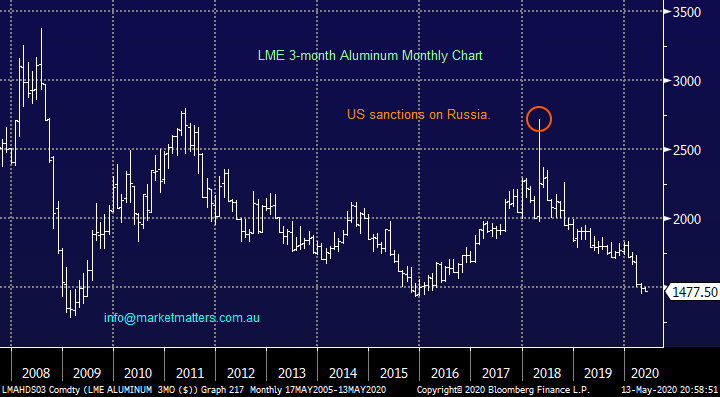
One stock we have on our watchlist is Alumina (AWC) which was the worst performer on the boards for Wednesday falling -7%, suddenly our buy zone is approaching rapidly. The coronavirus has hit aluminium in a way that is reminisce of Crude Oil, just before it rallied strongly taking Santos (STO) for example up over 70% from its lows. With everything appearing awful for the lightweight metal we have donned our contrarian hat and are poised to buy a panic style dip lower.
Adding weight to our view is the impact of index rebalancing which was announced on the 12 May. Alumina had been added to a large income ETF however that is now being removed. According to our institutional desk, there is around 134m shares being sold and it started yesterday. This may drive AWC to new lows.
MM remains keen to buy AWC into fresh 2020 lows.
Alumina (AWC) Chart
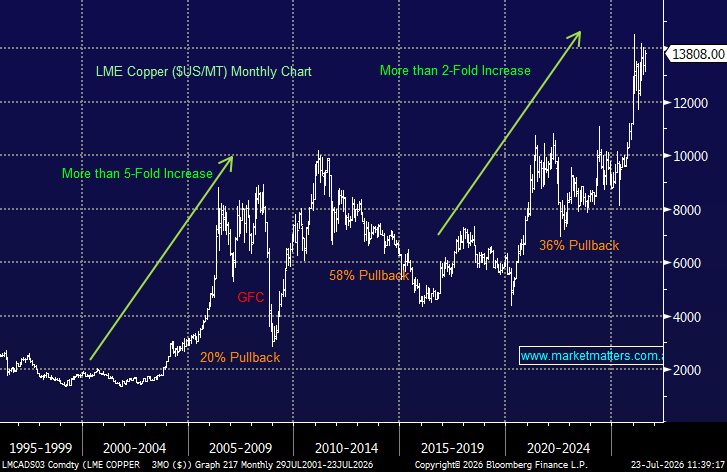
Aluminium 3-month LME Price Chart
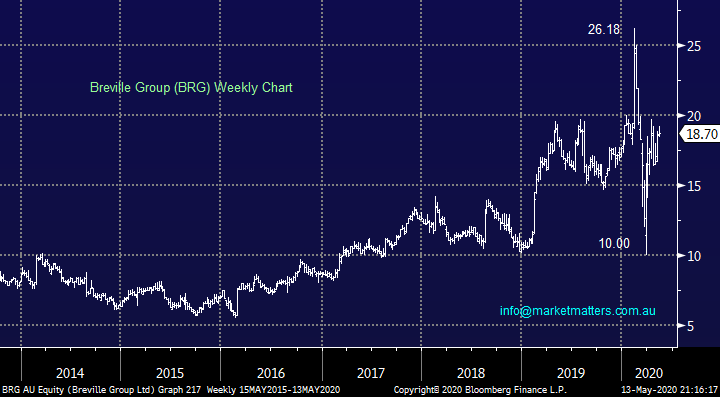
Last night Breville Group (BRG) launched a $94m capital raise at a 9.1% discount to its last trade of $18.70, plus an additional $10m SPP. The company said the raise was to “enhance financial flexibility to continue its growth agenda while maintaining a strong financial position” – beats paying down debt!
We like BRG’s growth profile driven by its penetration into North America, Europe is the companies 2nd largest market but it’s been flat lining there – coronavirus aside of course. Considering the quality and growth of BRG we believe this consumer appliances business represents good value. Patience might be required short-term but assuming the world eventually puts the pandemic behind it and avoids a deep recession / depression this stock should make another assault well above $20. The company released excellent results back in February sending shares through $26, the perfect profile for MM as the world moves into recovery mode.
MM likes BRG below $18.
Breville Group (BRG) Chart
Overseas equities
Overnight US stocks fell 1.75% making fresh 3-week lows in the process following comments by Fed chair Jerome Powell who said the US Central Bank was not considering negative interests rates for now but he warned that the economic risks from COVD-19 were significant and tensions with China had flared - personally I struggle to find any surprises from this statement and it simply illustrates to MM the market had got a little ahead of itself.
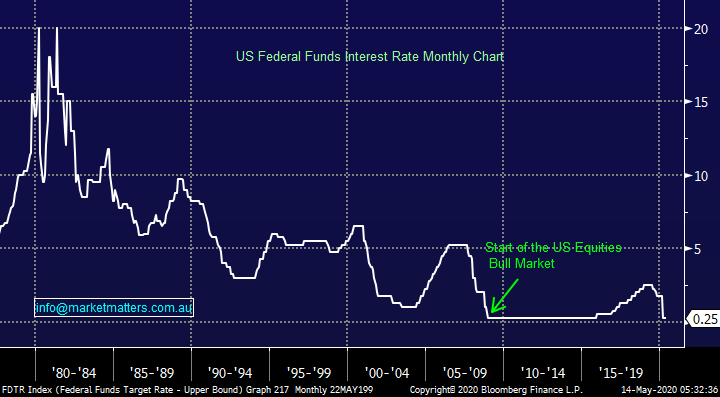
Stocks have undoubtedly become very greedy when it comes to desired monetary Stimulus, just compare todays Fed Interest Rate of 0.25% to the heady eighties when they threatened to break above 20%, surely interest rates of basically zero is enough of a tailwind for risk assets.
US Fed Funds Target Rate Chart
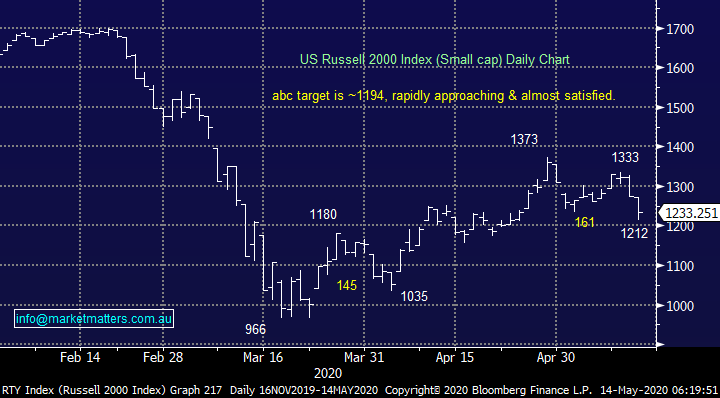
As we said yesterday the US small cap Russell 2000 Index has been an underperformer for much of the last few years as its doesn’t enjoy contributions from the likes of Apple (AAPL US) and Microsoft (MSFT US). We continue to look for a deeper pullback from this index with a test of 1200 our preferred scenario, but it got mighty close last night before bouncing.
MM’s short-term target for the Russell 2000 of around 1200 has basically been achieved.
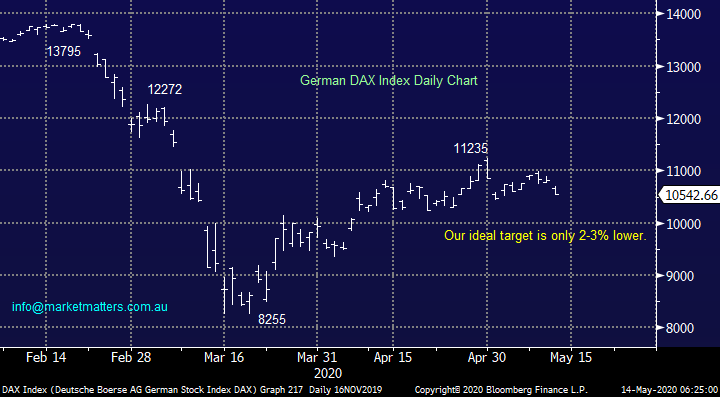
Similarly, our ideal short-term target for the current pullback by the major S&P500 is now only 2% away, to all intense and purposes its satisfied and a short-term swing low feels likely in the next few days. Lastly Europe is also towing our technical line with the German DAX likely to reach our target in the next 24-48 hours.
MM remains bullish global stocks in the medium-term.
US Russell 2000 (Small Cap) Index Chart
German DAX Index Chart
Have car sales bottomed?
April saw a horrendous 49% plunge in new car sales year on year as the Australian consumer battened down the hatches with regard to major spends, surviving the uncertainties around COVID-19 understandably became the priority. I spoke to an old friend last night who works at a major car dealership in country NSW and his feedback around the current state of the market was interesting and made sense:
1 – Older Australians are buying cars when / if they need them, the current pandemic isn’t particularly impacting them.
2 – Some people who have ordered cars have cancelled as their circumstances have dramatically changed.
3 – Young people have gone into hibernation as concerns around employment escalate.
4 - Country areas are faring far better than their city peers which makes a change, relatively large government handouts cited as the driver in areas with a lower cost of living.
Overall, he said things are ok with servicing still firing although people are obviously driving less, his “call” was business only down ~15% but remember this is country not city dealership. Looking at the negatives above a simple pickup in consumer confidence looks the tonic required to turn this sector around, this might be just around the corner as we open up our country in a major way over the weeks ahead – the chart below feels like it might become a month or two blip especially with the governments incentive to business to spend up now in order to have major right offs this financial year i.e. the ATO’s instant asset write-off plan.
Another drag over recent times on auto sales has been tighter lending restrictions, these might be relaxed moving forward as the government does everything in its power to stimulate our economy, this industry headwind might actually become a tailwind.
Australian New Vehicle Sales
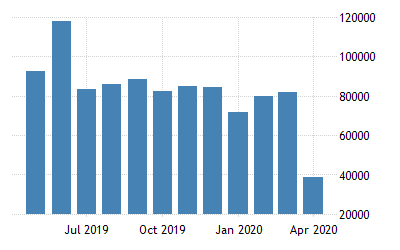
Source: tradingeconomics.com
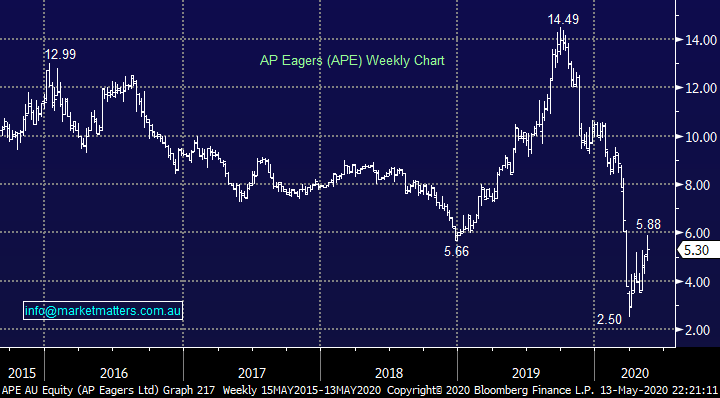
1 AP Eagers (APE) $5.30
Australia’s largest car dealership APE was forced to recently sack 1200 workers while also putting many on temporary rosters as the pandemic caused a rapid downturn in sales – walk-ins to showrooms not surprisingly simply vanished almost overnight. However like with many sides of COVID-19 Australia has fared relatively well with US sales falling closer to 60%. The concern to us is not “the now” but the ongoing decline in sales which has been in play for over 2-years. The challenges this high turnover low margin industry face signals to MM that we want absolute bargains before considering accumulation – APE above $5 doesn’t really tick this box.
The apparent structural shift in car ownership has us on the sidelines with regard to APE i.e. younger people see less reason to buy a car when they can use the likes of Uber and Ola, often a much cheaper net outcome.
MM is neutral APE at present.
AP Eagers (APE) Chart
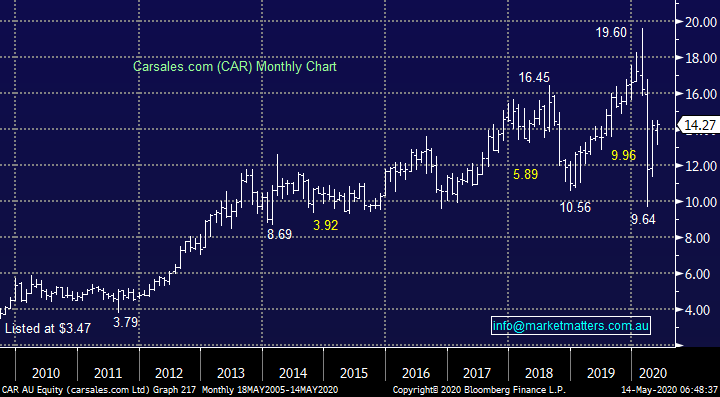
2 Carsales.com (CAR) $14.27
CAR was the shining light in a weak auto industry last year as its shares rallied 60% but the pandemic has slowed it down like many quality businesses. The company has succeeded through a tough period primarily courtesy of an excellent business model (on-line). Revenue last Financial Year was up 11% to $418m with strong international growth contributing nicely. The pandemic might just have just provided an opportunity with CAR.
MM likes CAR around $14.
Carsales.com Chart
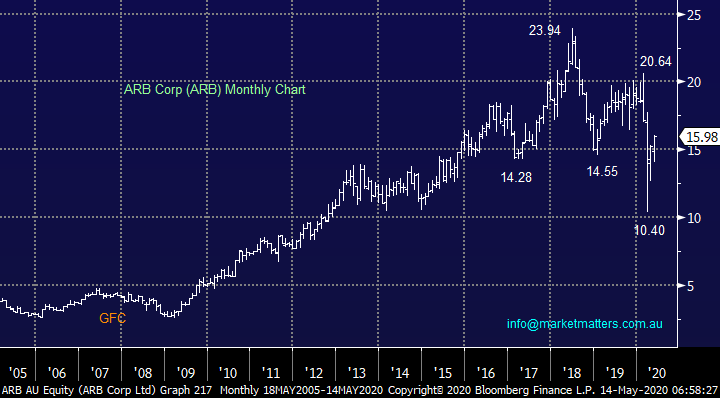
3 ARB Corp (ARB) $15.98
ARB is Australia’s largest distributor of four by four accessories headlined by its bull bars, but the business also trades successfully overseas through more than 100 countries. As the world emerges from lockdown people look destined to change their holiday patterns for the foreseeable future, an evolution which in our opinion should work in ARB’s favour.
Unfortunately, the stock was already struggling prior to the coronavirus following an average report for the last 6-months in 2019, it produced a 7.4% drop in profits to $25.3m. However, while we are generally looking for companies that were performing strongly before the pandemic ARB does look well positioned to consolidate and evolve moving forward.
MM likes ARB into weakness.
ARB Corp (ARB) Chart
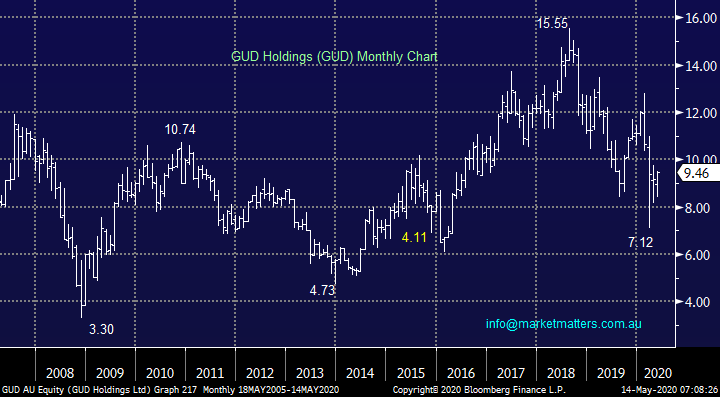
4 GUD Holdings (GUD) $9.46
GUD is involved in the very different water and automotive businesses, diversification can insulate against sector headwinds but also make a stock harder to value. The business roared into 2020 following a solid 1st half result which actually came in with an EBITDA marginally ahead of 2019’s number, a good result in a tough market environment. The automotive segment actually delivered a 4% increase in revenue to $173.6m whereas the water area only grew by 2%. Also, this is one Australian business which benefits from a stronger $A.
MM is neutral to positive GUD.
GUD Holdings (GUD) Chart
Conclusion
Within the Australian auto industry, CAR is our standout favourite, otherwise the sector simply doesn’t feel cheap enough for the risks at hand.
Overnight Market Matters Wrap
- The US equity markets sold off following comments from US Fed Chair, Jerome Powell warning of the economic risks from the coronavirus along with the never-ending tensions with China.
- Crude oil lost 1.90% on higher inventories
- Data worth mentioning today – Aussie employment data (11.30AM) expecting 8.2%, with a 65.3% participation rate and US weekly jobless claims, expecting 2.5m.
- The June SPI Futures is indicating the ASX 200 to open 52 points lower, towards the 5370 level this morning.
Have a great day!
James & the Market Matters Team
Disclosure
Market Matters may hold stocks mentioned in this report. Subscribers can view a full list of holdings on the website by clicking here. Positions are updated each Friday, or after the session when positions are traded.
Disclaimer
All figures contained from sources believed to be accurate. All prices stated are based on the last close price at the time of writing unless otherwise noted. Market Matters does not make any representation of warranty as to the accuracy of the figures or prices and disclaims any liability resulting from any inaccuracy.
Reports and other documents published on this website and email (‘Reports’) are authored by Market Matters and the reports represent the views of Market Matters. The Market Matters Report is based on technical analysis of companies, commodities and the market in general. Technical analysis focuses on interpreting charts and other data to determine what the market sentiment about a particular financial product is, or will be. Unlike fundamental analysis, it does not involve a detailed review of the company’s financial position.
The Reports contain general, as opposed to personal, advice. That means they are prepared for multiple distributions without consideration of your investment objectives, financial situation and needs (‘Personal Circumstances’). Accordingly, any advice given is not a recommendation that a particular course of action is suitable for you and the advice is therefore not to be acted on as investment advice. You must assess whether or not any advice is appropriate for your Personal Circumstances before making any investment decisions. You can either make this assessment yourself, or if you require a personal recommendation, you can seek the assistance of a financial advisor. Market Matters or its author(s) accepts no responsibility for any losses or damages resulting from decisions made from or because of information within this publication. Investing and trading in financial products are always risky, so you should do your own research before buying or selling a financial product.
The Reports are published by Market Matters in good faith based on the facts known to it at the time of their preparation and do not purport to contain all relevant information with respect to the financial products to which they relate. Although the Reports are based on information obtained from sources believed to be reliable, Market Matters does not make any representation or warranty that they are accurate, complete or up to date and Market Matters accepts no obligation to correct or update the information or opinions in the Reports. Market Matters may publish content sourced from external content providers.
If you rely on a Report, you do so at your own risk. Past performance is not an indication of future performance. Any projections are estimates only and may not be realised in the future. Except to the extent that liability under any law cannot be excluded, Market Matters disclaims liability for all loss or damage arising as a result of any opinion, advice, recommendation, representation or information expressly or impliedly published in or in relation to this report notwithstanding any error or omission including negligence.