Overseas Wednesday – International Equities & Global Macro ETF Portfolios (VALE US, SH US, SVXY US, UDN US)
The ASX200 had a relatively quiet Tuesday but still finally managed to close up almost +0.3% with a solid 60% of the index managing to close in positive territory. The Building Sector maintained its recent strength / outperformance following in the footsteps of other pockets of the market i.e. when we see a previously out of favour sector receive a bid tone its following through as opposed to being a 1-day “flash in the pan” wonder e.g. the banks rallied strongly for 3-days. There are two obvious takeout’s here:
1 – If a stock / sector you have been looking to buy garners a surprising bid tone jump on board its likely to follow through.
2 – Conversely if a stock you have been looking to sell starts to rally its probably a good time to be patient, at least for a few days.
MM’s market stance has not changed, we believe it’s going to be an exciting 1-2 years with plenty of opportunities for the “Active Investor”:
1 – MM remains bullish global equities for the next 12-18 months.
2 – MM believes we are in the very early stages of a major rotation into value stocks from the currently in vogue growth stocks such as the IT and Healthcare Sectors.
ASX200 Index Chart
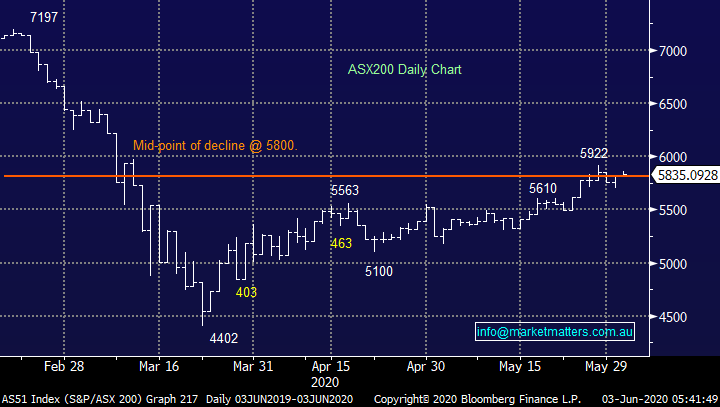
In our humble opinion the “Little Aussie Battler” is showing the way ahead for stocks and it’s up!
The $A is now knocking on the door of 69c, up 25% from its March low, the divergence between the ASX and $A has widened of late but we maintain the strong $A will drag the ASX higher, especially the value sector e.g. Resources, Banks and Building companies. Our opinion has not wavered in 2020 i.e. the $A is in the process of finding a major swing low following its 10-year decline from the 110 area. Our first target is the 80c area, not particularly far now, it’s only a 50% bounce of the major decline.
The underlying implications are massive for local equities if MM and our subscribers are to push ahead and outperform in the year ahead:
1 – We believe a significant part of $A strength will be because the $US breaks lower as reflation takes hold in the global economy – its been a decade but never say never!
2 – As subscribers know we believe this is the time for Value to start trumping the Growth Sector; over the last week the Banks & Resources have rallied strongly while CSL Ltd (CSL) is down -7.4%, in our opinion this is just the warning of things to come.
We urge subscribers to be flexible and openminded, while CSL for example is a great company it can certainly underperform if we experience inflation and there’s certainly enough money being pumped into the financial system by central banks to awaken this sleeping giant.
ASX200 v Australian Dollar ($A) Chart
I’m lucky enough to get a broad exposure to a lot of different market views from a wide range of sources, from our own institutional flow, fund managers coming into the office outlining their views to our own internal portfolio management teams and client feedback, while the classic Put / Call ratios, sentiment indicators etc are very useful tools to identify where periods of optimism / pessimism are becoming stretched, getting other investors thoughts / actions proves to be very useful. The bulk of what I’m getting is along the following lines:
“we will top out this week and re-test March lows in quick fashion but nobody is discussing the optimum time / level to get on board this new bull market.”
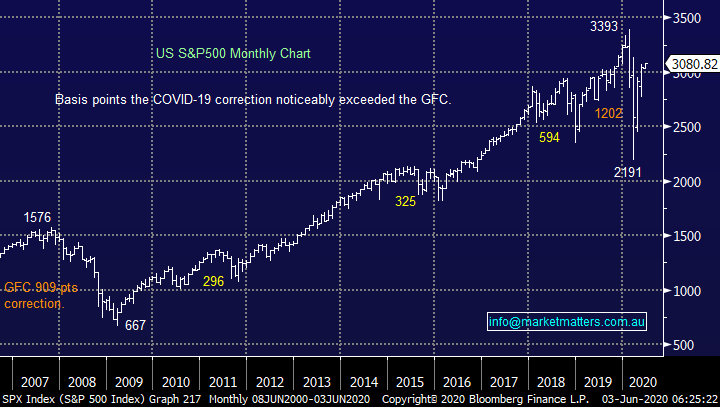
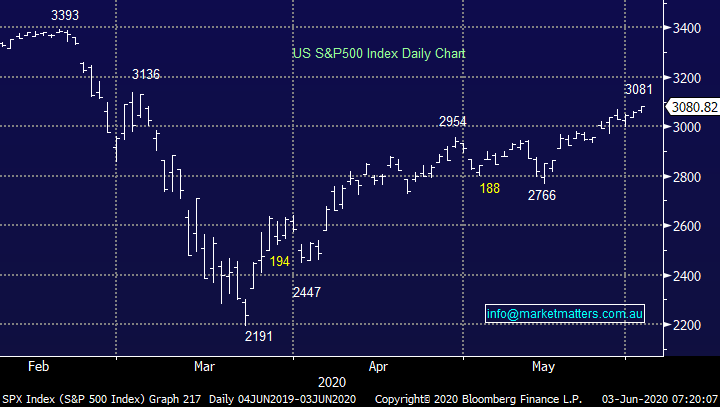
When we stand back and look at the chart of US equites over the last 15-years the coronavirus 35% correction is looking more and more like a news driven transient occurrence with no long-term effect, or in other words the best buying opportunity in over a decade!
MM remains bullish the US S&P500 initially targeting ~15% upside.
US S&P500 Index Chart
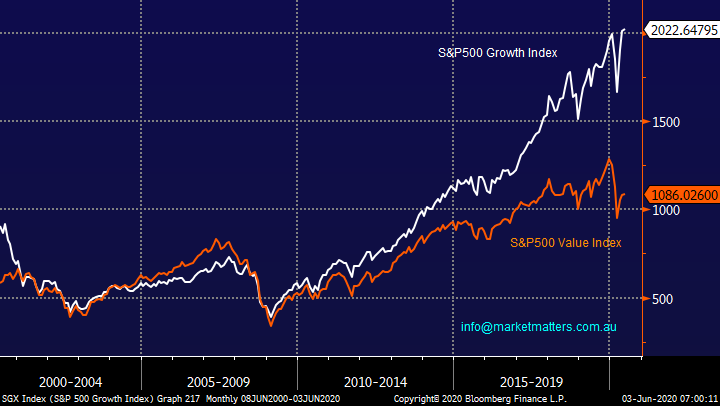
As we’ve said previously stock / sector rotation will be the name of the game moving forward assuming of course we are correct, the chart below illustrates the huge outperformance by growth stocks over the last decade as interest rates plummeted and inflation became a thing of history books. However as we keep preaching MM believes the time for rotation / mean reversion has arrived, markets are by definition all intertwined and this change should coincide with prolonged strength in the $A and bond yields rising – yes interest rates can indeed go up!
MM prefers Value to Growth over the next 12-18 months.
Please excuse the repetition of this theme but we simply believe it’s going to be so instrumental in enjoying optimal returns moving forward whereas the classic human emotion for many will be the opposite i.e. keep trying to buy relative pullbacks in growth stocks because its been the main game in town over the last decade. This doesn’t mean we’ll totally shun growth, stocks do have their own stories and we don’t put our blinkers on to those, however from a portfolio composition perspective, we will skew exposures more towards value.
US S&P500 Value & Growth Indices Chart
Overseas equities
The S&P500 continues to grind higher albeit with diminishing momentum although it Is shrugging off continued disturbing local news and a looming election which has suddenly become a 50-50-coin toss. We continue to look for a correction to the impressive advance from the March lows to aggressively buy equities, but the markets internals don’t feel right at present to chase current strength. The tech-based NASDAQ is now only 1% below its all-time high, I would be surprised to not see it scale its particular Everest before a pullback may unfold.
MM is now neutral to slightly negative US stocks in the short-term.
US S&P500 Index Chart
International Banks
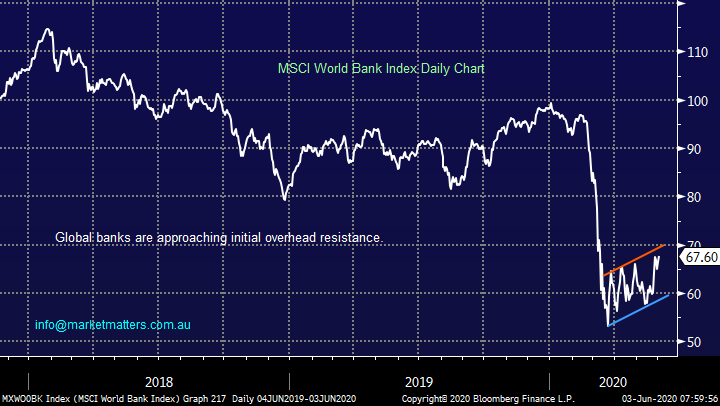
The MSCI World Banking Index has bounced well over the last week but again its approaching resistance which has contained the 3 previous recoveries, the likelihood is it will again back off even if it is building the strength to punch higher – markets are generally creatures of habit until one day the goal posts move. Hence, we wouldn’t be chasing banks at current levels but laying plans of what / where to buy does make sense.
Medium-term MM believes global banks should be accumulated into pullbacks.
MSCI World Bank Index Chart
International Materials stocks
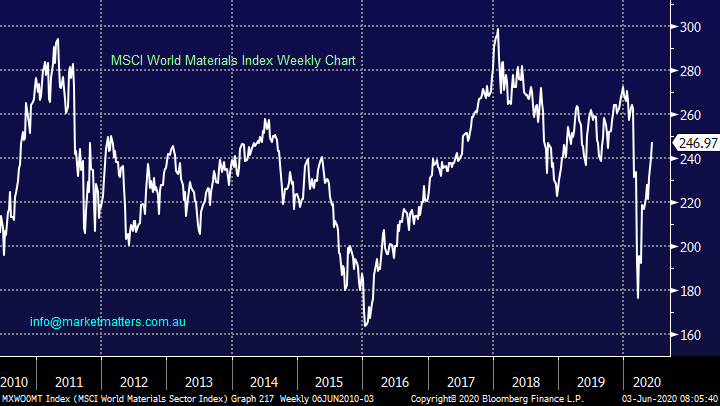
Global Material stocks have surged higher in recent weeks confirming our bullish outlook for the sector, we are looking to buy any pullbacks in this sector on the international stage and at home.
Medium-term MM is very bullish global Materials stocks.
MSCI World Materials Index Chart
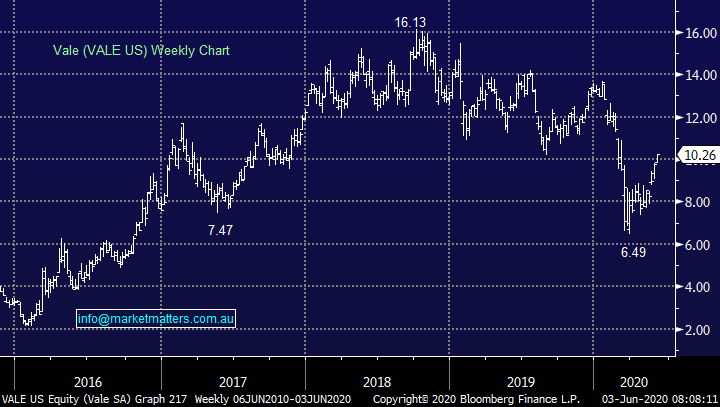
Vale is the largest producer of iron ore and nickel in the world but the stocks been suffering at the hands of COVID-19 which has threatened to grind the Brazilian country to a standstill. However as we have seen in the more developed world this virus can be managed and stocks ultimately recover.
MM is bullish Vale (VALE US) at current levels.
Vale (VALE US) Chart
Conclusions
1 - MM is looking to use our 16% cash position in our International Portfolio to increase our exposure to the Value Sector primarily via Materials and Banks.
2 – MM intends to increase our Global Macro ETF Portfolio’s exposure to the views expressed above e.g. weaker $US, rising bond yields and strong equities (medium term)
MM International Equites Portfolio
MM is looking at 2 different plays this week after taking a nice profit on United Health (UNH US) last week:
1 – Buy Vale (VALE US) at current levels – likely allocation is 6% allowing room to average a pullback but still a meaningful position if one doesn’t unfold - Watch for alerts today.
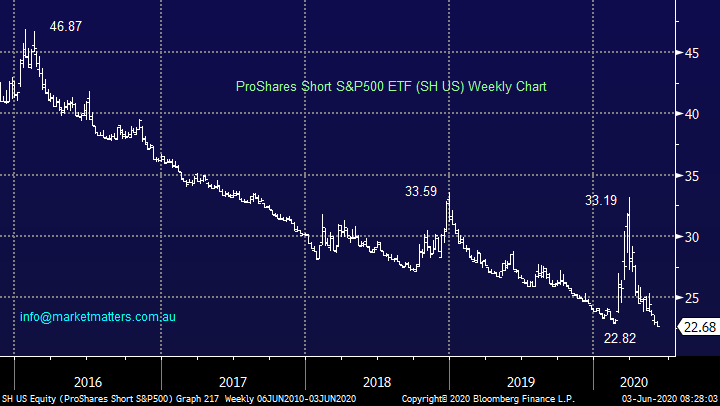
2 – Hedging our portfolio with an ETF (SH US) for a short term pullback but as discussed over recent weeks no triggers are in place just yet.
ProShares Short S&P500 ETF (SH US) Chart
MM Global Macro ETF Portfolio
No major change just here but MM is looking at 4 things:
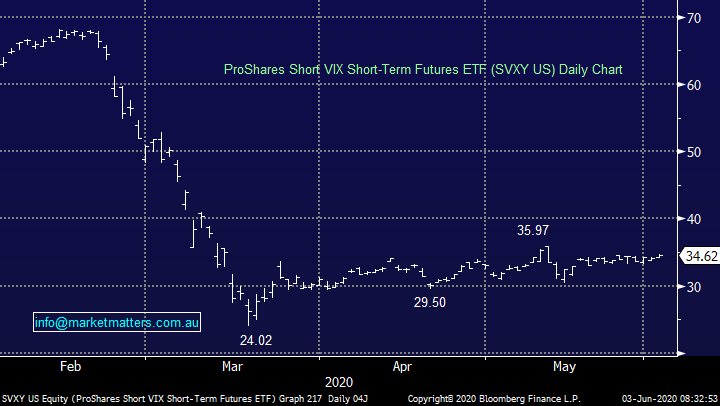
1 – Take profit on ProShares Short VIX (SVXY US) looking to re-enter at better levels.
2 – Add to our Emerging Markets ETF (IEM) position below 56.
3 – Add to our BetaShares Global Banks ETF (BNKS) now ideally below 4.50.
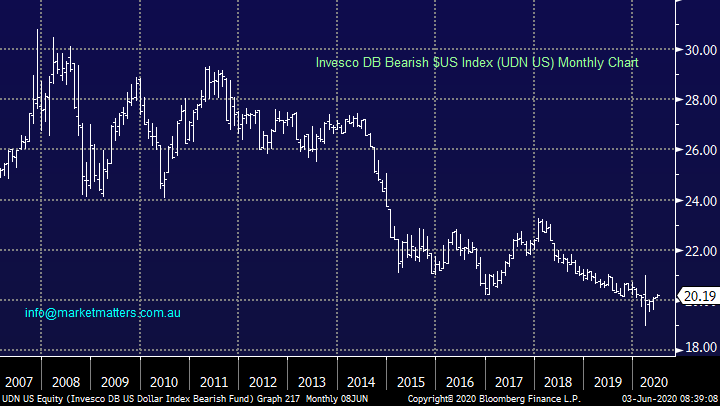
4 – Buy the Invesco DB $US Bearish Fund ETF (UDN US), again we are considering an initial 6% allocation leaving room to average a pullback -Watch for alert today.
ProShares Short VIX Futures ETF (SVXY US) Chart
Invesco DB $US Bearish Fund ETF (UDN US) Chart
Overnight Market Matters Wrap
- The US equity markets closed on their session highs overnight as the stimulus measures are being weighed in, ignoring current riots, coronavirus and the current inability to restart its economy.
- Crude oil continued to climb, currently trading at US$37.12/bbl. as positive sentiment kicks in and the VIX (Volatility) index declines.
- Locally, we will witness Australian GDP, building approvals and China Caixin PMI data pout today with all expected to be weaker than usual.
- BHP is expected to outperform the broader market after ending its US session up an equivalent of 1.93% from Australia’s previous close.
- The June SPI Futures is indicating the ASX 200 to open marginally higher, testing the 5860 level this morning.
Have a great day!
James & the Market Matters Team
Disclosure
Market Matters may hold stocks mentioned in this report. Subscribers can view a full list of holdings on the website by clicking here. Positions are updated each Friday, or after the session when positions are traded.
Disclaimer
All figures contained from sources believed to be accurate. All prices stated are based on the last close price at the time of writing unless otherwise noted. Market Matters does not make any representation of warranty as to the accuracy of the figures or prices and disclaims any liability resulting from any inaccuracy.
Reports and other documents published on this website and email (‘Reports’) are authored by Market Matters and the reports represent the views of Market Matters. The Market Matters Report is based on technical analysis of companies, commodities and the market in general. Technical analysis focuses on interpreting charts and other data to determine what the market sentiment about a particular financial product is, or will be. Unlike fundamental analysis, it does not involve a detailed review of the company’s financial position.
The Reports contain general, as opposed to personal, advice. That means they are prepared for multiple distributions without consideration of your investment objectives, financial situation and needs (‘Personal Circumstances’). Accordingly, any advice given is not a recommendation that a particular course of action is suitable for you and the advice is therefore not to be acted on as investment advice. You must assess whether or not any advice is appropriate for your Personal Circumstances before making any investment decisions. You can either make this assessment yourself, or if you require a personal recommendation, you can seek the assistance of a financial advisor. Market Matters or its author(s) accepts no responsibility for any losses or damages resulting from decisions made from or because of information within this publication. Investing and trading in financial products are always risky, so you should do your own research before buying or selling a financial product.
The Reports are published by Market Matters in good faith based on the facts known to it at the time of their preparation and do not purport to contain all relevant information with respect to the financial products to which they relate. Although the Reports are based on information obtained from sources believed to be reliable, Market Matters does not make any representation or warranty that they are accurate, complete or up to date and Market Matters accepts no obligation to correct or update the information or opinions in the Reports. Market Matters may publish content sourced from external content providers.
If you rely on a Report, you do so at your own risk. Past performance is not an indication of future performance. Any projections are estimates only and may not be realised in the future. Except to the extent that liability under any law cannot be excluded, Market Matters disclaims liability for all loss or damage arising as a result of any opinion, advice, recommendation, representation or information expressly or impliedly published in or in relation to this report notwithstanding any error or omission including negligence.


