Will the Fund Managers catch up to equities? (CBA, NAB, XRO, TTD US, PPT, PTM, PNI, PDL, IFL)
The ASX200 surprised on the upside yesterday as the early strength in our heavyweight Resources Sector was compounded by some excellent follow through buying in the “Big Four” Banks who rallied an average of +4.3% ultimately taking the index to an impressive +106-point / 1.8% gain. MM’s big call for the next 12-18 months has certainly gained momentum recently as the Banks and Resources continue their stellar gains while the Healthcare Sector struggles e.g. over the last month ANZ Bank (ANZ) is up +20%, BHP Group (BHP) +21.8% while CSL Ltd (CSL) has fallen -5%. I wouldn’t be surprised to see the previous “go to” sectors of the market attempt a relative performance recovery again in June, but we believe this move would be one to fade.
MM remains committed to our view that the likes of Banks, Resources & Building stocks will outperform over the next 12-months.
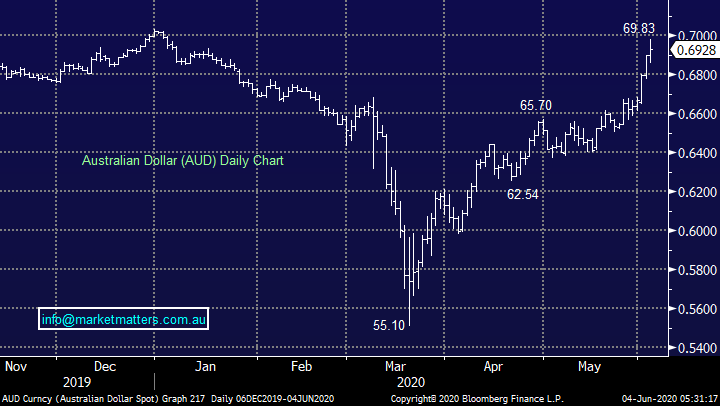
Our bullish $A call is starting to get noticed with some of the $US earners dragging their heels at times but I don’t believe “the market” is yet convinced this rally is sustainable, this could become another surprise market transformation in the relatively near future. Psychologically a clear rally above 70c might be needed to get a few fund managers pressing this particular switch button but it’s just a matter of time in our opinion.
Yesterday we saw Treasurer Josh Frydenberg declare Australia was in a recession for the first time in 29-years following data which showed the economy contracted -0.3% in the March quarter – no surprises there! However if we take into account the bushfires plus the start of the unforeseen COVID-19 pandemic and the end of the period, the number was not too bad, the annual growth rate is now at 1.4% but of course the June quarter will be worse given the shutdowns hence the talk the talk of recession now (official definition of a recession is 2 quarters of consecutive contraction).
However, as things start to spring back to life courtesy of a better health outcome to date plus huge government stimulus, the RBA’s call in May for a 2% drop in the March quarter and a 10% decline from peak to trough is proving way too pessimistic – the markets saying a recession, like COVID-19, will be in the rear view mirror by 2021.
Interestingly the $A initially surged towards70c on the GDP data yesterday only to drift lower, a period of consolidation around the big 70c region would not surprise, if markets are going to maintain their 2020 rhythm equities should in theory be also be approaching a period of consolidation.
MM remains bullish both the ASX200 and $A medium-term.
Australian Dollar ($A) Chart
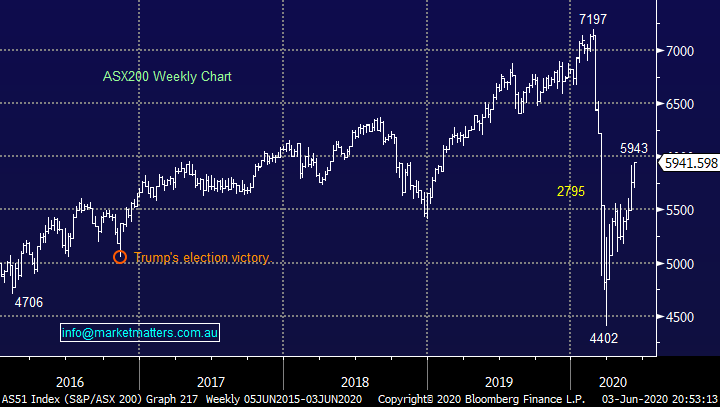
Local stocks have now rallied 35% from their panic March lows, a superb performance on any metric. The strength in early June is testing our short-term cautious note, undoubtedly we will see another 500-point pullback in 2020, it’s how market roll but 5500 is now looking like a brick wall of support and by definition the higher we rally the higher the likely correction target becomes. The banks which comprise over 20% of the ASX200 will have a huge influence on the run into Christmas and at this stage they look good and importantly “under-owned” which is likely to see further squeezes on the upside.
The US is following our markets sector rotation e.g. overnight the healthcare was the only one of the 11 sectors to fall while the financials surged ~4% higher. We continue to look for opportunities in the market which MM feel still offers excellent risk / reward after the strong market gains.
MM remains bullish equities medium-term.
ASX200 Index Chart
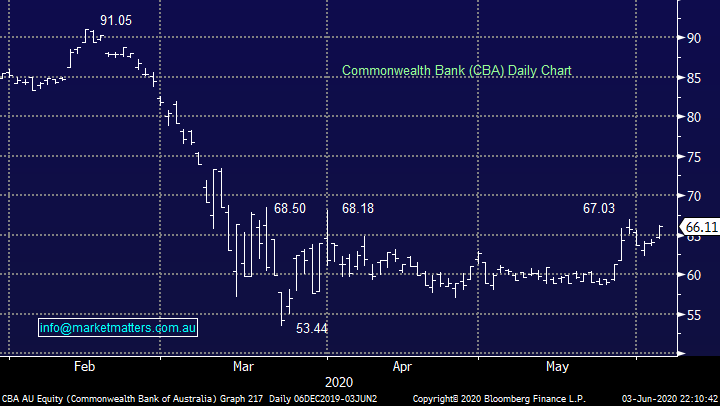
The banks enjoyed a great Wednesday with CBA taking its gain for the month to +12.4%, less than some of its peers but it didn’t suffer as mercifully in March. The bank is forecast to cut its next August dividend but it still looks likely to be yielding well above 5% fully franked, with unfranked term deposits sitting below 2% its easy to comprehend CBA rallying another 10% in quick fire time.
With a global economic recovery now feeling increasingly likely and local things clearly not as bad as many including ourselves feared the banks look really well position – we’re becoming more positive by the day, similar to the market! Remember one of our summary points from the MM Income Report yesterday:
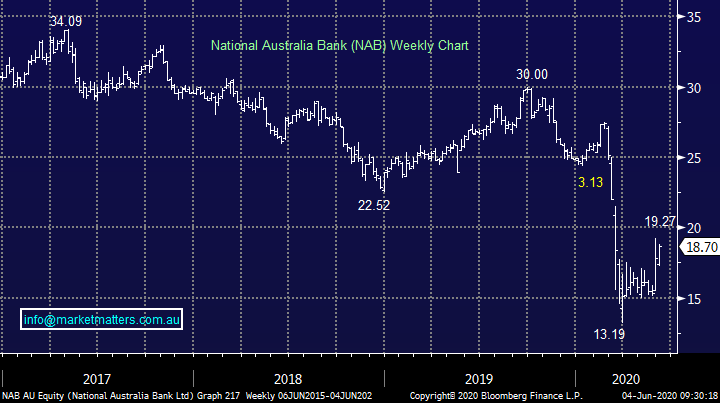
ANZ, NAB & WBC share prices will recover ~40% back to mid-$20’s / CBA will trade mid $80’s, which is a solid bounce across the board, however that’s likely to be as good as it gets. Loan growth to remain subdued offset by lower bad debts.
Those are clearly very attractive capital gains before we even consider the dividends that are likely to start flowing relatively soon.
MM remains comfortably long Westpac and CBA.
Commonwealth Bank (CBA) Chart
At MM we are holding basically market weight exposure to the Australian banks through CBA and WBC in our Growth Portfolio plus a decent position in Macquarie Group.
We are bullish the banks as discussed yesterday in the MM Income Note and intend to upweight in the sector across both portfolios.
MM is considering buying NAB.
*watch for alerts.
NAB Chart
Overseas markets
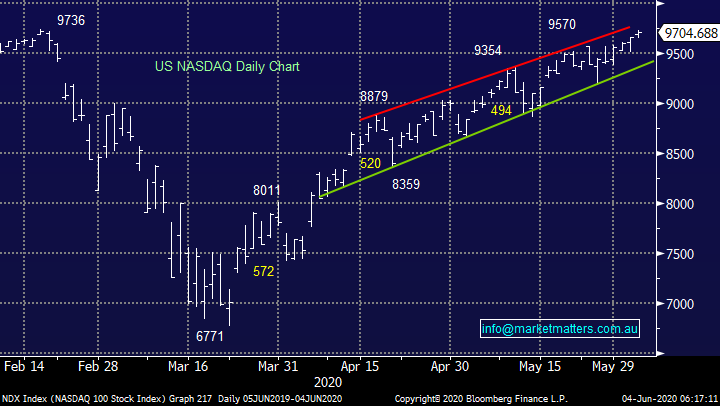
US stocks enjoyed another great session with the S&P500 rallying over +1.3% but with the financials leading the charge it was the tech-based NASDAQ who dragged the chain gaining less than +0.5%. MM believes this underperformance will become commonplace now the sector has regained all of their coronavirus losses, investors are looking for “cheap” stocks / sectors not situations where the horse has bolted.
MM remains bullish global stocks medium-term but short-term they still feel “rich” or vulnerable to a pullback.
NB our rich call short-term is feeling a touch long in the tooth but as we can see below the NASDAQ’s upside momentum is clearly waning.
US NASDAQ Index Chart
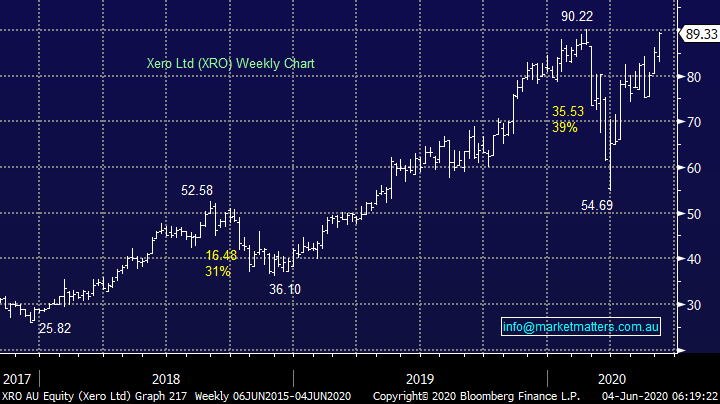
Tech stocks are testing their all-time highs and as we’ve discussed previously MM is not targeting this area of the market to allocate new money. We currently hold Xero (XRO) in the Growth Portfolio which this morning is likely to hit our initial target of new all-time highs showing a ~30% paper profit in the process. To be a successful investor over time requires constant self-evaluation, having the mind set to challenge how we’ve traditionally done things, and this morning we’re going to show patience in this position.
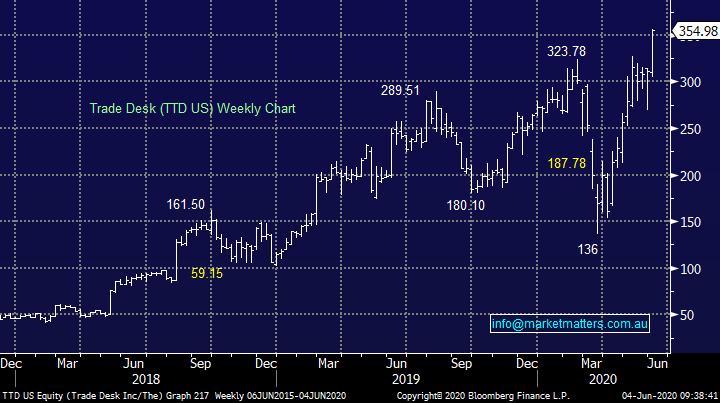
Hence, despite the stock hitting our target we’re not going to take our profits, we’re going to let it run given the stock has very strong momentum, just look at The Trade Desk (TTD) is the US overnight as a guide to see how we believe XRO will trade.
MM is going to hold XRO in MM Growth Portfolio.
Xero (XRO) Chart
The Trade Desk (TTD) Chart
Is time to reconsider local fund managers?
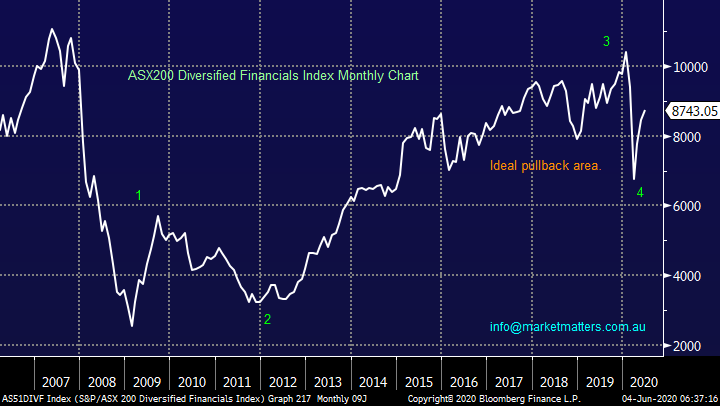
Firstly, note we are going to look briefly at 5 “Fund Managers” who have domestic focus because our 2 macro views that value will outperform growth and the $A rallies suggests that theoretically it’s not the ideal time to be chasing the likes of Magellan (MFG), even though they have proved to be a quality company. We showed the chart below months ago with our “ideal pullback area” clearly highlighted in orange, so far so good and if we are correct this index is going to make / test fresh new all-time highs!
MM is bullish the Australian Diversified Financials.
NB This index includes no banks other than Macquarie Group (MQG).
ASX200 Diversified Financials Index Chart
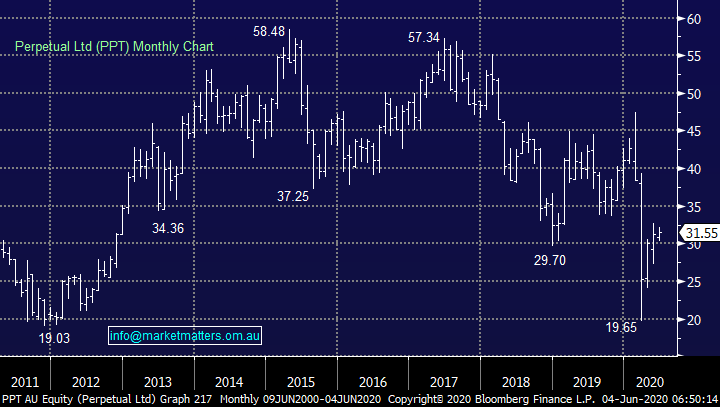
1 – Perpetual (PPT) $31.55
Wealth manager PPT has struggled over the last 5-years like much of the sector but it yields strongly hence its position in our Income Portfolio. Markets have been tough for value managers like PPT but their half year report in February showed improving trends. Importantly, PPT has more diversity than a traditional fund manager with a trustee business along with a wealth management operation.
As markets recover and some valuations become very stretched on current earnings, PPT remains decent value trading on ~15x. We are targeting a move back towards $45
MM likes PPT at current levels.
Perpetual (PPT) Chart
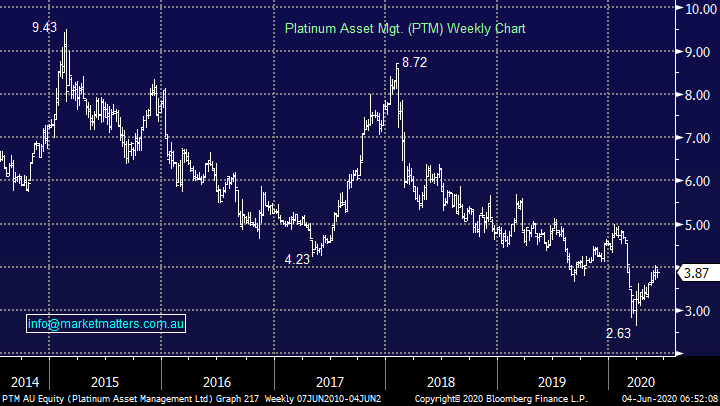
2 – Platinum Asset Mgt. (PTM) $3.87
PTM has been a real laggard since the retirement of Kerr Neilson and subsequent cash outflows / stock sell downs by the former CEO. Mr Neilson and his wife still have a huge holding in the business which creates a major overhang on the stock.
MM is neutral PTM.
Platinum Asset Mgt. (PTM) Chart
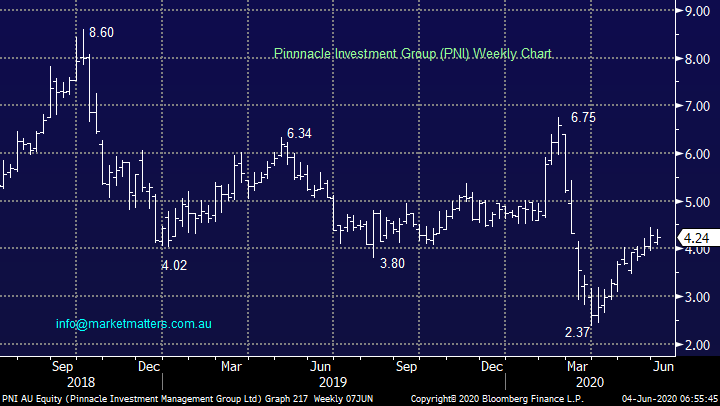
3 – Pinnacle Investment Group (PNI) $4.24
We have used some poetic licence including PNI in this list because it offers investment management services as opposed to being an actual fund manager perse i.e. it provides a platform + it invests in fund managers like Metrics who run MXT which we hold in the income portfolio.
The stock was surging in February following a strong first half year result which showed a 32.6% lift in revenue. While the goal posts have clearly been moved slightly since the pandemic, we can still see a test of $6 by PNI. On current valuations this stock is not cheap compared to traditional fund managers but a fully franked yield forecast to now be around 3.3% is ok in today’s environment.
MM likes PNI with an ideal buy area ~$3.60.
Pinnacle Investment Group (PNI) Chart
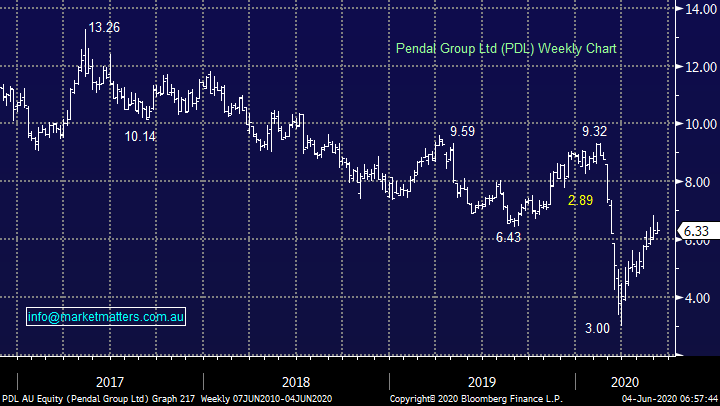
4 – Pendal Group (PDL) $6.33
Investment manager PDL has significant exposure to the UK which is not our preferred macro scenario although it benefits from a weaker $A against the Pound. We held this stock before and cut it to go into MFG which we subsequently sold for a nice profit.
While PDL still looks good for further gains from current levels this is not our first choice for a sector play given the geography and composition of their earnings base
MM likes PDL as a trade but that’s as good as it gets
Pendal Group (PDL) Chart
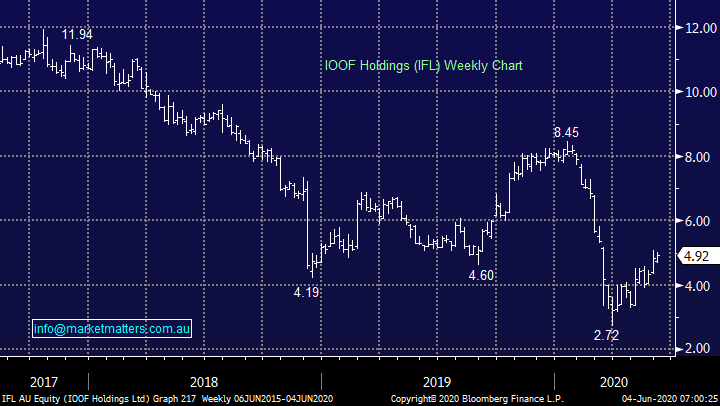
5 – IOOF Holdings (IFL) $4.92
IFL is a turnaround story after they made a very ill-timed acquisition of ANZ’s wealth business plus they handled the intense regulatory scrutiny very poorly, although they’ve enjoyed some recent success in the courts.
A month ago they announced Funds Under Management (FUM) had increased by 34.2% to $195.6bn, although obviously boosted by the acquisition of ANZ’s wealth business, it still did beat expectations.
This is a cheap stock (12x) paying 7% fully franked. While it has challenges, it also has a strong path to recovery.
MM likes IFL with an ultimate target over 50% higher.
IOOF Holdings (IFL) Chart
Conclusion (s)
MM likes the Diversified Financials over the next 12-months with our top picks on a risk / reward basis being IOOF (IFL), Perpetual (PPT), Pinnacle (PNI) and Pendal (PDL).
We are likely to consider 2 stocks for sector exposure as opposed to putting all our eggs in one basket due to the occasional hand grenade the sector has tossed over recent years.
We are likely to increase our bank weights via NAB
Overnight Market Matters Wrap
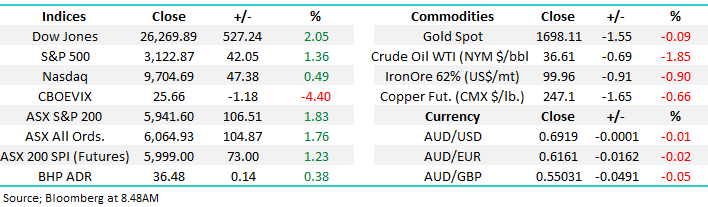
- The US equity markets continued to ignore current negatives of local riots, coronavirus and US-China tensions, and focused on current data, with May non-manufacturing data printing above expectations.
- Metals on the LME were mixed, iron ore with little change and crude oil continuing to recover after OPEC+ countries continue to encourage each to stick to supply cuts.
- Locally, investors wait for the April Trade balance and retail sales data at 11.30am to determine whether risk should also be on here and what the actual impact has been with the coronavirus in our natio
- The June SPI Futures is indicating the ASX 200 to open 58 points higher, testing the 6000 level this morning.
Have a great day!
James & the Market Matters Team
Disclosure
Market Matters may hold stocks mentioned in this report. Subscribers can view a full list of holdings on the website by clicking here. Positions are updated each Friday, or after the session when positions are traded.
Disclaimer
All figures contained from sources believed to be accurate. All prices stated are based on the last close price at the time of writing unless otherwise noted. Market Matters does not make any representation of warranty as to the accuracy of the figures or prices and disclaims any liability resulting from any inaccuracy.
Reports and other documents published on this website and email (‘Reports’) are authored by Market Matters and the reports represent the views of Market Matters. The Market Matters Report is based on technical analysis of companies, commodities and the market in general. Technical analysis focuses on interpreting charts and other data to determine what the market sentiment about a particular financial product is, or will be. Unlike fundamental analysis, it does not involve a detailed review of the company’s financial position.
The Reports contain general, as opposed to personal, advice. That means they are prepared for multiple distributions without consideration of your investment objectives, financial situation and needs (‘Personal Circumstances’). Accordingly, any advice given is not a recommendation that a particular course of action is suitable for you and the advice is therefore not to be acted on as investment advice. You must assess whether or not any advice is appropriate for your Personal Circumstances before making any investment decisions. You can either make this assessment yourself, or if you require a personal recommendation, you can seek the assistance of a financial advisor. Market Matters or its author(s) accepts no responsibility for any losses or damages resulting from decisions made from or because of information within this publication. Investing and trading in financial products are always risky, so you should do your own research before buying or selling a financial product.
The Reports are published by Market Matters in good faith based on the facts known to it at the time of their preparation and do not purport to contain all relevant information with respect to the financial products to which they relate. Although the Reports are based on information obtained from sources believed to be reliable, Market Matters does not make any representation or warranty that they are accurate, complete or up to date and Market Matters accepts no obligation to correct or update the information or opinions in the Reports. Market Matters may publish content sourced from external content providers.
If you rely on a Report, you do so at your own risk. Past performance is not an indication of future performance. Any projections are estimates only and may not be realised in the future. Except to the extent that liability under any law cannot be excluded, Market Matters disclaims liability for all loss or damage arising as a result of any opinion, advice, recommendation, representation or information expressly or impliedly published in or in relation to this report notwithstanding any error or omission including negligence.


