Retail Sales plunges -17.7%, stocks are clearly looking forward (TCL, APX, APE, HVN, WEB, BAP, SUL)
**Please note: There will be no Weekend Report this long weekend, I’m heading up the coast for a few days R & R. We will be back on Tuesday and will answer Subscriber Questions**
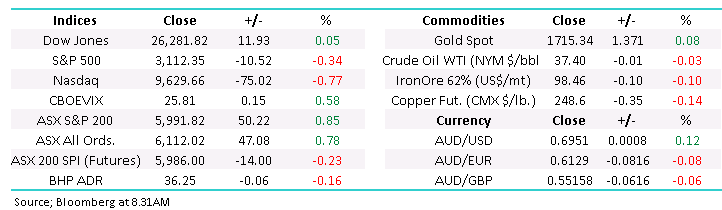
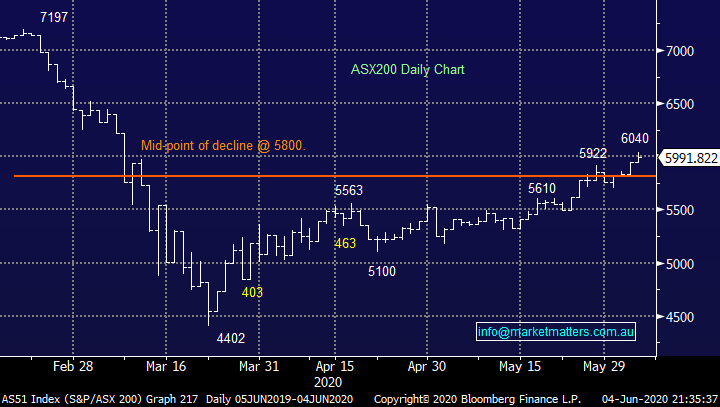
The ASX200 continued its strong June advance yesterday rallying another 50-points breaking above the psychological 6000 barrier early in the session and making fresh 3-month highs in the process, it finally closed the day just shy of the round number. Gains by the in-vogue financials were partially offset by some weakness in the Building, Energy, and IT names. The market was starting to feel a little tired throughout the day and over 40% of the index finally closed lower which reaffirmed the diminishing upside momentum – time for a rest perhaps?
I discuss this view in a quick 5 min recording today, specifically touching on a very prevalent question I’ve had this week: Should I chase this rally?

On the economic front we saw Retail Sales for April plunge by -17.7%, they were always going to be very bad, it was just a matter of how bad. While the print was the worst month on month decline ever recorded it was actually better (just) than the -17.9% that was forecast, the lack of blowout was enough to push the sector higher, one that we will revisit in today’s report as the nadir of shopping activity appears to be in the rear view mirror. We should also mention that many believe a significant part of the drop came because of the spike in March courtesy of panic buying, remember the toilet roll saga!
While the market might feel in need of a rest it doesn’t mean MM is in “sell mode”, we remain focused on picking an ideal level to increase our market exposure, my best guess at present is ~5700 for the ASX200. However, it’s not a perfect science because stocks / sectors do not move as one, we are simply looking for opportune risk / reward area to increase our market exposure i.e. we are looking to accumulate into weakness as opposed to chasing strength just here.
MM remains bullish equities medium-term.
ASX200 Index Chart
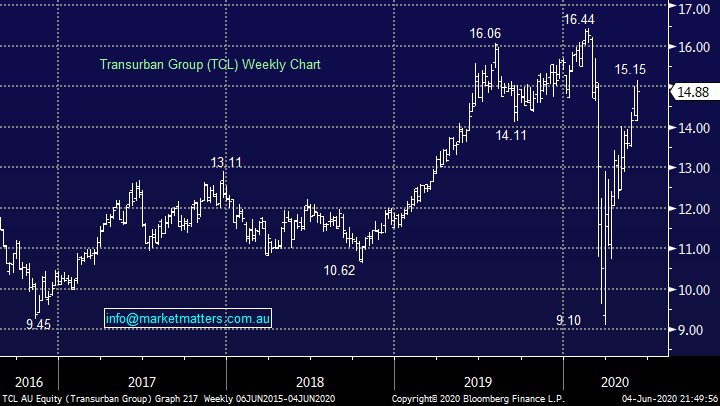
One thing that caught my eye yesterday was a little selling / profit taking creeping into the traditional “yield play” stocks like Transurban (TCL) they feel ripe for a pullback as bond yields continue to firm. We own TCL in our Income Portfolio from sub $12 which feels pretty good this morning, like the market the toll road operator feels in need of a rest but we still believe its headed to fresh highs up towards $17.
MM is bullish TCL with the risk / reward currently looking attractive sub-$14.
Transurban (TCL) Chart
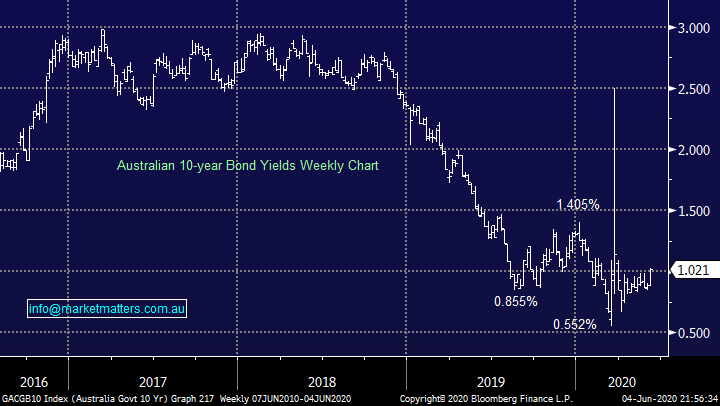
Australian 10-year bond yields reclaimed the 1% level yesterday as the Australian economy continues to perform far better than many feared during the eye of the COVID-19 storm. At MM we are initially targeting an assault on the 1.5% area which is simply where yields were earlier in the year but it’s a whopping 50% above todays levels.
Rising bond yields should continue to see the Banking Sector outperform the “Yield Play” stocks for the first time in many years.
MM remains bullish bond yields over the next 12-18 months.
Australian 10-year Bond Yields Chart
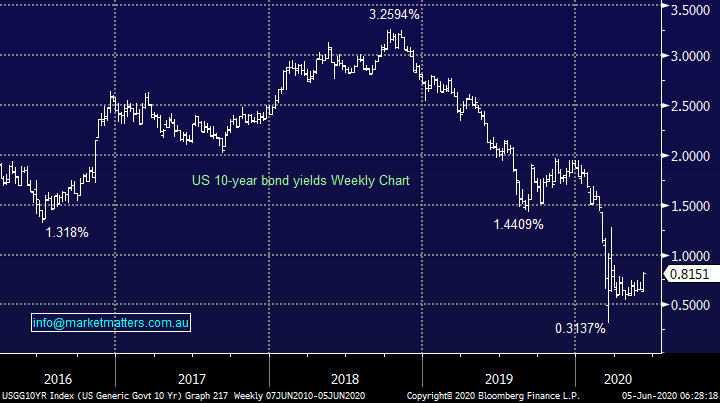
Overnight US 10-year bond yields cracked through 0.8% in a similar manner to what we expect to unfold locally.
Note Australian bond yields are now over 20% above their US peers illustrating why we are seeing some strong buying in the $A, its simply where you’ll earn more interest on your money.
US 10-year Bond Yields Chart
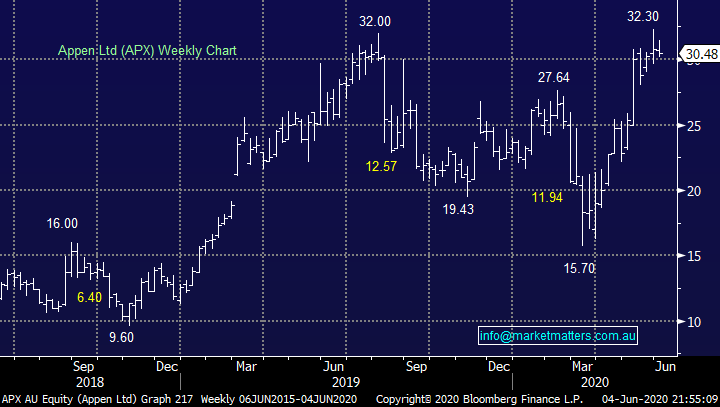
Yesterday saw healthy profit taking by a few members of the board of artificial intelligence data provider Appen (APX), they cited both a “number of personal reasons” and the directors favourite “tax obligations”. Whatever the reason I don’t believe shareholders should mind a little profit taking by the people who’ve steered this ship to all-time highs only a few months after the coronavirus pandemic. If this selling leads to a decent pullback in the shares, we believe the risk / reward becomes attractive around $29 but we would utilise stops under $27 just in case there’s a more sinister reason for the selling bubbling below the surface.
MM likes APX under $29, 10% below its all-time high.
Appen (APX) Chart
Overseas markets
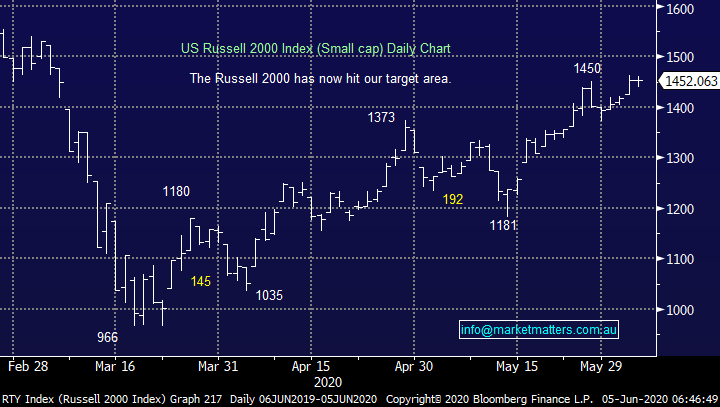
US stocks had a mixed night for a change with the tech-based NASDAQ slipping -0.8% while the Dow managed to close marginally higher, we see zero sell signals but just like our own index its feeling a little tired on the upside.
MM remains bullish global stocks medium-term but short-term they still feel “rich” or vulnerable to a pullback.
US Russell 2000 (small cap) Index Chart
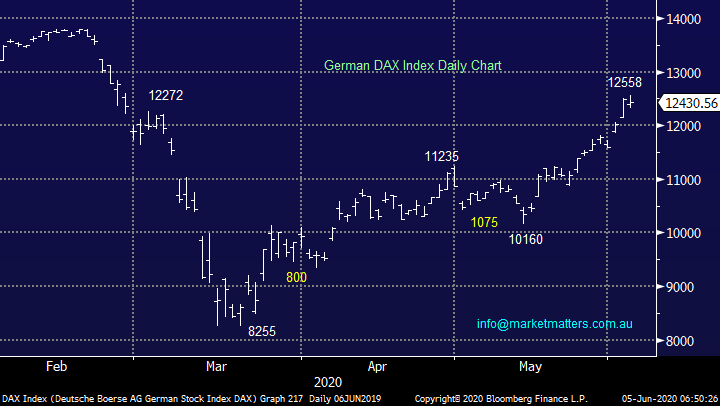
European stocks have enjoyed a very strong few weeks like our own ASX, this should be no surprise because as we often point out Australian stocks are far more correlated to Europe than the US. Importantly the European picture is evolving in a far more bullish scenario than we anticipated back in mid-May. We can see a period of consolidation unfolding between 12,000 and 13,000 over the coming weeks but the index looks very bullish with a break of 14,000 / 12% higher appearing to be just a matter of time – a great indicator for the ASX.
MM is neutral the German DAX at current levels.
German DAX Chart
Is the Retail Sector getting ahead of itself?
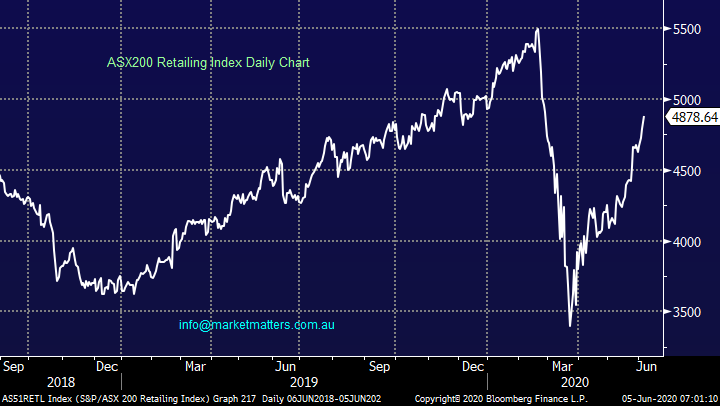
The recovery by the local Retailing Index has been nothing short of extraordinary when we consider the ramifications of the countrywide lockdown throughout the virus outbreak, with the exception of on-line offerings the sector has been closed for business. The 44% recovery in the sector has outperformed the ASX which would be a surprise to some, however After Pay (APT) is now a large constituent in the index and that stock has been on fire. That said, I still find this a surprising thematic, my “Gut Feel” is / was the average very indebted Australian would batten down the hatches slightly and pay down debt but the sectors telling us its off to the shops!
We remain bullish the ASX but I cannot see the catalyst for the Retailing Index to maintain its outperformance but “fighting the tape” is statistically a mugs game hence while the stocks remain strong MM will not be adverse to taking a position in at least one retailer in the growth portfolio if the correct opportunity presents itself. We already own Super Retail (SUL) and Wesfarmers (WES) in the income portfolio.
MM is bullish the Australian Retailing Index Medium-term, but we will pick our mark (s) carefully.
ASX200 Retailing Index Chart
Today MM has briefly looked at the strongest 5 stocks in the sector over the last month as we consider if / what MM might consider into a pullback.
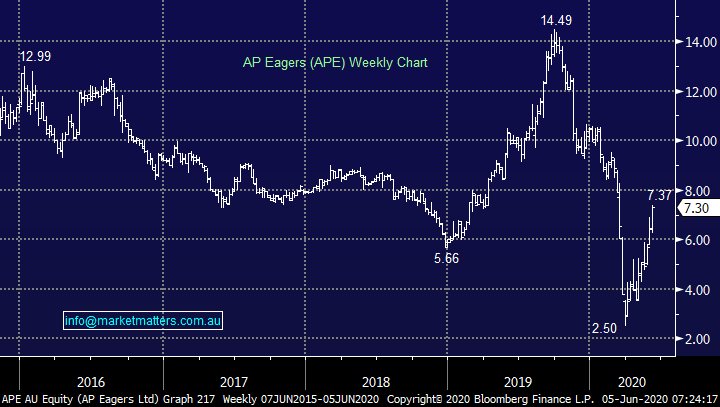
1 – AP Eagers (APE) $7.30
APE is responsible for the sale of 1 in every 10 new vehicles in Australia with 224 new car dealerships across 33 different brands. They also have a large truck dealership network with 68 dealerships across 12 brands. It’s a big operation and APE are the clear dominant player in the Australian market. The near-term tailwinds for APE are obvious, as Australian’s drive more to work, holiday domestically at a time when interest rates are at record lows, there is a clear case for a rebound in new car sales.
The stock has bounced well from its lows but the decline from its 2019 high illustrates the headwinds facing the industry – Aprils almost 50% plunge in sales we believe should be regarded as COVID-19 blip but the previous constantly declining 2-years of sales is the concern. Technically the stock looks ok back towards $6 but overall, this is not an area where the risk / reward excites me just yet.
MM would become more bullish APE nearer $6.
AP Eagers (APE) Chart
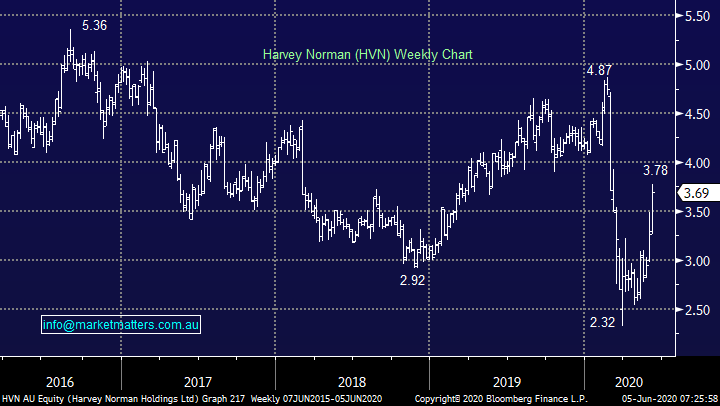
2 – Harvey Norman (HVN) $3.69
HVN is a household name most of us have used over the years, it’s had an understandably tough 2020 as discretionary spending has been curtailed by the majority. We like HVN’s varied income streams and the likely increasing home office set up spend is a clear help but we aren’t chasers of strength but back around $3.50, or 10% below its recent highs, HVN will offer some good risk / reward.
MM looks interesting below $3.50.
Harvey Norman (HVN) Chart
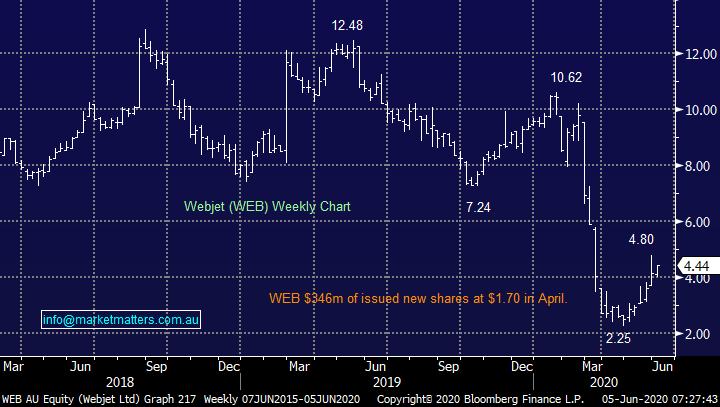
3 – Webjet (WEB) $4.44
After WEB issued a huge $346m worth of stock in April in what can be described as a desperate capital raise at $1.70. Amazingly taking into account this raise, shares traded within 5% of its all-time time high last week, way too rich for us.
MM is neutral WEB.
Webjet (WEB) Chart
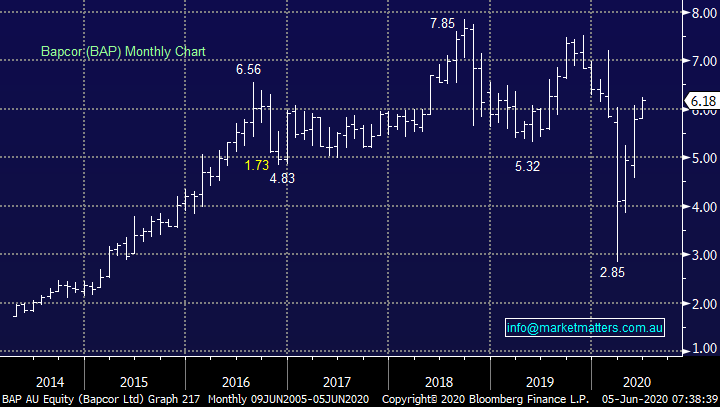
4 – Bapcor (BAP) $6.18
Automotive parts retailer BAP will also benefit from the increased use of cars, the company recently raising ~$240m which provides the business with the capital to execute its 5-year growth strategy including a move into Thailand and Asia. We believe this a strong business that was performing well before the pandemic and a $8 target is realistic hence any pullback below $6 looks to be a great buying opportunity.
MM likes BAP around $5.60.
Bapcor (BAP) Chart
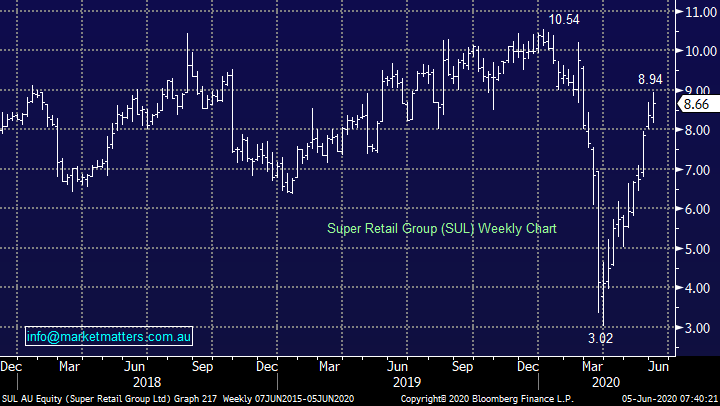
5 – Super Retail Group (SUL) $8.66
SUL is a major player in Australia Retail Sector which includes BCF, Rebel and Supercheap Auto amongst its brands. This is another domestic retail operation which MM believes can make fresh highs above $11 over the next 12-months, our ideal buying level is currently around $8. We particularly like that SUL only has 20% of its retail fronts in shopping malls thus reducing its dependency on this older style method of shopping.
MM likes SUL back around $8.
NB We already own SUL in our Income Portfolio.
Super Retail Group (SUL) Chart
Conclusion (s)
MM likes Bapcor (BAP) and Super Retail Group (SUL) in the Retailing Sector but ideally both at lower levels.
Overnight Market Matters Wrap
- The US equity markets finished off their lows, however with the broader S&P 500 ended a four-day winning streak. Investors noted the S&P 500 had its biggest 50-day rally (+39.3%) in over 75 years and are trying to reconcile that with the weak economic backdrop.
- Initial claims for unemployment benefits fell but were still higher than consensus. All eyes will be on US nonfarm payrolls tonight. Expect to see unemployment at close to 20%.
- Metals on the LME were mixed, with nickel a notable loser, down 0.7%. Iron ore fell and couldn’t hold the $US100/t level while crude oil eked another small gain while gold bounced after a couple of weak days.
- The June SPI Futures is indicating the ASX 200 to open marginally lower, testing the 5985 level this morning.
Have a great day!
James & the Market Matters Team
Disclosure
Market Matters may hold stocks mentioned in this report. Subscribers can view a full list of holdings on the website by clicking here. Positions are updated each Friday, or after the session when positions are traded.
Disclaimer
All figures contained from sources believed to be accurate. All prices stated are based on the last close price at the time of writing unless otherwise noted. Market Matters does not make any representation of warranty as to the accuracy of the figures or prices and disclaims any liability resulting from any inaccuracy.
Reports and other documents published on this website and email (‘Reports’) are authored by Market Matters and the reports represent the views of Market Matters. The Market Matters Report is based on technical analysis of companies, commodities and the market in general. Technical analysis focuses on interpreting charts and other data to determine what the market sentiment about a particular financial product is, or will be. Unlike fundamental analysis, it does not involve a detailed review of the company’s financial position.
The Reports contain general, as opposed to personal, advice. That means they are prepared for multiple distributions without consideration of your investment objectives, financial situation and needs (‘Personal Circumstances’). Accordingly, any advice given is not a recommendation that a particular course of action is suitable for you and the advice is therefore not to be acted on as investment advice. You must assess whether or not any advice is appropriate for your Personal Circumstances before making any investment decisions. You can either make this assessment yourself, or if you require a personal recommendation, you can seek the assistance of a financial advisor. Market Matters or its author(s) accepts no responsibility for any losses or damages resulting from decisions made from or because of information within this publication. Investing and trading in financial products are always risky, so you should do your own research before buying or selling a financial product.
The Reports are published by Market Matters in good faith based on the facts known to it at the time of their preparation and do not purport to contain all relevant information with respect to the financial products to which they relate. Although the Reports are based on information obtained from sources believed to be reliable, Market Matters does not make any representation or warranty that they are accurate, complete or up to date and Market Matters accepts no obligation to correct or update the information or opinions in the Reports. Market Matters may publish content sourced from external content providers.
If you rely on a Report, you do so at your own risk. Past performance is not an indication of future performance. Any projections are estimates only and may not be realised in the future. Except to the extent that liability under any law cannot be excluded, Market Matters disclaims liability for all loss or damage arising as a result of any opinion, advice, recommendation, representation or information expressly or impliedly published in or in relation to this report notwithstanding any error or omission including negligence.


