Overseas Wednesday – International Equities & Global Macro ETF Portfolios (CSL)
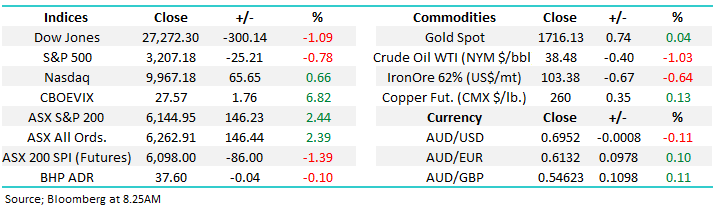
The ASX200 charged out of the blocks after the long weekend closing up +146-points / 2.4%, following the extremely bullish 2-day lead from Wall Street. The local index was driven higher by the influential Banking Sector which enjoyed all of the “Big 4” advance over 5% while Energy & Resources help compound the gains, conversely the Healthcare and IT sectors closed down on the day – remember MM is bullish value over growth into 2021. Conversely under the hood the markets internals were disappointing for such a strong day with almost a quarter of the market closing in the red.
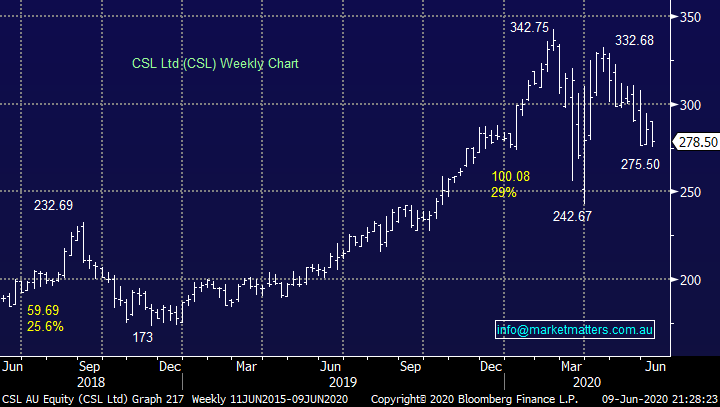
Weakness was particularly evident in a number of $US earners which should come as no surprise with the $A spending most of the afternoon above 70c, reaching its highest level since July 2019. We remain bullish the $A at MM targeting a test of 80c in the foreseeable future which is likely to see further under performance from a number of complacently owned names like CSL Ltd (CSL) and ResMed (RMD) both of who have already endured a tough month. However, in the short-term after falling more than -15% while for example CBA has rallied over +25% some mean reversion would not surprise but over the next year we believe this new found outperformance by the banks has much further to unfold.
Overall this fits our view that the moves experienced across financial markets during May & June are the start of bigger things but when we see the $A rally over 27% in just a few weeks a period of consolidation / a pullback is to be expected even for the most bullish of markets.
MM continues to see another 10% downside in CSL medium-term.
CSL Ltd (CSL) Chart
The fact the ASX200 has now reclaimed 64% of its losses since February sounds good but not as exciting when we consider the US tech-based NASDAQ has already made fresh all-time highs this week. Yesterday’s surge added weight to our feeling that the local market would spend the coming weeks between 6000 and 6500 with an upside bias. Considering our preference for value stocks over growth moving forward the ASX should also finally enjoy some relative time in the sun on a global comparison with our indexes’ heavy weighted bias towards banks & resources.
There is no change with our 2 core views moving forward which I have deliberately repeated word for word from last week:
1 – MM remains bullish global equities for the next 12-18 months.
2 – MM believes we are in the very early stages of a major rotation into value stocks from the currently in vogue growth stocks such as the IT and Healthcare Sectors.
ASX200 Index Chart
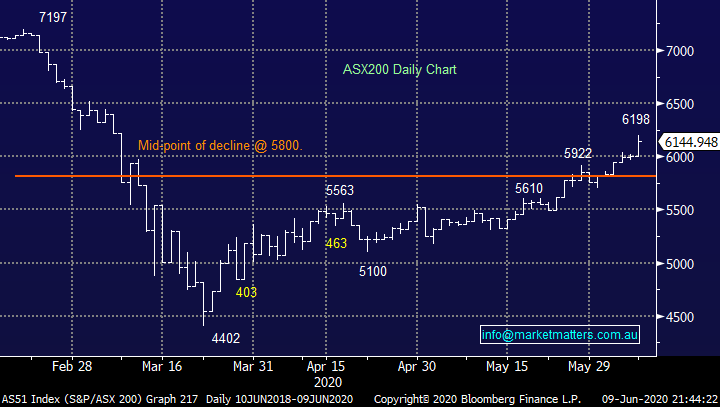
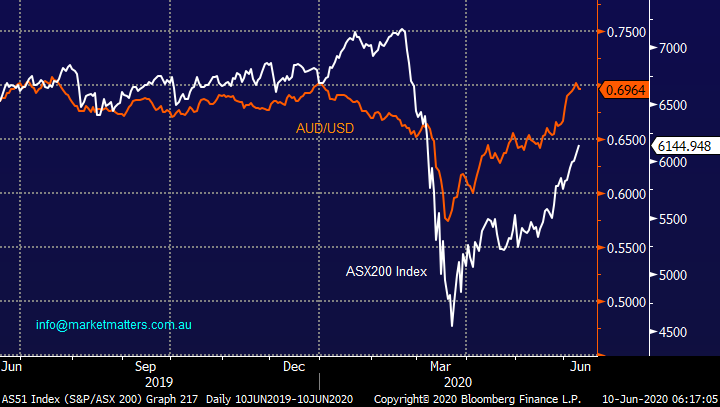
The $A broke above 70c yesterday trading at its highest level in about a year. We have used the outperformance of the $A over the ASX as a key indicator that local stocks would trade higher into the EOFY but I would caution that the gap is slowly starting to close implying we may be close to some consolidation by equities, we feel another 500-point correction is likely in the coming months but that would only become a relatively minor blemish in the ASX200’s almost 1800-point rally from the panic lows in March.
We remain bullish medium-term both stocks and the $A but the air is becoming thin for both after such a strong / rapid advance hence we wouldn’t be chasing either at this point in time.
In our opinion the “Little Aussie Battler” is showing the way ahead for stocks and it remains up.
ASX200 v Australian Dollar ($A) Chart
The arguments for a correction for stocks both fundamentally and technically is gathering momentum but we reiterate our belief that any decent pullback in risks assets over the coming months would be a buying opportunity. Some examples that may interest readers:
1 – A new all-time high in the Advance / Decline line for the US S&P500 is very bullish but the Put / Call ratio at multi-year lows implies the market has got ahead of itself – if investors don’t own Puts they have no / limited downside protection.
2 – Traditional valuation methods for stocks like P/E (Price / Earnings ratio) which most readers are familiar with are very rich, especially with an economic backdrop littered with uncertainty.
MM is now neutral the US S&P500 short-term.
US S&P500 Index Chart
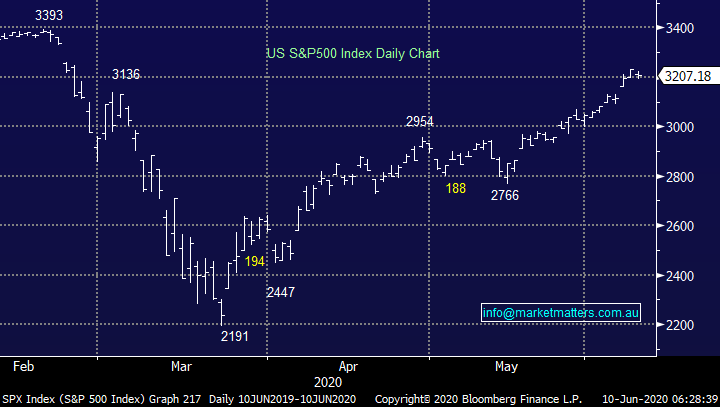
As we mentioned earlier the Put / Call ratio has hit multi-year lows with one of the main drivers being the huge increase in turnover of call options by retail investors which has actually hit a 20-year high, well above the levels reached in February. Unfortunately, the crowd is often wrong, and we regard this as a short-term warning that US stocks may be close to a decent pullback.
The S&P500 closed up for the year on Monday, totally dismissing the coronavirus, however uncertainty around the recovery from the current recession, a looming Presidential election in November, civil unrest and a belligerent China remains – I know we have enjoyed plenty of stimulus but the optimism is feeling too stretched in my opinion from a simple risk / reward perspective in the short term.
Retail traders going aggressively long speculative call options is a warning to MM.
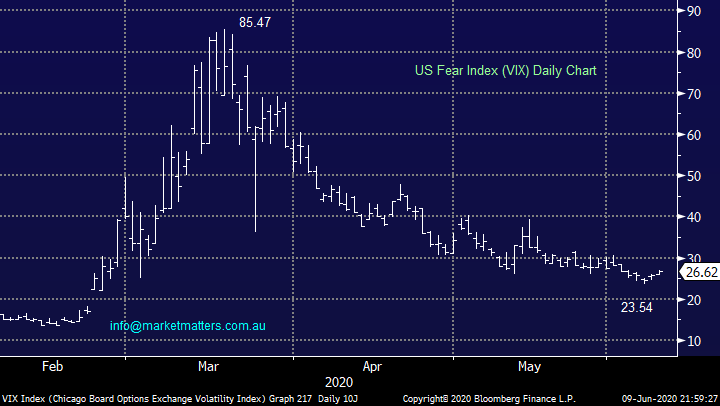
MM is still keen to fade any rally in the VIX towards the 40 area via an ETF hence we are considering taking profit on our current SVXY position.
US VIX (Fear Gauge) Chart
MM’s current Top Macro views
This morning I have summarised and hopefully explained clearly our “Top Macro ideas / views” which theoretically won’t change much, if at all, during 2020. Importantly the goal of our Global Macro ETF Portfolio is to reflect these views as will the bias / make up of our other holdings in MM’s Growth, Income International Portfolios. Undoubtedly some of this will be repetition of scenarios discussed in previous reports through 2020 but clarification is never a bad thing, especially when markets become volatile.
https://www.marketmatters.com.au/new-global-portfolio/
Ideally the portfolio above would hold 10 positions of 10% each reflecting our macro views / opinions but we don’t live in a perfect world hence there can be overlap between these positions and it is unlikely at any one time we will have 10, inevitably it will be more or less – financial markets are like a jigsaw puzzle with lots of interlocking pieces.
NB Macroeconomics is the area of economics which studies the overall economy i.e. the market systems that operate on a large scale. Hence Macroeconomics studies economy-wide phenomena such as inflation, price levels, rate of economic growth, national income, gross domestic product (GDP), and changes in unemployment.
1 - Equities
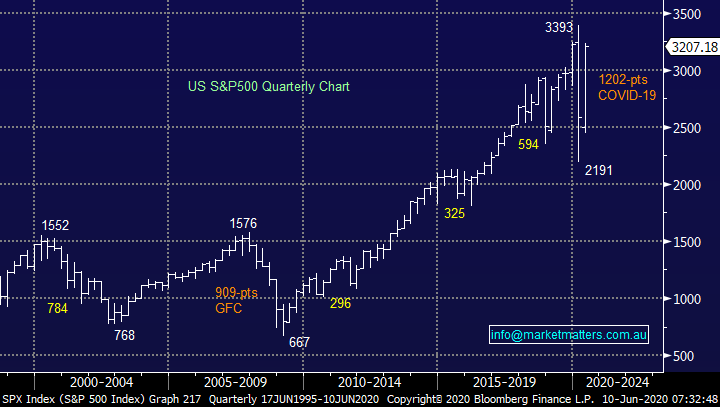
We believe stocks formed a multi-year low in March, similar in many ways to the GFC. At this stage we have no specific upside targets but buying major pullbacks, especially when news driven, should in our opinion continue to bear fruit– an easy view to follow through buying long ETF’s.
MM is bullish global equities for the foreseeable future.
US S&P500 Index Chart
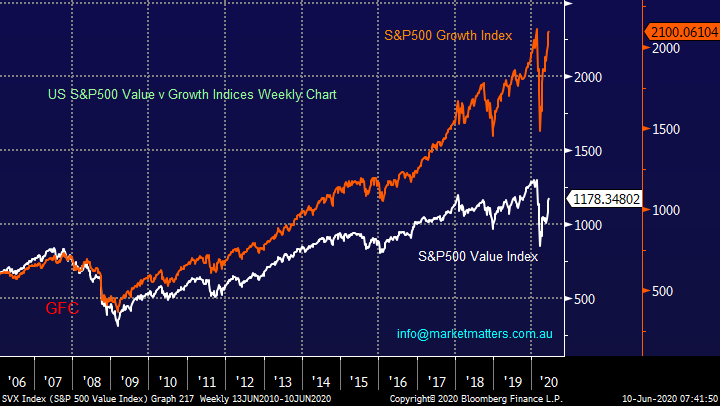
2 MM prefers value over Growth
For a few reasons which will be touched on later in this report MM believes the huge outperformance from the Growth stocks like IT & Healthcare over the last decade will be reined in by the likes of the Banks and Resources. We can “play” this view through spreads of bullish / bearish ETF’s looking for relative strength changes. If / when we get another correction in risk assets we feel it will be value that’s likely to decline the most following its recent strong rally providing an opportune time to implement this view. NB This does not mean we will not hold IT or healthcare stocks across our portfolios, it simply means we will be very selective in the ones we do and won’t ‘bet’ heavily on the sectors overall.
Medium-term MM prefers value stocks over growth.
S&P500 Value & Growth Indices Chart
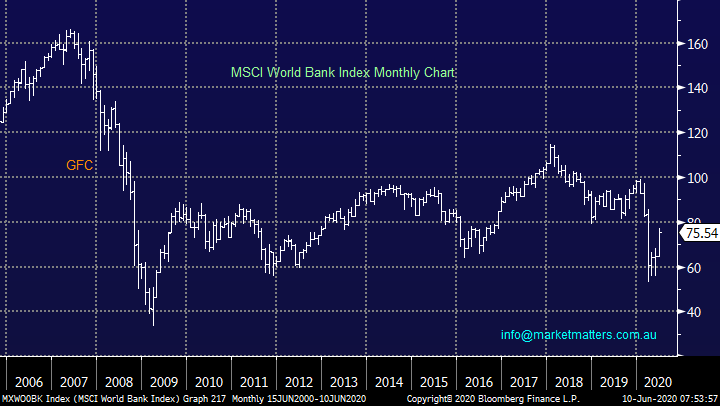
3 Global Banking Sector
The MSCI World Banking Index has bounced well over the last month, we feel the likelihood is it will now consolidate as it builds the strength to punch higher. Hence we wouldn’t be chasing banks at current levels but laying plans of what / where to buy does make sense.
Medium-term MM believes global banks should be accumulated into pullbacks.
MM remains keen on our BNKS ETF position although entry levels were not ideal.
MSCI World Bank Index Chart
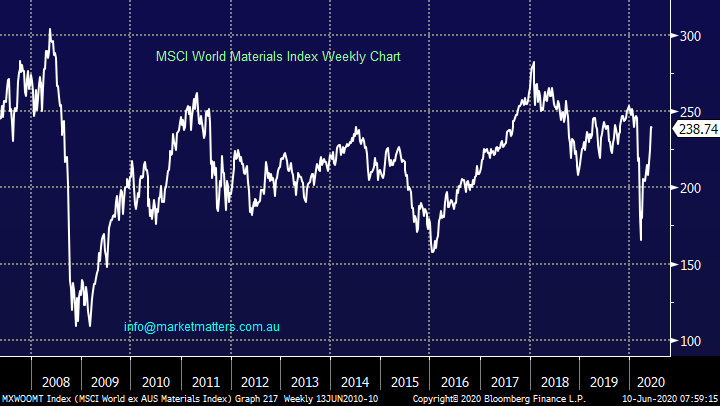
4 Global Resources / Materials Sector
Global Material stocks have surged higher in recent weeks confirming our bullish outlook for the sector, we are looking to buy any pullbacks in these companies both on the international stage and at home.
Medium-term MM is very bullish global Materials stocks.
MM likes our Global Copper Miners ETF position (COPX) and Strong $A ETF (AUDS), both of which are strongly correlated to this view.
MSCI World Materials Index Chart
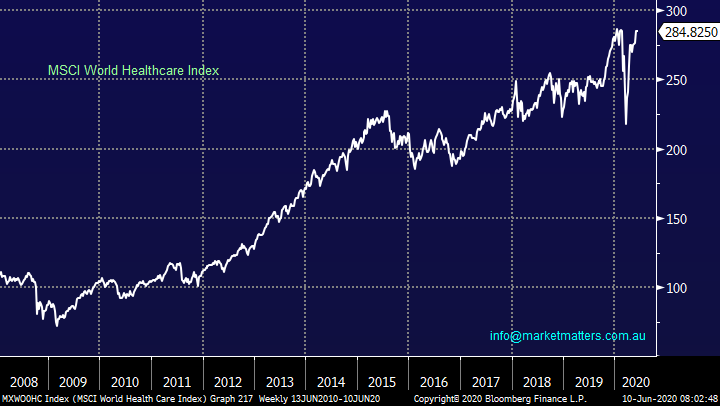
5 World Healthcare Sector
Global healthcare stocks have performed strongly since COVID-19 which is easy to understand but we believe the sector is fully valued after more than tripling since the GFC. However it’s the Australian companies who may struggle more if we are correct and the $A is poised to rally towards 80c unfortunately this is not an easy view to exploit except by avoidance.
Medium-term MM still believes Healthcare stocks will underperform.
NB ProShares have a short healthcare ETF which inversely tracks the Dow Jones US Health Care Index with leverage of 2x listed under code RXD (click here)
MSCI World Healthcare Index Chart
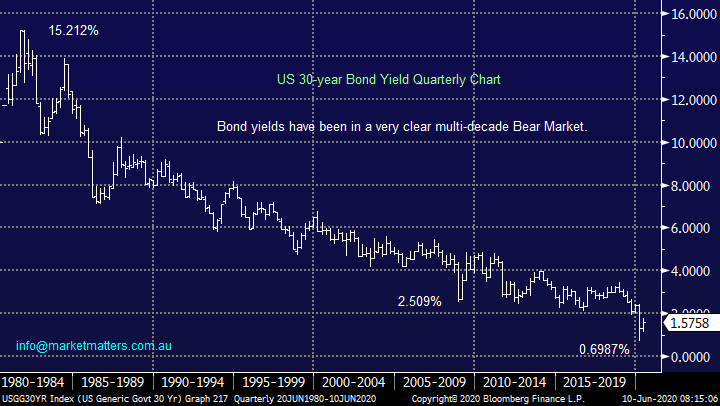
6 Bond Yields (interest rates)
The pick up in global economic activity is coinciding with our opinion that bond yields have bottomed for many years but we are mindful that financial engineering (QE) being implemented by many central banks is not allowing a “free” market hence advances are likely to be relatively muted – this will all change if / when inflation raises its head.
Medium-term MM believes Bond yields have bottom for at least a few years.
MM still likes its ProShares Short 20+ year Treasury ETF (TBF US) – remember when bond yields rise the underlying bonds fall.
US 30-year Bond Yield Chart
7 Inflation
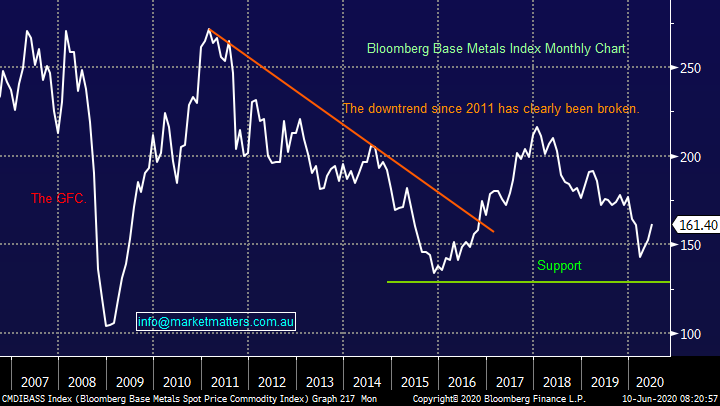
The world is seeing unprecedented financial stimulation yet things don’t appear to be too bad after the short-lived pandemic (so far at least). It simply feels like nobody wants to drop the baton and see a prolonged economic slowdown on their watch but as we all know the music does eventually stop playing and in this case we believe it will be caused by inflation raising its head like a large grizzly bear coming out of a prolonged hibernation – hence investors should be aware that interest rates can indeed go up as well as down! Base metals should eventually turn higher with inflation and economic activity.
Medium-term MM believes global inflation is set to rise under the pressure of massive central bank stimulus.
MM remains happy with our COPX, TBF and $A ETF’s mentioned earlier, all of which are correlated to rising inflation.
Bloomberg Base Metals Index Chart
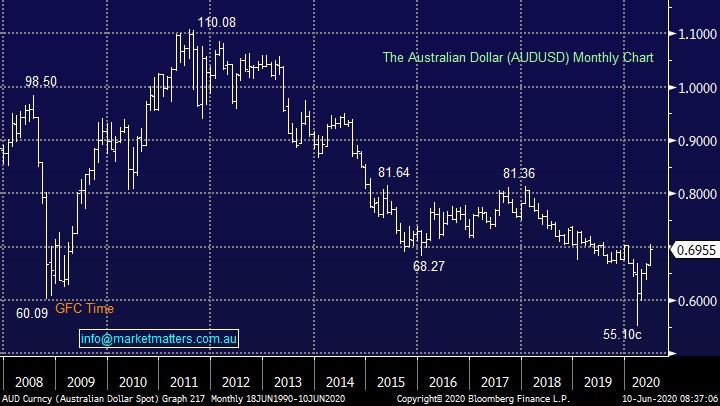
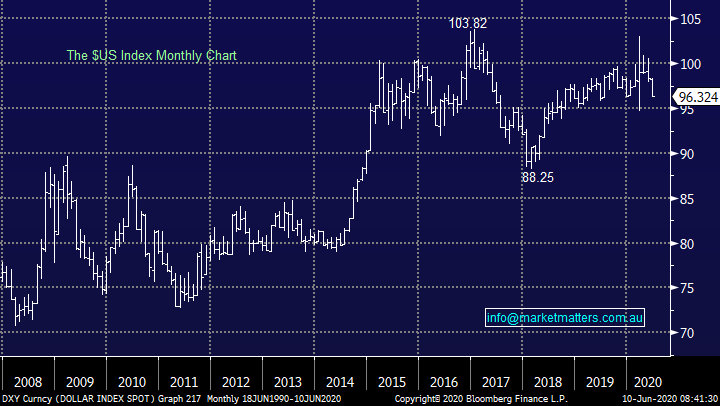
8 Currencies
We’ve been banging this drum for months and while the virus pandemic hammered the growth facing $A we remained resolute with our view – the $A is heading up to test the 80c region. Similarly the $US looks destined to weaken further which is common during inflationary periods but overall we believe buying the $A is the best way to play this scenario.
Medium-term MM believe the $US will fall and the $A rise on most major exchange rate crosses.
MM remains comfortably long the leveraged Aussie Dollar AUDS ETF.
Australian Dollar ($A) Chart
$US Index Chart
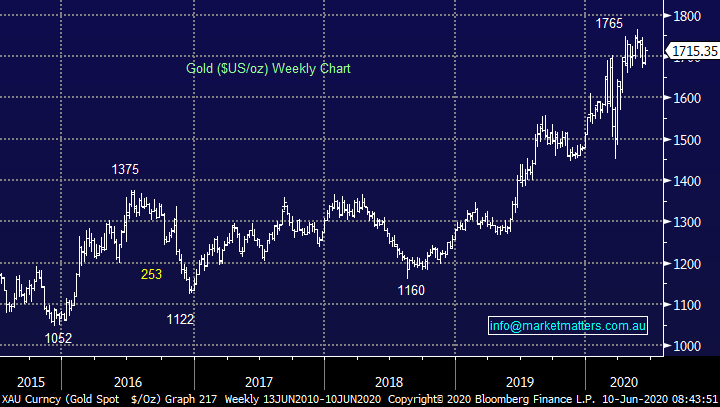
9 Gold
Gold has enjoyed a stellar few years as interest rates have plummeted towards zero but as bond yields tick higher this particular tailwind is diminishing but we believe it will be replaced by inflation, when is the million dollar question. We are remaining patient with gold / precious metals at present but a decent pullback will see us enter on the buy side.
Medium-term MM is bullish gold but shorter-term its tricky.
Gold ($US/oz) Chart
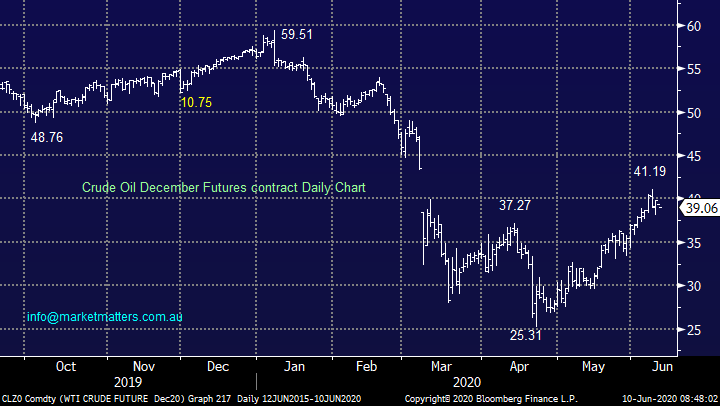
10 Crude Oil
Short-term we feel the “easy money” is behind us in crude oil, only a few weeks ago the news was awash with negative crude oil prices, now in early June the longer dated futures contracts have rallied by over 60%. We believe that a period of consolidation around $US40/barrel is likely, but the recent bullish trend is very much intact.
Medium-term MM believes crude oil will rise along with inflation.
MM remains comfortable with our BetaShares Global Energy ETF FUEL.
Crude Oil ($US/barrel) Chart
Conclusions
Hopefully these 10 points are clear, MM is simply bullish the global economy and stocks for at least the next 12-18 months, looking to buy the next pullback
Overnight Market Matters Wrap
- A mixed session in the US overnight, with the Dow and broader S&P 500 ending its winning streak by closing at negative territory, while the heavy tech. Nasdaq 100 continued to climb.
- US Treasuries were the main focus as investors weigh in if the US Fed will amend its debt buying - US 3 and 10 years unsurprisingly fell.
- On the energy front, Crude was higher following a report overnight that Libya had closed its top oil field again – some gains given back this morning
- The June SPI Futures is indicating the ASX 200 to follow the US and have a breather from its recent winning streak and open 47 points lower, testing the 6100 level this morning.
Have a great day!
James & the Market Matters Team
Disclosure
Market Matters may hold stocks mentioned in this report. Subscribers can view a full list of holdings on the website by clicking here. Positions are updated each Friday, or after the session when positions are traded.
Disclaimer
All figures contained from sources believed to be accurate. All prices stated are based on the last close price at the time of writing unless otherwise noted. Market Matters does not make any representation of warranty as to the accuracy of the figures or prices and disclaims any liability resulting from any inaccuracy.
Reports and other documents published on this website and email (‘Reports’) are authored by Market Matters and the reports represent the views of Market Matters. The Market Matters Report is based on technical analysis of companies, commodities and the market in general. Technical analysis focuses on interpreting charts and other data to determine what the market sentiment about a particular financial product is, or will be. Unlike fundamental analysis, it does not involve a detailed review of the company’s financial position.
The Reports contain general, as opposed to personal, advice. That means they are prepared for multiple distributions without consideration of your investment objectives, financial situation and needs (‘Personal Circumstances’). Accordingly, any advice given is not a recommendation that a particular course of action is suitable for you and the advice is therefore not to be acted on as investment advice. You must assess whether or not any advice is appropriate for your Personal Circumstances before making any investment decisions. You can either make this assessment yourself, or if you require a personal recommendation, you can seek the assistance of a financial advisor. Market Matters or its author(s) accepts no responsibility for any losses or damages resulting from decisions made from or because of information within this publication. Investing and trading in financial products are always risky, so you should do your own research before buying or selling a financial product.
The Reports are published by Market Matters in good faith based on the facts known to it at the time of their preparation and do not purport to contain all relevant information with respect to the financial products to which they relate. Although the Reports are based on information obtained from sources believed to be reliable, Market Matters does not make any representation or warranty that they are accurate, complete or up to date and Market Matters accepts no obligation to correct or update the information or opinions in the Reports. Market Matters may publish content sourced from external content providers.
If you rely on a Report, you do so at your own risk. Past performance is not an indication of future performance. Any projections are estimates only and may not be realised in the future. Except to the extent that liability under any law cannot be excluded, Market Matters disclaims liability for all loss or damage arising as a result of any opinion, advice, recommendation, representation or information expressly or impliedly published in or in relation to this report notwithstanding any error or omission including negligence.


