The Fed smashes stocks & sends gold higher, for how long? (ITX SM, GDX US, NCM, NST)
The ASX200 was smashed over 3% yesterday with only 12% of stocks closing up on the day and they were dominated by the gold sector. We’ve seen some aggressive mean reversion from Tuesdays 6198 multi-week high with the recently in favour Banks for example enduring some aggressive profit taking, CBA was the best of the “Big 4” and it still tumbled well over 4%. The recent “risk on” move into the value sector had helped propel the ASX up over 40% from its March low as the recovery story saw investors flock to stocks that would benefit from a “V-shaped” economic expansion and rising bond yields.
Yesterday we felt that Jerome Powell’s address was overall neutral in terms of policy i.e. do whatever it takes although there was very little talk of economic recovery and he stressed that the pandemic could inflict “longer-lasting damage on the economy” although the Fed did signal its intention to maintain rates around zero for years to come, a definite major tailwind for stocks. Lower rates over recent years has benefited growth stocks such as IT & Healthcare far more than the value end of town such as Banks & Resources, the latter more depended upon an uptick in the broader economy. The overnight plunge in US stocks clearly illustrates that financial markets were positioned for a more positive economic scenario but as we know panic creates opportunity.
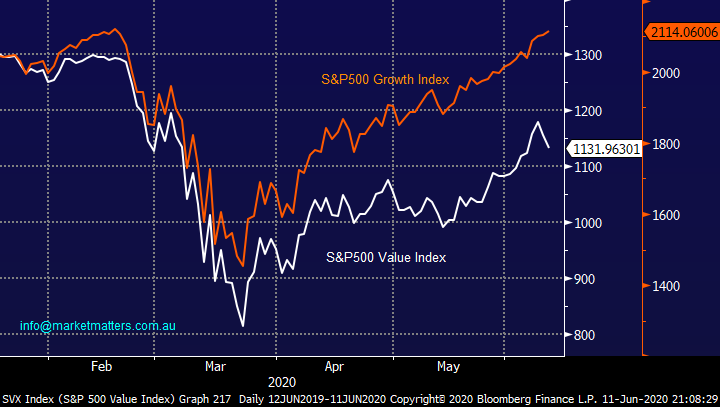
US growth stocks have again trumped value on performance following the Feds latest outlook for the economy / interest rates, we mentioned this was likely earlier in the week and still believe it to be the final stretch in the massive multi-year outperformance by the sector but it might as always go further than many anticipate i.e. MM is sitting on a healthy cash position which is likely to be directed primarily towards the value end of town in the coming weeks BUT patience feels prudent for now with accumulation feeling more apt than aggressive buying.
MM believes this is the start of the last leg of outperformance for the Growth Sector.
US Value & Growth Indices Chart
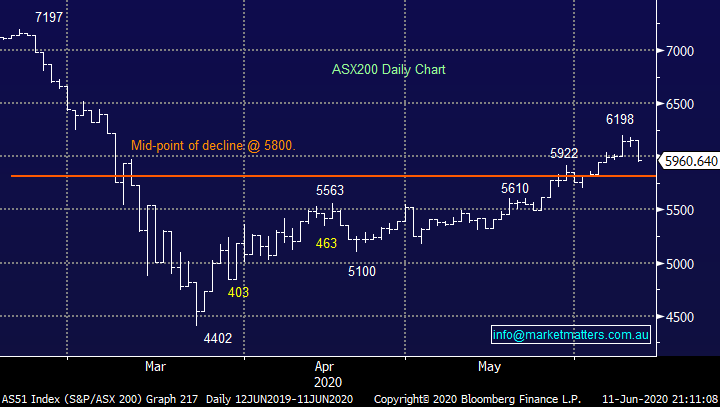
At this stage we have no reason to believe that yesterday’s 187-point plunge by the ASX200 is any more than a healthy albeit deep correction following a 12-week 40% rally, markets simply don’t rally 10% per month in uninterrupted fashion. Assuming we are in a normal market rhythm another correction of 450-500 points should be on the cards but be warned we are coming into the end of a very volatile financial year, quiet / stability is one thing I don’t anticipate – following the Dows plunge overnight MM’s initial target area looks a strong possibility this morning.
MM remains bullish equities medium-term with an ideal entry target for the ASX200 3-4% lower.
ASX200 Index Chart
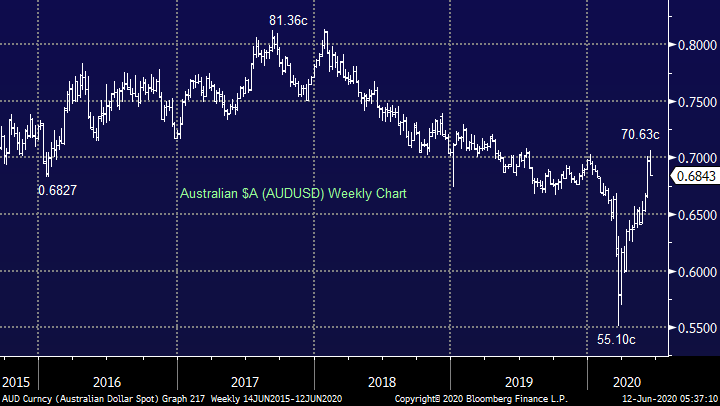
The Feds well and truly doused ice water on the markets optimism towards economic growth which is unlikely to be forgotten in a hurry, especially as the markets valuations were pricing in almost euphoric perfection – the plunge in US stocks is yet another example of the aggressive nature of moves when momentum traders / computers believe the music’s stopped playing. The $A remains significantly above its panic March lows but after rallying 15c in a few weeks like equities it appears well and truly in need of a rest, at this stage we’re in wait and see mode before identifying good risk / reward buying levels.
MM remains bullish the $A targeting the 80c region, although expect a pause here
Australian Dollar ($A) Chart
Direct From The Desk: Our take on the overnight drop – click here

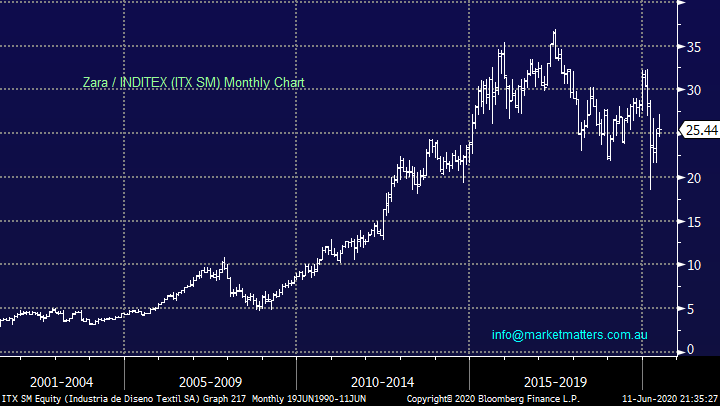
A slightly off point addition to today’s note but still fascinating and insightful in my opinion. Zara as we know it is the world’s largest clothing retailer, not bad for a fairly new brand from Spain. Yesterday CNN reported that the group plans to spend well over $US4bn in just 3-years on its “fully integrated store and online model” – e-retail continues to go from strength to strength. Additionally, as the Spanish giant aggressively migrates its operations further on-line from an already solid 14% of sales in 2019, two entrenched trends are being reinforced as up to 1200 Zara stores globally appear set to close:
1 – MM is only interested in retail businesses that have improving online presence.
2 – MM is extremely wary of the parts of the Real Estate Sector which are exposed to shopping centres as we feel only the very best will survive in their current form, a topic we covered in the income note this week – click here
Zara (ITX SM) Chart
The Fed & Gold – Part 2.
Yesterday morning the Fed pointed to zero interest rates until ~2022 while committing to maintaining their bond buying program, overall we felt their statement dropped into the market neutral corner from the 3 potential scenarios we identified in the previous Afternoon Report but the market clearly had other ideas and remember one of our favourite lines – “don’t fight the tape”. This morning most readers will already know its been a very ugly day on Wall Street, we believe its imperative during these periods of elevated volatility to stand back and be subjective, remember the drum we’ve been banging of late:
“we reiterate our belief that any decent pullback in risks assets over the coming months would be a buying opportunity.” however “MM remains bullish global stocks medium-term but short-term they still feel “rich” or vulnerable to a pullback.”- MM over the last week.
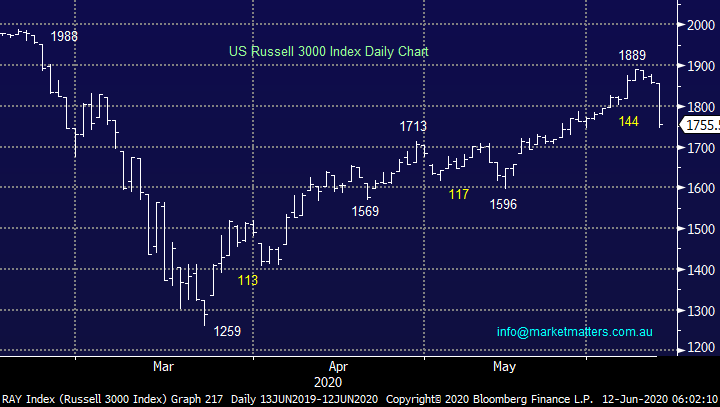
So, this morning the market is only doing what we anticipated although the when was always the million-dollar question, the Fed in hindsight have given us the answer. Considering what happened in March its clearly unsettling to see the Dow down over 1800 points / almost 7% registering its largest drop in 12-weeks but at this stage we are in “buy mode” looking for the optimum risk / reward to start accumulating stocks. Let’s just consider the broad-based US Russell 3000’s current correction putting it in recent context, a few simple points:
1 – The current 7.6% pullback is the largest since the March low, but it still only amounts to less than 23% of the total advance from the March 23rd inflection point – historically the most common pullbacks are 38% and 50%.
2 – Assuming we are now correcting the entire advance from this year’s swing low the ideal targets are the 1650 & 1575 areas implying we should be patient before firing the big “all in” buy guns.
Hence MM is in accumulate / buy mode but don’t expect us to be too aggressive just yet.
US Russell 3000 Index Chart
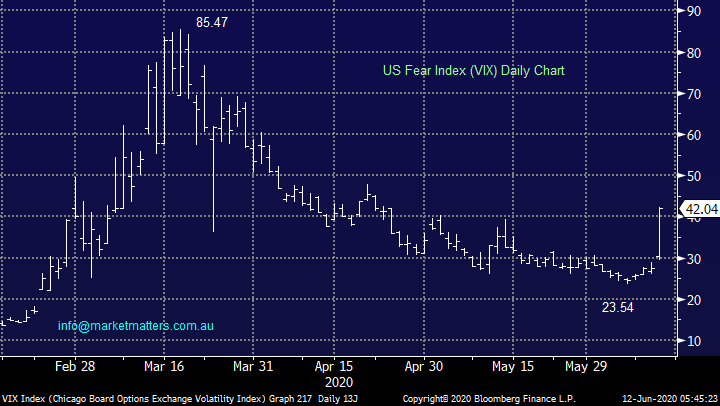
We’ve been anticipating a spike in market volatility in recent weeks and right on cue we saw the VIX surge higher, already entering our previously identified sell zone above 40. We will be watching the VIX closely for signs of “topping out” before stocks themselves as it can be a very useful leading indicator.
MM is considering adding to our short VIX position in the MM Global Macro ETF Portfolio.
US VIX (volatility / Fear) Index Chart
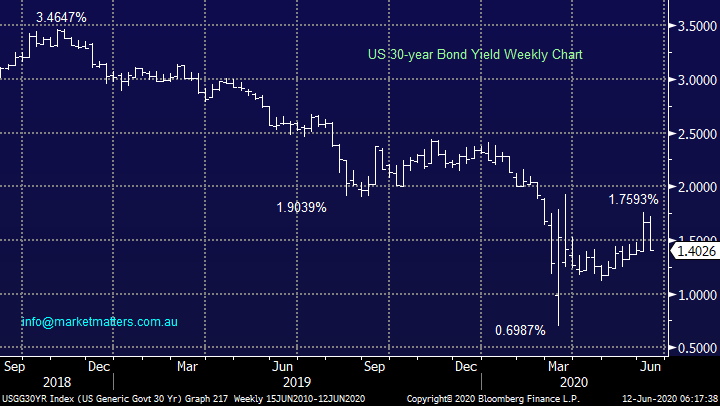
Financial markets clearly had an extremely volatile 48-hours which is not unusual after a Fed speech although I’m sure they would rather have just slowed down the market euphoria as opposed to causing a total carnage! However, as we said earlier it’s only been a relatively minor pullback in the scheme of things. The hugely influential US bond yields look poised for a period of consolidation which implies equities / risk assets may follow suit, one big “rest” makes sense our end.
MM can see US 30-year Bond yields rotating around 1.5% for the next few months.
US 30-year Bond Yield Chart
Moving onto gold which we touched on without giving any precise recommendations, I felt this morning we could rectify this point. A couple of key take outs from yesterday’s note:
1 – As we know Jerome Powell reinforced the lower for longer outlook for interest rates with the Feds Dot Plot (which shows committee members expectations for interest rates) illustrated a view that rates will be below the level of inflation until at least 2023, which is known as negative real rates.
2 - Gold and other stores of value typically do very well during periods where inflation is above official cash rates.
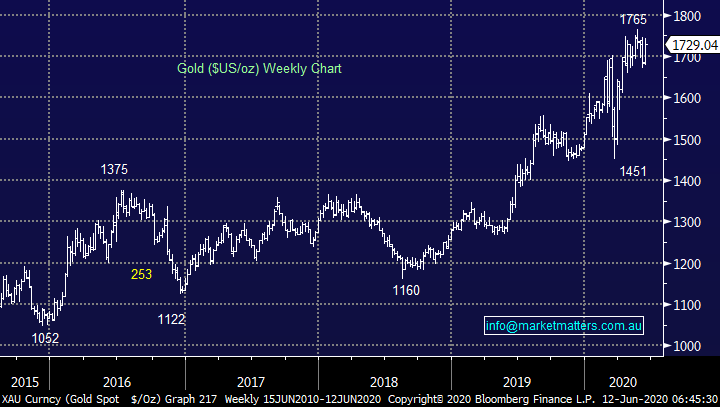
A prolonged period of negative real interest rates implies the gold price rally will likely be a multi-year phenomena that we should be very conscious of, and it is this thematic that is underpinning our positive stance towards gold and gold equities, despite the fact we still don’t own any (yet)! However as subscribers know we do like to bang the risk / reward drum at MM and I’m conscious that the precious metal remains well under its recent weekly high implying much of this fundamental good news could be built into the current price – technically a pullback of similar magnitude to 2016, towards $US1500/oz, would not surprise.
At MM we think the Gold price and Gold equities will rally over the coming years and we’re now looking for optimal entry – a test of $US2000/oz eventually feels likely.
Gold Spot ($US/oz) Chart
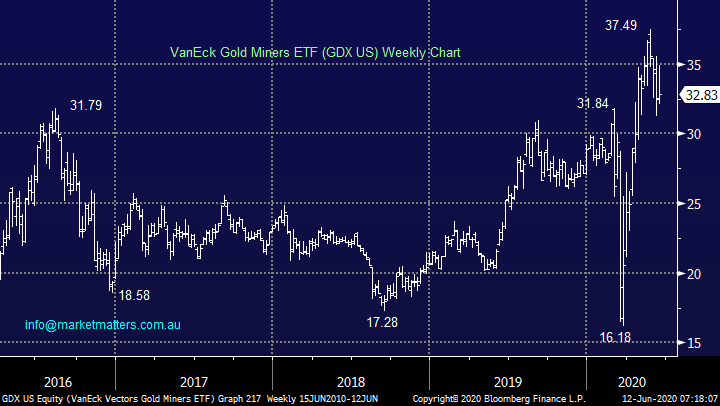
Overnight while stocks plunged precious metals had a fairly quiet session, but Gold Miners ETF’s endured a tough session with the GDX falling ~5% implying the local sector will struggle this morning. We will reconsider the GDX ETF, or something similar in silver, over the coming weeks for our MM Global Macro ETF Portfolio.
At MM we are looking for optimal entry into the gold sector.
VanEck Gold Miners ETF (GDX US) Chart
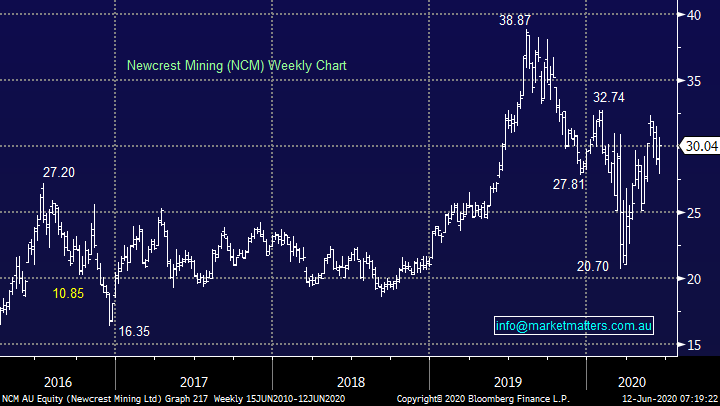
1 Newcrest Mining (NCM) $30.04
As we said yesterday Newcrest (NCM) screens cheapest on pretty much all metrics however their performance in recent years has clearly been underwhelming relative to the underlying commodity. We feel the market will eventually forgive NCM’s previous sins and the stock will come back into favour, similar to a lot of riskier end of town over recent weeks. NCM is our preferred entry into the gold space hence I have updated the below, unfortunately picking an entry just here is very tricky hence accumulate into weakness feels the best approach.
MM is bullish NCM.
Newcrest Mining (NCM) Chart
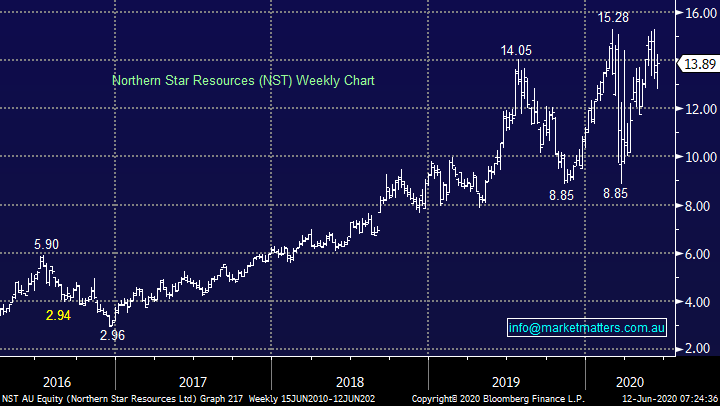
2 Northern Star Resources (NST) $13.89
NST is our second pick amongst the Australian miners with a punch up towards $16 feeling just a matter of time. The company have ran with the ball just as NCM have dropped theirs as can be seen from the relative performance of both stocks over the last 18-monthgs. Hence a mix of NST and NCM feels a logical / optimum mix in an Australian portfolio which is looking to benefit from negative interest rates for the next few years.
MM is bullish NST.
Northern Star Resources (NST) Chart
Conclusion (s)
1 – Following the great disruption by the Fed, stocks are approaching our accumulation / buy zone, but patience feels prudent for now especially when we look at US stocks.
2 – MM is looking for ideal areas to buy NCM & NST for our Growth Portfolio.
Overnight Market Matters Wrap
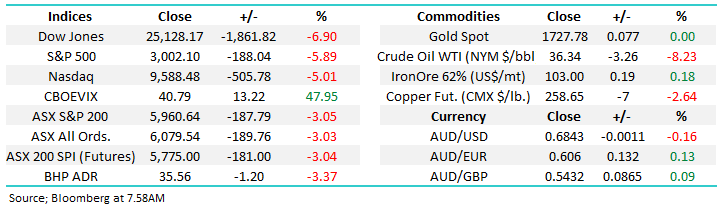
- Global markets suffered a reality check overnight, with the Dow plunging 1862 pts (6.9%) on signs of a resurgence in COVID-19 cases in some of the US states that have been re-opening their economies faster than others. Total US infections exceeded 2m overnight and 113,000 deaths, with Texas, Arizona and California among the States to report an increase in infections and hospitalisations.
- The selloff, which was also driven by Wednesday's cautious economic outlook statement from the Federal Reserve, in particular affected economic sensitive stocks. Hardest hit included the airlines, cruise ship operators, hospitality and retail sectors, with American Airlines, United Airlines, Boeing and cruise ship operator Carnival losing more than 15% in value. The broader S&P 500 index dropped 5.9% and the tech heavy Nasdaq, which hit an all-time high of over 10,000 the previous day, lost 5.2%. European markets suffered falls of over 4%.
- The oil price slumped 8.7% on concerns of lower demand driven by the weaker US economic outlook, with the price of Brent back to just above US$38/bbl, weighing on the oil sector. Other commodities were also under pressure, with copper retreating 3% from its 4-month high. Gold held steady as investors switched to more defensive assets.
- The June SPI Futures is indicating the ASX 200 to open 185 points lower, towards the 5775 level this morning.
Have a great day!
James & the Market Matters Team
Disclosure
Market Matters may hold stocks mentioned in this report. Subscribers can view a full list of holdings on the website by clicking here. Positions are updated each Friday, or after the session when positions are traded.
Disclaimer
All figures contained from sources believed to be accurate. All prices stated are based on the last close price at the time of writing unless otherwise noted. Market Matters does not make any representation of warranty as to the accuracy of the figures or prices and disclaims any liability resulting from any inaccuracy.
Reports and other documents published on this website and email (‘Reports’) are authored by Market Matters and the reports represent the views of Market Matters. The Market Matters Report is based on technical analysis of companies, commodities and the market in general. Technical analysis focuses on interpreting charts and other data to determine what the market sentiment about a particular financial product is, or will be. Unlike fundamental analysis, it does not involve a detailed review of the company’s financial position.
The Reports contain general, as opposed to personal, advice. That means they are prepared for multiple distributions without consideration of your investment objectives, financial situation and needs (‘Personal Circumstances’). Accordingly, any advice given is not a recommendation that a particular course of action is suitable for you and the advice is therefore not to be acted on as investment advice. You must assess whether or not any advice is appropriate for your Personal Circumstances before making any investment decisions. You can either make this assessment yourself, or if you require a personal recommendation, you can seek the assistance of a financial advisor. Market Matters or its author(s) accepts no responsibility for any losses or damages resulting from decisions made from or because of information within this publication. Investing and trading in financial products are always risky, so you should do your own research before buying or selling a financial product.
The Reports are published by Market Matters in good faith based on the facts known to it at the time of their preparation and do not purport to contain all relevant information with respect to the financial products to which they relate. Although the Reports are based on information obtained from sources believed to be reliable, Market Matters does not make any representation or warranty that they are accurate, complete or up to date and Market Matters accepts no obligation to correct or update the information or opinions in the Reports. Market Matters may publish content sourced from external content providers.
If you rely on a Report, you do so at your own risk. Past performance is not an indication of future performance. Any projections are estimates only and may not be realised in the future. Except to the extent that liability under any law cannot be excluded, Market Matters disclaims liability for all loss or damage arising as a result of any opinion, advice, recommendation, representation or information expressly or impliedly published in or in relation to this report notwithstanding any error or omission including negligence.


