Subscriber Questions (EHL, ABP, COF, BSE, STA, LLC, WPL, ABC, SDA, SIQ, HAV)
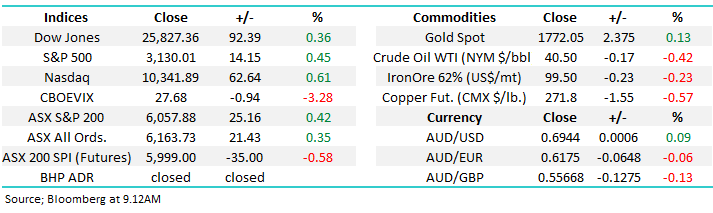
The news over the weekend was dominated by the coronavirus with a large increase in cases in Melbourne leading to forced lockdowns in many suburbs, this morning we’re reading headlines that the CBD is next. After 106 new cases on Saturday and 74 new cases on Sunday, the threat of a significant escalation is clearly becoming real. Internationally, the number of new cases in parts of the US are simply staggering, and it seems that the ‘wild west’ states have simply given up, keying off the lax approach from their President.
New York on the other hand, the most important city in America economically is having better success and is rolling forward with phase three reopening plans, although the resumption of indoor dining has been postponed.
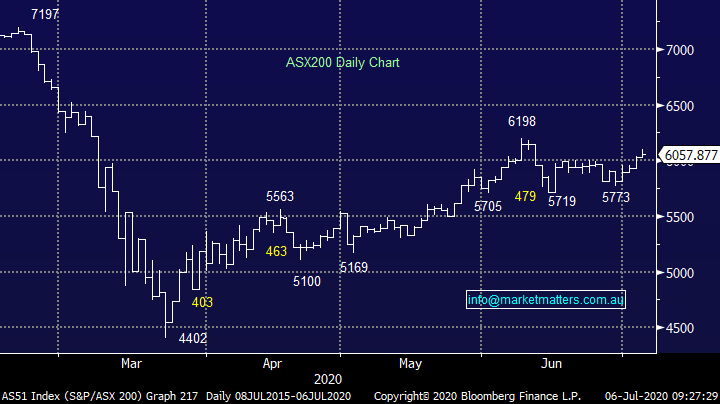
At MM our stance has not changed including the anticipated ongoing waves of volatility through 2020. We remain net bullish for the next 12-18 months given huge levels of stimulus but considering how far the recovery since March has already unfolded, we are now sellers of further strength. The recent resurgence in the virus provides a reality check that it’s going to take longer than many anticipated to “get back to normal” which should keep valuations in check.
The SPI Futures were calling the ASX200 to open flat this morning while US Futures have opened marginally higher following their 4th July long weekend. While the headlines are dominated by case counts and lockdowns, the market is remaining resilient.
MM remains bullish equities
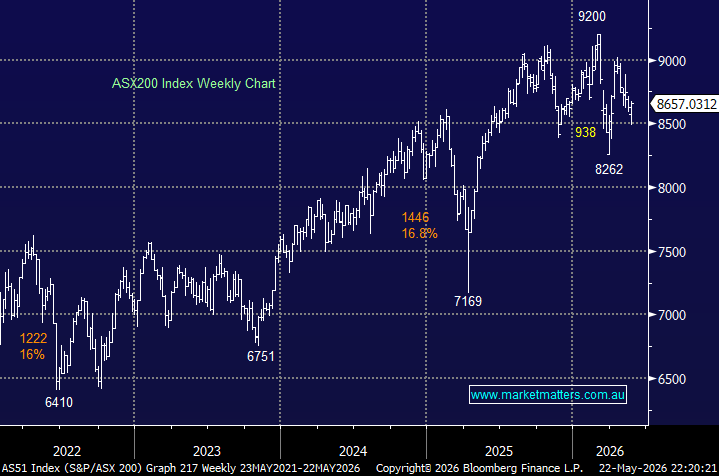
ASX200 Index Chart
Thanks as always for the questions which have focussed largely on stocks, which of course is the main game in town. While having a feel for the overall market is very important, it’s stocks that we’re actually buying and selling on a day to day basis. For new subscribers to Market Matters, welcome, great to have you on board. If you’d like to send in questions for our Monday Q & A report, please email [email protected].
Question 1
Hi James, I would like to know your thoughts about EHL. I quite like Emeco fundamentally especially Emeco has just updated his FY20 guidance. However, its debt is now similar to its market cap, should we be worried? I bought it at $2.00 ish last year. From previous articles, if you are bullish at EHL, why wouldn't you recommend to purchase more now to average the cost? Regards Peter
Hi James, Love your work and look forward your your daily commentaries and advice. I note that EHL continues to trade well below pre-COV pricing despite a reasonable guidance and outlook. From memory you were keen on this some time ago, do you still consider it a buy? Ian
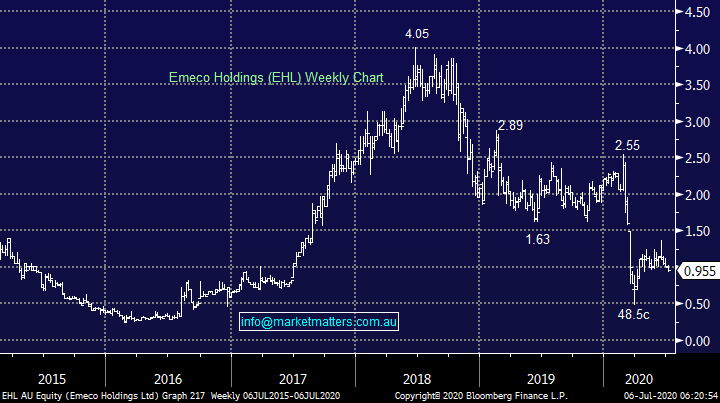
Thanks Peter & Ian, EHL has been a frustrating investment for MM and certainly a volatile one. The earthmoving equipment & rental business has traded in a range between $2.55 at the high & 48.5c at the low, certainly not for the faint hearted, although our position size is small. We originally bought EHL because it was cheap (trading on less than 8x) but more importantly, had a credible plan to pay down debt, and de-gear its balance sheets, which was the main reason why the stock was trading at a depressed level. COVID-19 saw stocks carrying high levels of debt get sold off, however they’ve also recovered most aggressively.
EHL did confirm earnings guidance in May plus they said expected net debt / operating EBITDA would likely be at ~1.5x which is down from around 2.3x last year, plus they’ve flagged a further debt reduction in FY21. Fundamentally, we like EHL however the price action is poor. I suspect this is a result of the stock being removed from the S&P/ASX 200 Index at the end of June. While that’s a negative in the short term as it leads to large cap fund managers & ETFs having the sell, if / when EHL comes back into favour, EHL will hold a bigger weight in the small cap indices and therefore will need to be bought by smaller cap managers. i.e. if EHL is 0.1% of the ASX 200, when the stock moves it’s not meaningful in terms of index tracking so fund managers have little interest unless they actually want to own the stock, however, if it’s a bigger weight in a smaller cap index and starts to move up, many managers will buy it by default because it’s more influential in that index.
In terms of averaging our position which resides in the MM Growth Portfolio, the volatility / risk associated with the stock means we’re at our maximum weighting.
MM remains bullish EHL
Emeco Holdings (EHL) Chart
Question 2
Hi James, Thank you for your ongoing market commentary. I wonder can you please advise me on a couple of REIT’s I am looking at for long term inclusion into our Super fund, which is in pension mode. They are ABACUS PROPERTY GROUP (ABP), and CENTURIA OFFICE REIT (COF). ABP looks good as a diversified property play while COF looks like a standard office type of fund with quite a good record. We are in need of some reliable income payers in our fund, which can, hopefully, maintain or grow in value. Any comments would be appreciated. Thanks. Les
Hi Les,
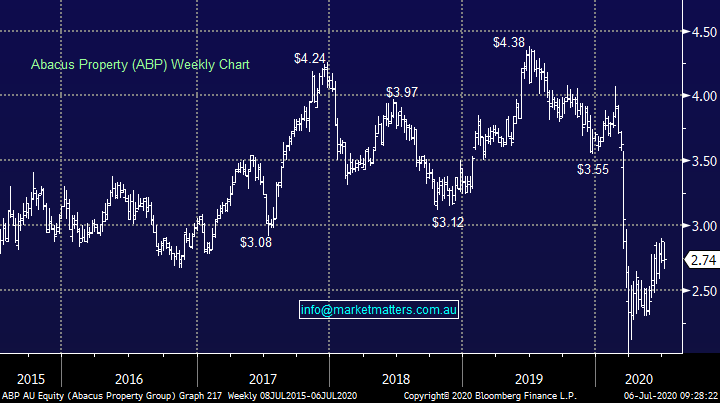
We hold Abacus (ABP) in the MM Income Portfolio and are positive on their move into the self-storage space both internally but also through an 8% holding in National Storage REIT (NSR). The projected 12-month dividend yield on ABP is 6.68% (unfranked) while the stock trades on a conservative Est P/E of 12.63x. We like the management, and despite being not particularly bullish on property right now, ABP is a solid operator and the yield (for now at least) is sustainable.
MM is positive on ABP for yield
Abacus (ABP) Chart
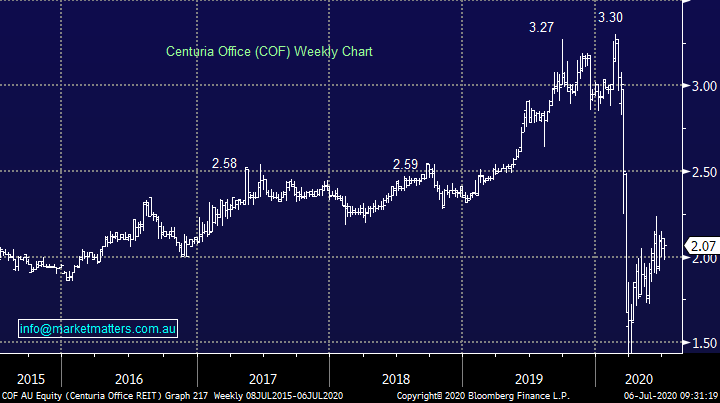
Office exposure on the other hand, we believe will struggle more in the future as greater flexibility to work, and the WFH phenomenon gains traction. I was surprised by the sale of 45 Clarence Street a few weeks for $530m which was inline with its carrying value 6 months ago. Dexus,.the owner of the building also had 90% of their book externally revalued and saw book value decline by just 1.2%, so while the obvious conclusion to make is that WFH etc will undermine office valuations, we’re not yet seeing it.
COF remains cheap trading on 12x earnings while dividend expectations are less clear.
MM is neutral on COF, preferring ABP
Centuria Office REIT (COF)
Question 3
Hi, If you like Iluka, have a serious in depth look at Base Minerals –BSE, producing in Kenya and developing an enormous mineral resource/reserve in Madagascar, eventually to be in the top 2 or 3 in the world! Mike
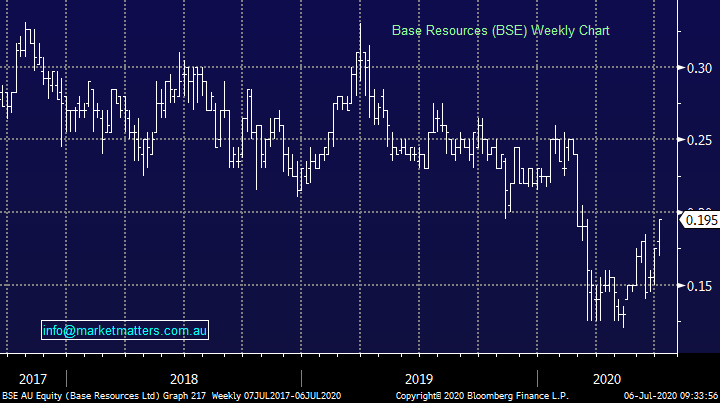
Base Resources (BSE) is a $228m company that produces mineral sands which is generally used in paints & ceramics, however as you rightly point out, their project in Madagascar is the potential game changer. The market for mineral sands is fairly opaque and overall, has been a laggard in recent times. The main player domestically is Iluka (ILU) and they’ve had mixed success over the years, plus they also have a Iron Ore royalty which they are looking to demerge.
BSE is too small for MM however technically it looks a good speculative buy with stops below 17c.
BSE Resources (BSE) Chart
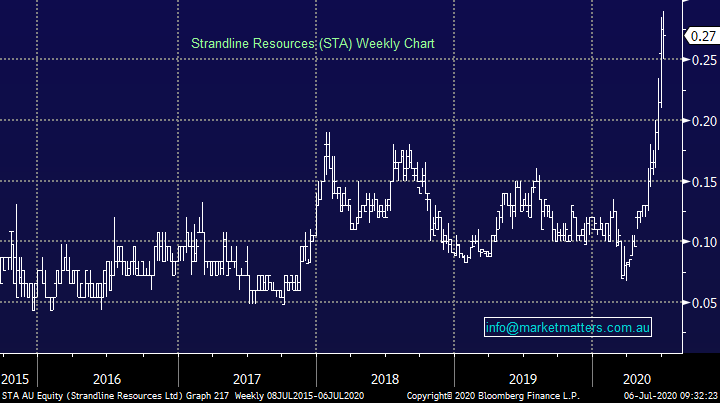
Another local small cap mineral sands player with operations in WA is Strandline Resources (STA), we cover this at Shaw from a research perspective with a bullish 52c price target.
Strandline Resources (STA) Chart
Question 4
Hi James and team,
Just wondering if you could comment further on lend lease’s year end announcement about their unaudited financials. I read your brief comments but am interested in a bit more. The initial reaction was to drop 90cents and then bounce back to recover all of that. On reading their announcement myself I was initially disappointed with what was said but then assumed it was basically expected? Cameron
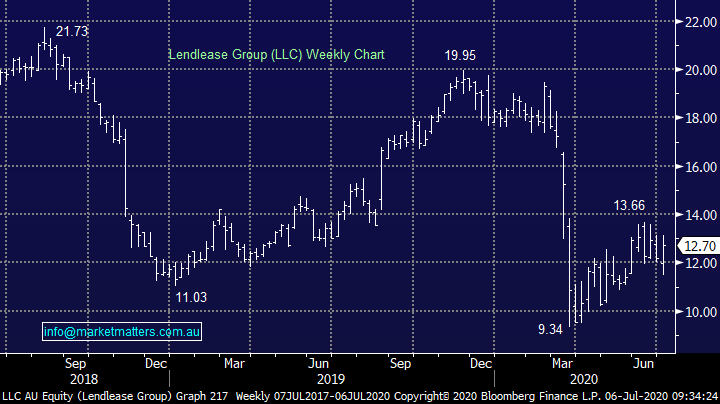
I read the update from LLC while travelling last week and at the time wrote that the detail in the update was not really a surprise, they’d flagged a number of those issues before and ultimately, a lot of the moving parts were non-cash write downs. You are right in terms of the headline numbers, they were weak hence the stock opening sharply lower after the company said FY20 core profit after tax would be $50m-$150m was understandable given consensus was at $560m, plus a number of brokers were materially higher. About ~$200m of the hit was asset devaluations, their construction business saw shutdowns overseas which deferred payments plus they had settlement deferrals locally.
It seems the market is calling FY20 a ‘one off’ and focussing on the better FY21 expected with all operations back up and running, plus they are confident the sale of their problematic engineering business will go through.
All in all, a weak update but not unexpected, and better times ahead. LLC remains cheap and has a good pipeline of work.
MM remains bullish LLC
Lend Lease Chart (LLC)
Question 5
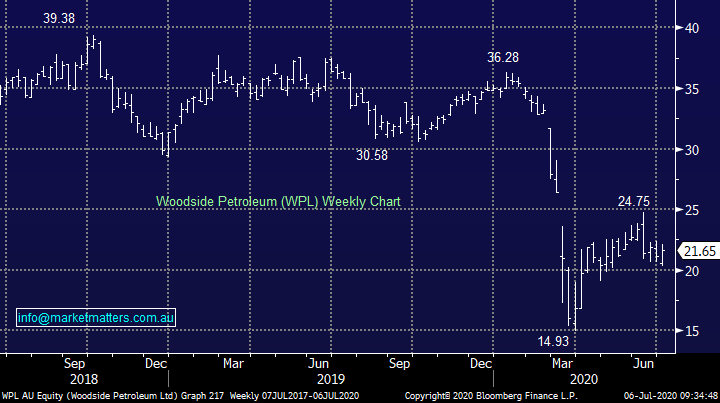
James & team: In the weekend AFR there is a story about Shell and BP having to write down the carrying value of their LNG assets. What is your view on the possibility of Santos and Woodside having to take the same action and if they do have to, would this have already been factored into the share price? Cheers
There is always the potential for asset revaluations however it doesn’t generally create a major issue unless balance sheets are very extended, which is not the case with either Santos or Woodside. This biggest determinant for both WPL and STO share prices is the price of Oil.
Woodside has a lot of headroom, around ~$4bn in cash, low cost operations and available liquidity of around ~$7.5bn to withstand a volatile Oil price environment, and even take advantage of it through acquisition, while Santos has done a very good job of lowering their cost base and is now a very low cost producer. Oil Search (OSH) is the one in the sector that’s most stretched.
MM remains bullish Oil holding WPL & Beach Energy (BPT)
Woodside Petroleum (WPL) Chart
Question 6
Hi James, There is no argument with the meaning of your message about the status of 'Dr Copper' - but the term you were looking for is "bellwether" - perhaps you are another victim of predictive text or similar? Keep up the good work! Peter
Thanks Peter, I’d like to be able to blame that on predictive text, and maybe that was the case however not so sure. For those new to the MM reports firstly welcome, however you will notice that spelling sometimes is not a strong point of mine. We’re all about writing a ‘direct from the desk’ note, giving you our raw views, outlining what we’re seeing, hearing and reading. So, in advance, please accept my apologies, that’s the not the first slip and I’m confident it won’t be the last.
Question 7
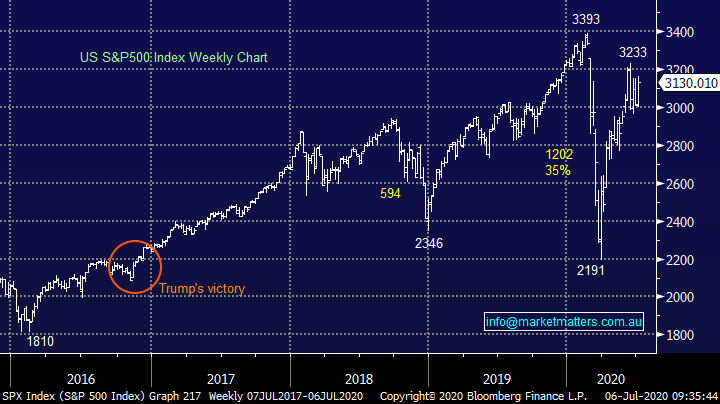
Dear James, I’ve been finding your newsletter a beacon of hope in a sea of despair, so thank you. Just a quick question regarding your two “likely scenarios” noted in today’s (Friday) morning newsletter, well specifically about scenario one: “1 - Either stocks are poised to correct the whole advance from the March 23rd low with our ideal target ~7% lower for the S&P500.” According to my perhaps too easily confused brain there are three possible things you could mean here: 1. The market, specifically the S&P500, could retreat back to the March 23rd lows. 2. That your ideal scenario is that the S&P500 retreats back to 7% below the March 23rd lows. 3. That your ideal scenario is the S&P500 could correct 7% from where it is now. My best guess is that the latter is what you mean. Hoping you can confirm this for me. Peter
Hi Peter, sorry, I can see how this could be confusing however you are correct on your last interpretation. The short term picture for the S&P 500 is tricky, either it shrugs off the latest COVID-19 set-back and continues to rally, or it pulls back. The important aspect of the call is the market remains bullish and pullbacks when they happen will likely be shallow.
MM remains bullish US stocks medium-term.
US S&P500 Index Chart
Question 8
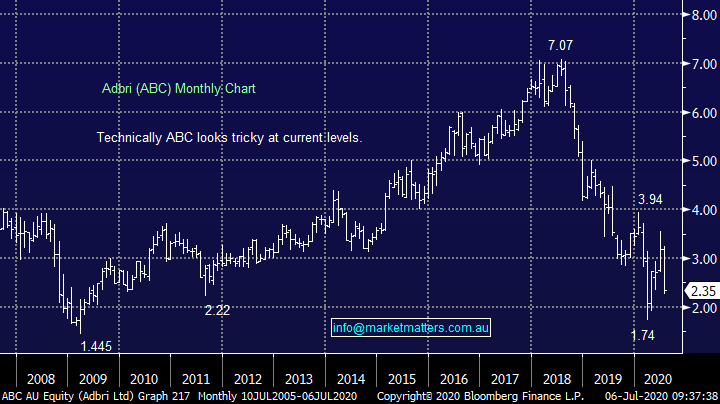
Hi MM, Is ABC a buy today. Currently down 25% due to a loss of a contract. Is this an over-reaction? Brad
Hi Brad,
Our first take on the move was that it’s an overreaction given the loss of the Alcoa contract was worth $70m in annual revenue versus the ~ $1.4bn collectively, however the move by Alcoa to cheaper imported product after a 50 year association with ABC highlights the cost pressures in Australia, certainly a challenge for ABC more broadly. Broker downgrades likely today so it all seems a bit hard to catch this falling knife. Under $2.00 would look more appealing.
MM is neutral ABC into this decline.
Adbri Limited (ABC) Chart
Question 9
Hi James, I have an observation for you to comment on Monday. If after buying a share it goes down 10%, more often than not, it will go down further (in fact about 80% of the time) and will not recover quickly, usually taking about 6 months or so. If this is correct it is dead money, so one should get out early. Do you agree or is this too simplistic? Nick A
Hi Nick,
The old premise of cutting your losses and letting your profits run rings true here. While we could cherry pick a few examples where a drop straight after buying is a bad omen I’m sure I could find examples to the contrary. I also believe that the context of what & where we are buying plays into this. If for example we are accumulating new lows in a stock then we’ll be more tolerant of initial weakness. If however we are buying a pullback in a strong trend and that pullback becomes significantly deeper than originally expected, that would likely scuttle our thesis, and we should cut early.
Question 10
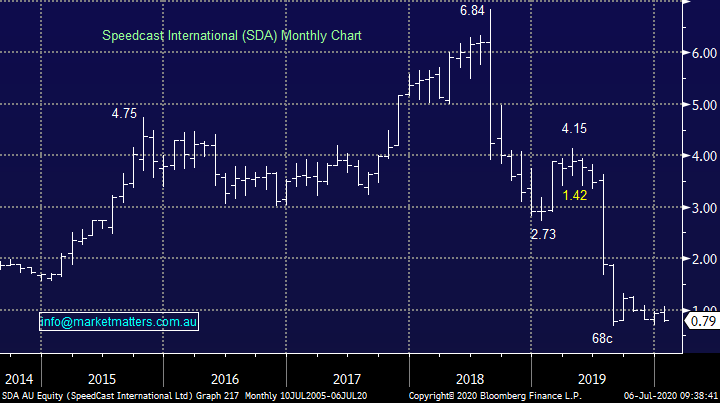
I am share holder of SDA and i like to know what to do . They are in my Westpac Securities Limited Regards S. Cessario.
From our understanding, holders of SDA need to await the outcome of Chapter 11 bankruptcy proceedings in the US. While I’m not as familiar on US regulation, domestically holders would need to await confirmation from the administrator that security holders are unlikely to receive any value for their shares and they then can be written off, until that happens, there is not much to be done, however on matters of tax, it is important that members speak with their accountant, and remember, MM provides general advice only.
Speedcast (SDA) Chart
Question 11
Hi MM, Have been finding your reports very helpful. Have 2 questions. Do you have a favoured share trading platform for USA shares or one that you would recommend? With the ASX Europe ETF or ASX IOO ETF do you prefer the hedged ETF or the unhedged? Cheers, Jill
Hi Jill,
1. Interactive Brokers seem to be a well-regarded and certainly cost effective international platform, however they do hold securities in a custodian structure meaning they are not held on your HIN (or an equivalent overseas). The custodian is the owner of the shares and they are held in safe custody for you. In my view, this is not ideal, I always prefer direct ownership however the offset is that IB are big and robust, and well used globally. We do have an international desk at Shaw and Partners, and we hold international stocks the right way. Brokerage is charged at 0.8% or $US125, or through a managed account, we simply charge $17.5 per trade in addition to an annual management fee. Please get in touch if you’d like more information. [email protected]
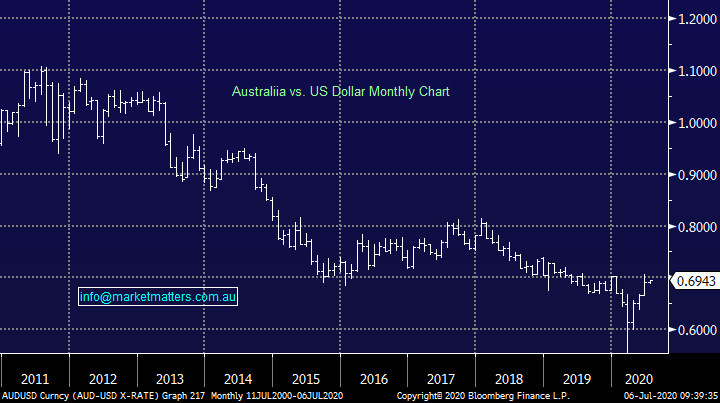
2. Generally, I prefer unhedged exposure to international shares. The local currency then provides a cushioning to returns.
MM remains bullish the AUD targeting 80c.
Australian Dollar (AUD) Chart
Question 12
Hi any thoughts on SIQ market up today but not SIQ and SSM do you think it is a buy still ? Thanks Glenn .
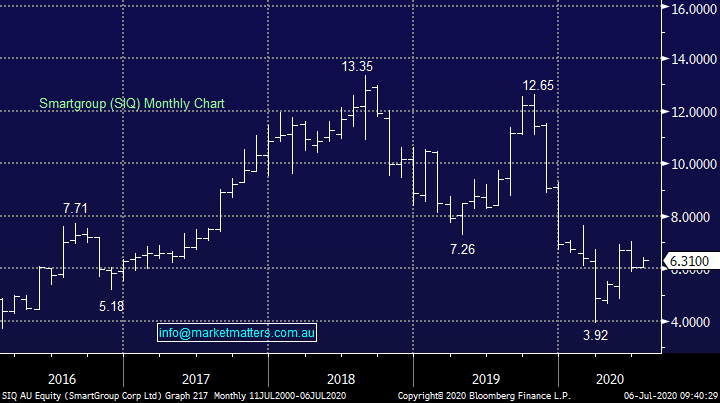
The salary packaging and leasing business Smart Group (SIQ) is a low beta stock, meaning that it is not as highly correlated to the market as a higher beta stock like Macquarie Group (MQG). That said, SIQ hasn’t delivered as we hoped and a pop above $7 is likely to see us grab a small profit and retreat, again looking for better opportunities down the track.
MM will consider taking a small profit on SIQ around $7.25.
SmartGroup (SIQ) Chart
Question 13
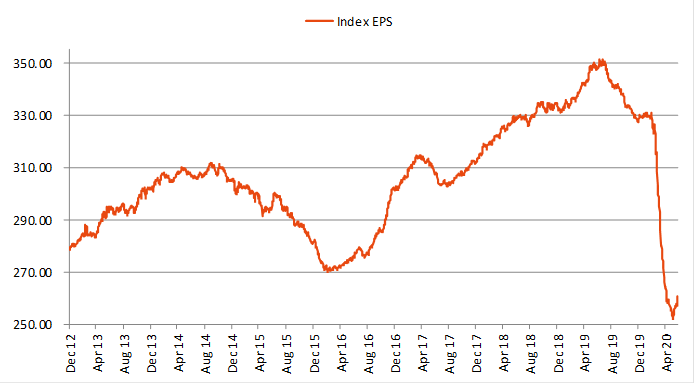
Hi Guys, The expected deterioration of EPS issue is also exacerbated by all the Cap raisings and the resultant issue on new shares. Cheers Peter M
Peter was referring to this chart, and he is certainly right, with more capital raisings to come. Remember, we haven’t yet seen many of the large companies tap the market.
This chart caught my eye this morning which looks at index earnings per share (EPS) estimates, in other words, what analysts expect the index as a whole to earn on a per share basis. The large deterioration in EPS expectations has underpinned the rise in valuations, hence the growing calls that the market is very overpriced given prevailing conditions. That argument relies on analysts getting earnings right, and from what I can tell, analysts have cut hard on the back of companies pulling guidance (i.e. companies don’t have a handle on what it means, let along analysts!) The chart below shows a slight uptick here which is stemming from a number of larger caps coming out with reinstated guidance which has been better than feared (retailers an example). In any case, we can clearly see that EPS expectations are bearish, but are showing some tentative signs of bottoming / moving higher.
Question 14
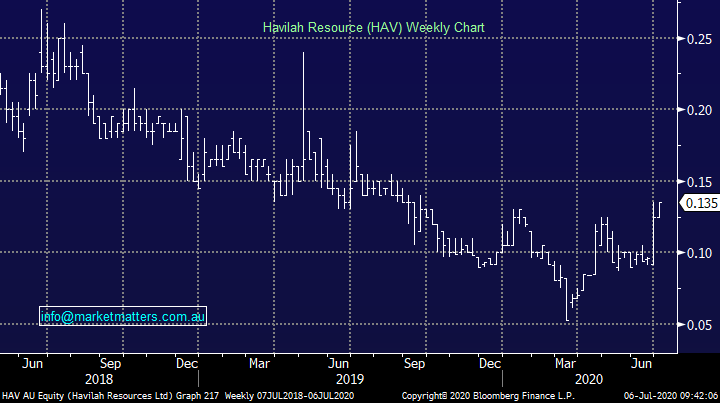
James and team - Interested in your comments on the prospects of Havilah Resources (HAV). Currently involved in gold and rare earth exploration and recently received an Exploration Support grant of $275k from the SA Government on top of a recent capital raising of $500k. Cheers
Hi,
I’ve had a couple of requests about this $36m company in recent days showing it’s on a few peoples radar, however it’s too small for MM and I haven’t given it any real attention. Sorry.
Havilah (HAV) Chart
Overnight Market Matters Wrap
· The Euro region ended last Friday’s session on a negative tone, with the coronavirus cases topping 11.3m worldwide.
· On the commodities front, most metals were weak across the board, with the exception of nickel, while Iron ore gained marginally.
· Domestically, investors will focus on RBA’s July meet, with a 58% chance of a rate cut by an aggregate of economists as of this morning.
· The September SPI Futures is indicating the ASX 200 to open with little change, howering around the 6065 level this morning.
Have a great day!
James & the Market Matters Team
Disclosure
Market Matters may hold stocks mentioned in this report. Subscribers can view a full list of holdings on the website by clicking here. Positions are updated each Friday, or after the session when positions are traded.
Disclaimer
All figures contained from sources believed to be accurate. All prices stated are based on the last close price at the time of writing unless otherwise noted. Market Matters does not make any representation of warranty as to the accuracy of the figures or prices and disclaims any liability resulting from any inaccuracy.
Reports and other documents published on this website and email (‘Reports’) are authored by Market Matters and the reports represent the views of Market Matters. The Market Matters Report is based on technical analysis of companies, commodities and the market in general. Technical analysis focuses on interpreting charts and other data to determine what the market sentiment about a particular financial product is, or will be. Unlike fundamental analysis, it does not involve a detailed review of the company’s financial position.
The Reports contain general, as opposed to personal, advice. That means they are prepared for multiple distributions without consideration of your investment objectives, financial situation and needs (‘Personal Circumstances’). Accordingly, any advice given is not a recommendation that a particular course of action is suitable for you and the advice is therefore not to be acted on as investment advice. You must assess whether or not any advice is appropriate for your Personal Circumstances before making any investment decisions. You can either make this assessment yourself, or if you require a personal recommendation, you can seek the assistance of a financial advisor. Market Matters or its author(s) accepts no responsibility for any losses or damages resulting from decisions made from or because of information within this publication. Investing and trading in financial products are always risky, so you should do your own research before buying or selling a financial product.
The Reports are published by Market Matters in good faith based on the facts known to it at the time of their preparation and do not purport to contain all relevant information with respect to the financial products to which they relate. Although the Reports are based on information obtained from sources believed to be reliable, Market Matters does not make any representation or warranty that they are accurate, complete or up to date and Market Matters accepts no obligation to correct or update the information or opinions in the Reports. Market Matters may publish content sourced from external content providers.
If you rely on a Report, you do so at your own risk. Past performance is not an indication of future performance. Any projections are estimates only and may not be realised in the future. Except to the extent that liability under any law cannot be excluded, Market Matters disclaims liability for all loss or damage arising as a result of any opinion, advice, recommendation, representation or information expressly or impliedly published in or in relation to this report notwithstanding any error or omission including negligence.