Can MM find a gem amongst the 10 cheapest large caps? – Part 2 (VUK, BOQ, BEN, RIO, DOW)
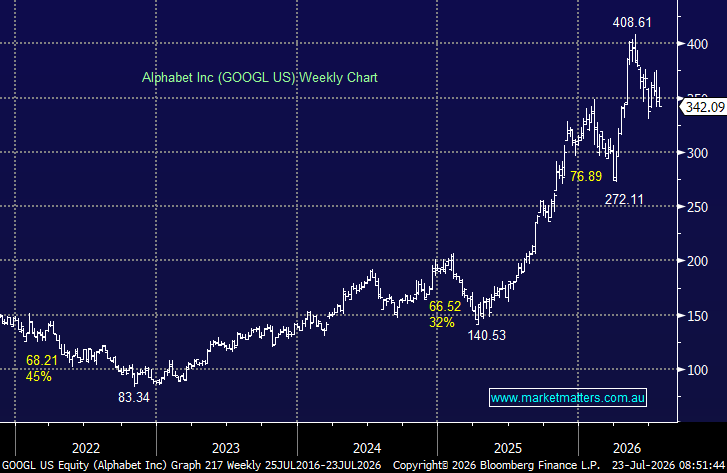
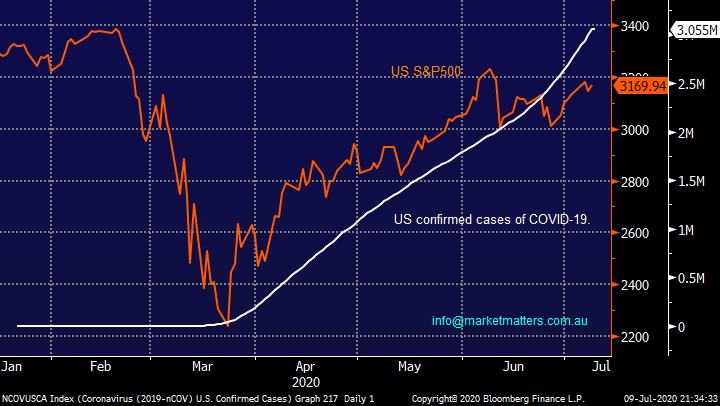
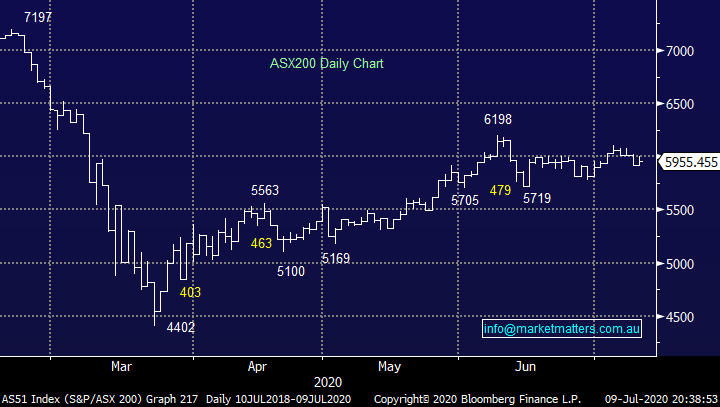
The ASX200 continues to rotate between 5700 and 6200, its starting to feel overdue for a breakout and considering equities have absorbed so much bad news of late I still feel a break above 6200 is the more likely. However, considering we remain almost smack in the middle of the range there are no clear numerical signs at present. Growing concerns around COVID-19 in both Victoria and the US continues to dominate the news but equities still appear relatively unfazed, the US is accelerating up the infection curve but the S&P500 remains less than 7% below its all-time high as the “Big 5” which now make up ~20% of the index continue to charge ahead i.e. Microsoft (MSFT US), Apple (AAPL US), Alphabet (GOOGL US), Amazon (AMZN US) and Facebook (FB US).
We own the first 3 in our International Portfolio for a combined weight of 20% but it’s never enough when we see such huge sector outperformance. Overnight the broad-based S&P500 slipped -0.8% but the NASDAQ again enjoyed gains of +0.8%, overall, pretty impressive considering US virus cases breached 60,000 for the first time ever as the world’s largest economy struggles badly with COVID-19. Stocks appear relatively comfortable as the unknown factors around the pandemic fade away and investors look 6-18 months ahead, if they traded in the present, we should be testing the March lows! The problem is for the bears /cashed up buyers looking for bargains is they’re on the crowded side of the fence, sentiment remains extremely cautious with “bullish consensus” close to 20%, a major contrarian bullish indicator.
Short-term the technology stocks certainly feel overbought, and some may say they are in a valuation bubble but if MM is correct and a new bull market started in March the mega technology stocks should rally further into next year, hence any bubble will very likely inflate much further i.e. we continue to advocate buying pullbacks and tweaking portfolios into strength. Tactically we expect broad based all-time highs in global equities with value stocks likely to become the centre of attention when investors eventually look over their shoulders for “cheap” options.
MM remains bullish global equities.
US S&P500 Index v Cases of COVID-19 Chart
While MM is by definition remains in ”sell mode” because we are almost fully invested in both of our Growth & Income Portfolios it doesn’t mean we are bearish – remember MM still believes that the way to add value (alpha) through 2020 / 21 is to buy weakness & sell strength while maintaining a distinctive positive bias. Interestingly when we look at the chart of the ASX200 below the similarities between the April / May period and the current June / July consolidation are very clear, we favour an eventual pop above 6200 when MM will consider de-risking slightly.
MM still remains overall bullish equities medium-term.
ASX200 Index Chart
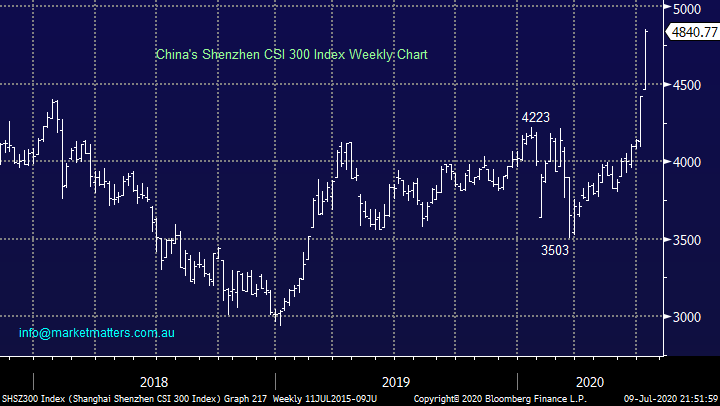
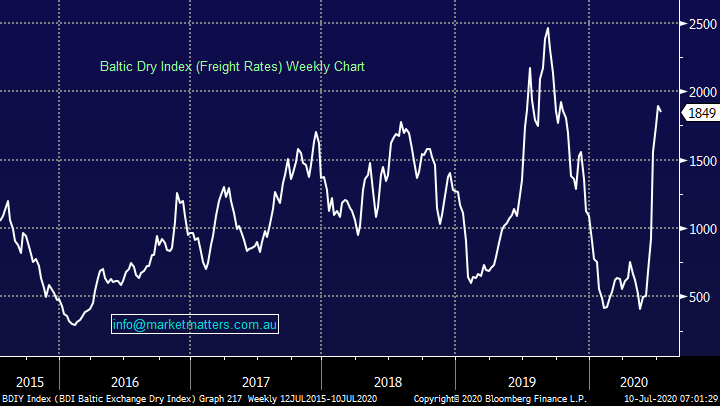
The last 2-weeks have seen China’s stocks soar almost 20% as the uninterrupted daily gains now equal the lucky Chinese number 8 on a combination of retail buying and apparent “official support” – whatever the US can do with the NASDAQ China can do better! MM has been bullish the Chinese Index primarily because of the positive backdrop of the correlated Baltic Dry Index – MM is bullish Chinese stocks, we don’t believe this is a breakout to fade.
The advance by Chinese stocks and the Baltic Dry Index (freight rates) supports our bullish macro outlook for copper, $A and the overall “reflation trade” i.e. its time to be long resources. Also, MM believes the $US is entering a bear market which will on the sector front will add a major tailwind to our anticipated reflation viewpoint into at least 2021.
MM is bullish the reflation trade.
China’s Shenzhen CSI 300 Index Chart
Baltic Dry Index Chart
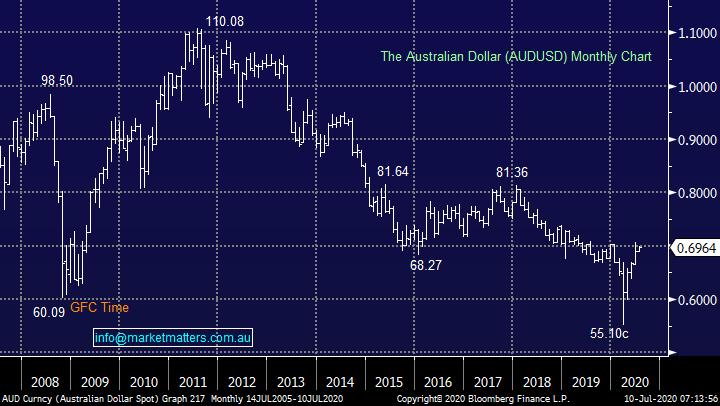
We believe the $A bottomed in March while the USD is probably in the early stages of a cyclical bear market initially into 2021, our first target for the $A is ~80c. Hence while we remain bullish stocks moving forward, I am cautious the “$US earners” who have outperformed over the last decade, offshore earnings alone is not a reason to buy a stock in our opinion.
MM remains bullish $A and cautious $US earners.
Australian Dollar ($A) Chart
Global Markets.
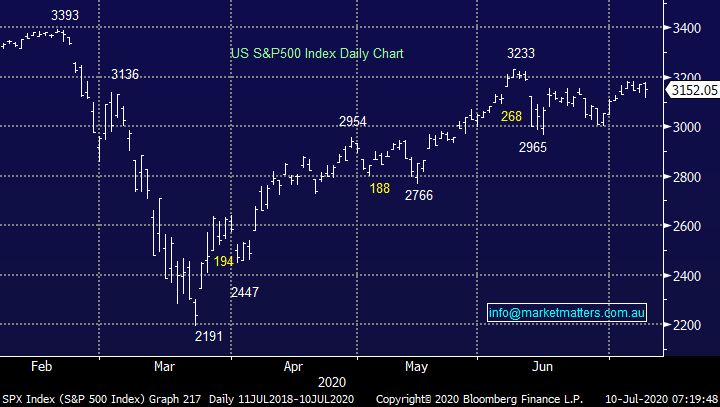
Overnight the US stocks were mixed with the Dow falling -1.4% while the NASDDAQ rallied +0.8% as Energy & Financials weighed on the market. As I said earlier considering over 3 million people have now tested positive for the virus in the US consolidation within striking distance of an all-time high is an epic performance. Also we saw an almost 10% leap in the record number of fresh daily cases to more than 60,000 with California & Texas both adding 10,000 cases for the day – Texas has a population similar to our own yet they registered more cases in 1-day than our total COVID-19 cases since the outbreak started! Remember a market that ignores bad news is a strong market.
MM remains bullish US stocks medium-term.
US S&P500 Index Chart
Can MM find a gem amongst the 10 cheapest large caps?
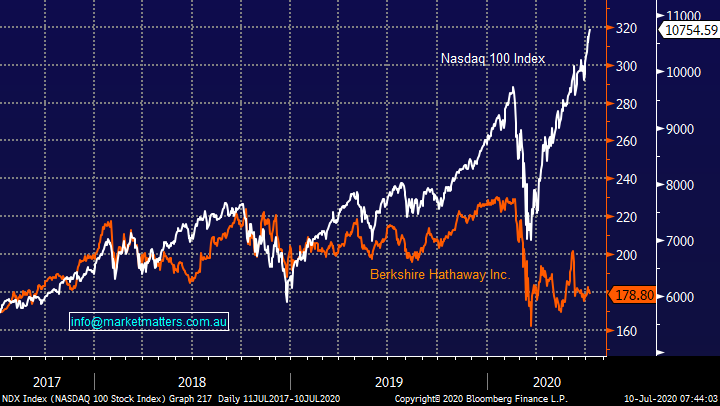
In many peoples opinion market valuations have become completely disjointed from economic reality considering we’re in a global recession and many businesses/sectors are clearly struggling, but most fingers are pointed at the tech based NASDAQ which continues to soar to fresh all-time highs in the face of bad macro news. A great illustration of how the old fashioned value investors have struggled over the last year is portrayed by a comparison of the NASDAQ and Warren Buffett’s Berkshire Hathaway – a picture tells a thousand words!
NASDAQ 100 Index v Berkshire Hathaway Inc Chart
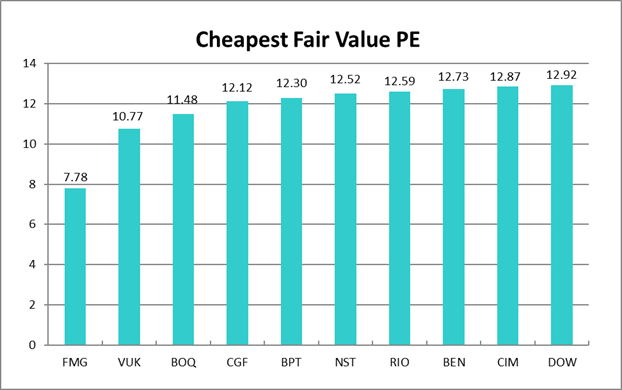
Below are the cheapest 10 (excluding loss makers or marginally profitable stocks) which we showed in Part 1, today I will look at the second 5.
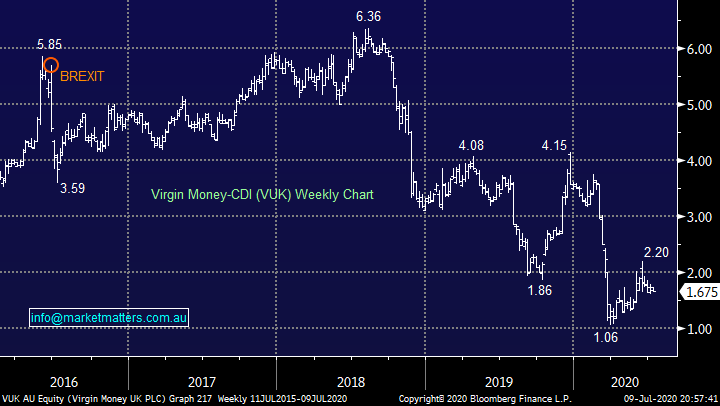
1 Virgin Money -CDI (VUK) $1.67
VUK has endured a tough 2020 more than halving while our preferred pick of the sector CBA is only down less than 12%, actually outperforming the underlying index. The UK based Virgin Money which we previously knew as Clydesdale (CYB) has experienced an extremely choppy 12-months, culminating with the merger / takeover from Virgin Money. This deal was an important one for CYB giving them a better brand and better distribution networks which they clearly lacked. There is an aggressive cost out program underway which has yielded mixed results and there is a lot more to do in this context, while they also have a poor funding mix to contend with.
Theoretically, a bounce in UK economic actively should have a strong positive influence on VUK, however it is clearly a volatile beast and not for the faint hearted as we see below it can both half and double in the blink of an eye.
MM is neutral VUK
Virgin Money -CDI (VUK) Chart
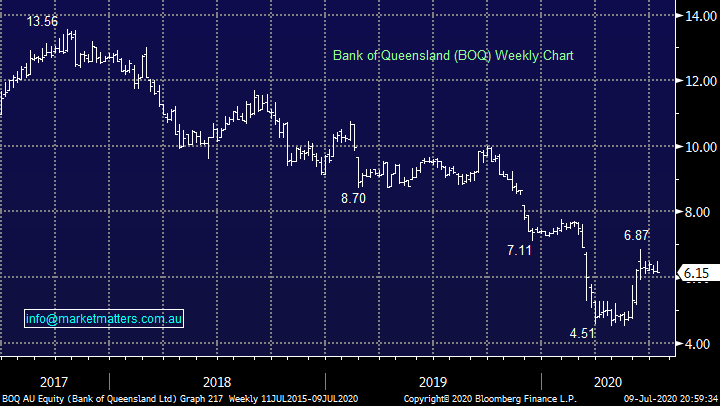
2 Bank of Queensland (BOQ) $6.15
Regional Queensland based bank BOQ is theoretically cheap trading at a substantial discount to the value of its assets., this generally happens when the mentioned assets are expected to lose money, yet our banks are still very profitable. Assessing this in the context of time suggests banks trading sub 1x book are cheap with BOQ and Bendigo (BEN) both under 0.7x at the extreme end of the scale. At MM we expect the current spike / provisioning for bad debts to normalise hence profitability will return which will flow through to dividends.
MM likes BOQ as an aggressive play under $5.90.
One option to MM would be a slight migration up the “risk curve” through switching a small part of our large CBA holding.
Bank of Queensland (BOQ) Chart
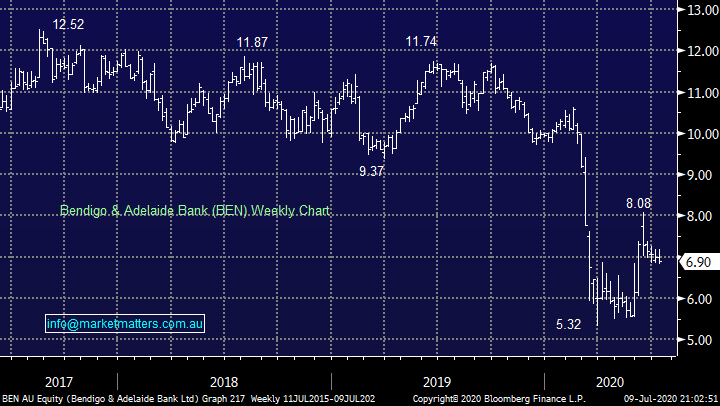
3 Bendigo & Adelaide Bank (BEN) $6.90
Regional Victoria based bank BEN is a very similar tale to BOQ and we can see ~20% upside from current levels.
MM likes BEN into weakness under $6.80.
Bendigo & Adelaide Bank (BEN) Chart
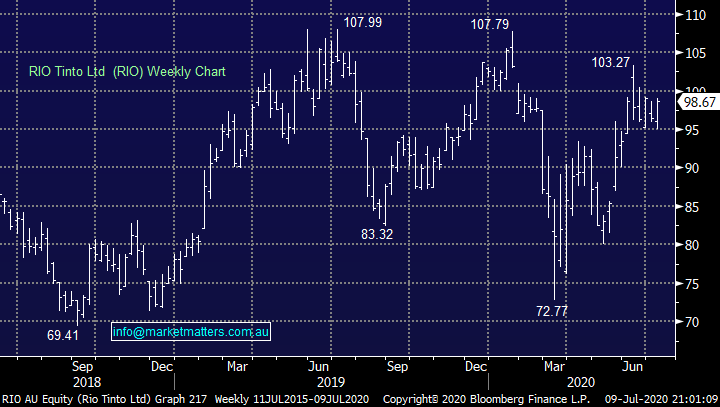
4 RIO Tinto (RIO) $98.67
Diversified miner RIO resides in both the MM Growth and Income Portfolios and to-date it has not disappointed. As subscribers know we like the “reflation trade” hence the only reason for us to sell / switch RIO at this stage is to migrate away from iron ore where we also have exposure through our holding in BHP Group (BHP).
MM remains bullish RIO targeting a test of $107 in the coming months.
RIO Tinto (RIO) Chart
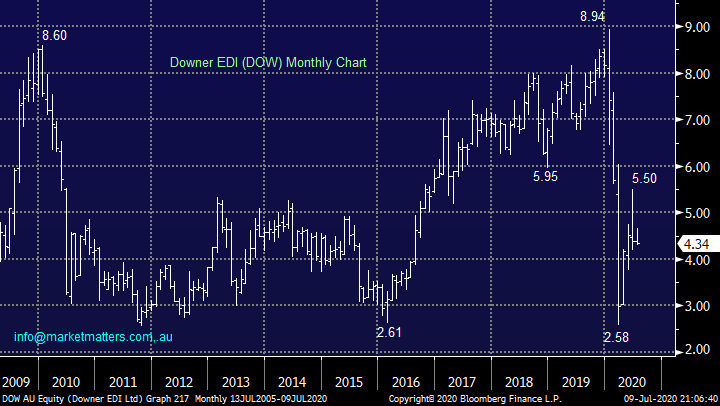
5 Downer EDI (DOW) $4.34
Infrastructure sector should be well positioned over the next 18-months, but investors are clearly unconvinced with the share price noticeably underperforming. At the end of April, DOW provided an update on their funding position, extending some facilities and confirming they have no debt maturing until the end of FY21. Gearing sits at around 40% versus loan covenants at 50%. With most contracts currently with the government this looks a good risk / reward play, but the momentum is average so for the keen we would be looking to accumulate closer to $4.
We have elected to buy LLC recently in the Growth Portfolio for infrastructure exposure which has also struggled recently, not helped by Victoria’s fresh virus outbreaks.
MM is neutral DOW.
Downer EDI (DOW) Chart
Conclusion
Of the 5 stocks looked at today MM likes RIO today, BOQ & BEN into a little weakness while we are neutral VUK & DOW.
Overnight Market Matters wrap
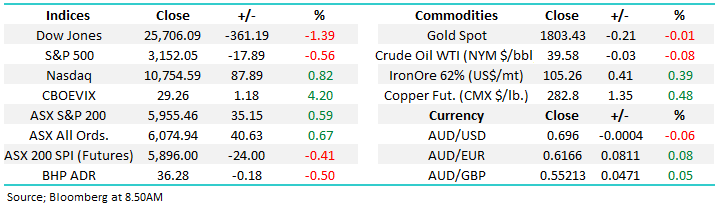
The DOW fell 361 points (1.39%) last night, while the S&P dropped 17 points (0.56%). The moves were off the back of Coronavirus resurgent fears. In contrast, the NASDAQ registered another record closing high, up 55 points (0.53%), as the tech heavy index was bolstered by Amazon, Apple and Microsoft.
On the commodities front, Gold was trading at US$1807.7/oz. Base metals had an ok night with Copper rising 1.13%, while Nickel fell almost 2%. Iron ore rallied was flat for the session and is trading at $106.32 a tonne. The AUD had a slightly better night and is trading at A$0.6962, while the futures are pointing to a dour start, down 24 points.
Have a great day!
James & the Market Matters Team
Disclosure
Market Matters may hold stocks mentioned in this report. Subscribers can view a full list of holdings on the website by clicking here. Positions are updated each Friday, or after the session when positions are traded.
Disclaimer
All figures contained from sources believed to be accurate. All prices stated are based on the last close price at the time of writing unless otherwise noted. Market Matters does not make any representation of warranty as to the accuracy of the figures or prices and disclaims any liability resulting from any inaccuracy.
Reports and other documents published on this website and email (‘Reports’) are authored by Market Matters and the reports represent the views of Market Matters. The Market Matters Report is based on technical analysis of companies, commodities and the market in general. Technical analysis focuses on interpreting charts and other data to determine what the market sentiment about a particular financial product is, or will be. Unlike fundamental analysis, it does not involve a detailed review of the company’s financial position.
The Reports contain general, as opposed to personal, advice. That means they are prepared for multiple distributions without consideration of your investment objectives, financial situation and needs (‘Personal Circumstances’). Accordingly, any advice given is not a recommendation that a particular course of action is suitable for you and the advice is therefore not to be acted on as investment advice. You must assess whether or not any advice is appropriate for your Personal Circumstances before making any investment decisions. You can either make this assessment yourself, or if you require a personal recommendation, you can seek the assistance of a financial advisor. Market Matters or its author(s) accepts no responsibility for any losses or damages resulting from decisions made from or because of information within this publication. Investing and trading in financial products are always risky, so you should do your own research before buying or selling a financial product.
The Reports are published by Market Matters in good faith based on the facts known to it at the time of their preparation and do not purport to contain all relevant information with respect to the financial products to which they relate. Although the Reports are based on information obtained from sources believed to be reliable, Market Matters does not make any representation or warranty that they are accurate, complete or up to date and Market Matters accepts no obligation to correct or update the information or opinions in the Reports. Market Matters may publish content sourced from external content providers.
If you rely on a Report, you do so at your own risk. Past performance is not an indication of future performance. Any projections are estimates only and may not be realised in the future. Except to the extent that liability under any law cannot be excluded, Market Matters disclaims liability for all loss or damage arising as a result of any opinion, advice, recommendation, representation or information expressly or impliedly published in or in relation to this report notwithstanding any error or omission including negligence.