Gold “feels” poised to follow in the NASDAQ’s footsteps – time for some profit taking? (WES, Z1P, APT, GDX US, NCM, NST, EVN)
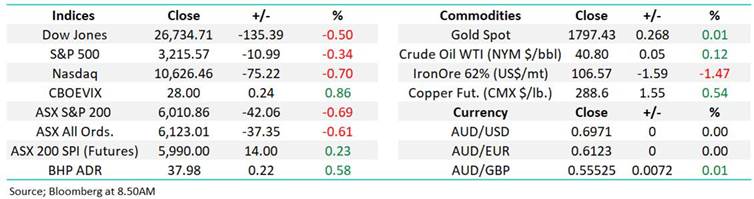
Yesterday the ASX200 gave back half of Wednesdays impressive gains as yet again the magnetic powers of the 6000area rule supreme. The market slipped steadily lower throughout the day as the pressure of another record number of fresh COVID-19 cases in Victoria plus the US futures slipping -0.5% in their after-market proved too much to sustain early small market gains. As seasoned traders often say “don’t fight the trend” and its currently sideways, attempted breakouts are failing in both directions!
Last night Scott Morrison acknowledged that “tough times and uncertainty are here to stay until a vaccine is found”, I certainly cannot argue with his sentiment or reasoning but what he didn’t highlight was this could literally last for years – a very daunting prospect. The current Prime Minister certainly has an uphill battle on the economic front, only a fortnight ago people were anticipating the JobKeeper might be reined in before its planned September end-date now suddenly the rhetoric has reverted to how will the government extend its stimulus measures into Christmas, one thing for sure is the Liberals need to maintain some semblance of confidence, especially in the property market where so many Australians are heavily leveraged.
Yesterday saw our Unemployment rate increase to a 22-year high of 7.4%, there were no major surprises in the data with bond & FX markets hardly raising an eyebrow. The PM nailed it in my opinion when he called “the job market a war where we’re only seeing the early skirmishes”. Everybody knows by now the fears bubbling away when/ if the JobKeeper ends, it feels to me like another “flattening of the curve” which the government must try and negotiate, if everything is cut off on September 30th the economy could easily fall into an abyss.
A quick glance at the Australian unemployment figures shows how good things were looking before the coronavirus – seems like a long time ago now!
Australian Unemployment Rate Chart
Source: Australian Bureau of statistics.
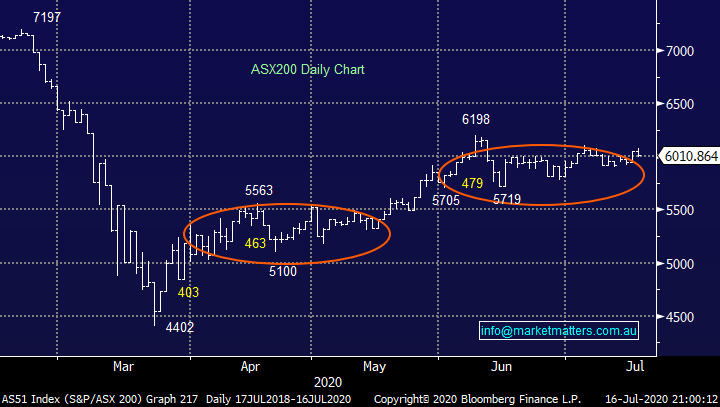
Local stocks continue to tread water with no apparent signs of fatigue, we remain bullish over the next 12-18 months given the size of stimulus relative to our health problems but short-term it continues to be a guessing game!
MM still remains bullish equities medium-term.
ASX200 Index Chart
I finally read a story in the Financial Review that made me feel good and I felt compelled to share it with our subscribers in case anybody missed it – Bunnings (Wesfarmers) are paying a $1000 “essential workers” bonus to their staff, a great gesture in my opinion considering the famous stores remained open under trying conditions throughout the height of the pandemic Hopefully things will totally return to normal sooner rather than later and the sausage sizzle will return, numerous local sports teams etc rely on the income from these iconic breakfast of champions!
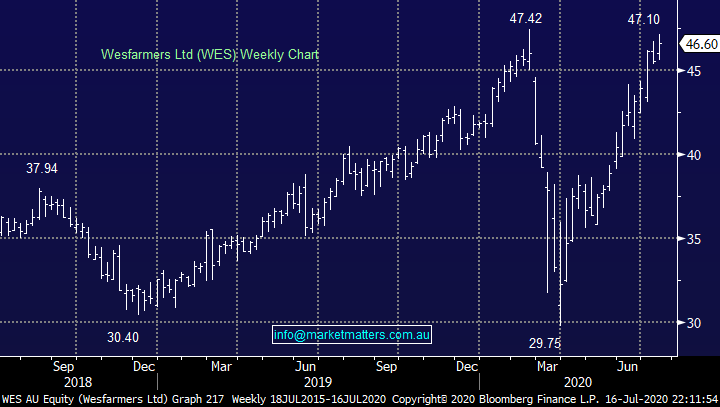
The company has demonstrated that you can be both a successful and generous business as its stock tests its all-time high having rallied almost 60% from its March low and while it feels like it needs a rest it remains a quality stock that looks destined for higher prices – happily WES is MM’s latest purchase for our Income Portfolio and its already showing a healthy 25% profit after just 2-months : https://www.marketmatters.com.au/new-income-portfolio-csv/
MM likes WES medium-term.
Wesfarmers (WES) Chart
Global Markets.
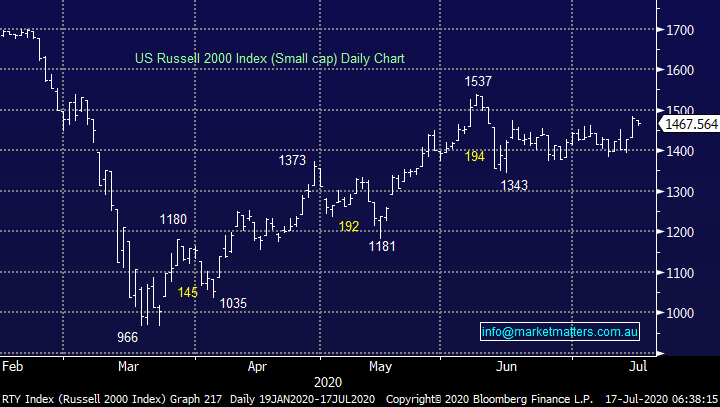
While the global tech sector continues to take a well-earned rest the small cap end of town is finally outperforming, overnight we saw the Russell 2000 only surrender a small part of its strong +3.5% gains on Wednesday. Our target for the often-ignored Russell 2000 index is still ~8% higher which bodes extremely well for the highly correlated local stocks short-term and especially the high Beta (volatile) end of the curve.
MM remains bullish US small caps at today levels.
US Russell 2000 Index Chart
Will gold experience a pullback similar to the high performing tech stocks?
It doesn’t matter how great a company / stock is only a certain valuation can be justified and even when everybody jumps on board a quality name (including fickle momentum traders) pullbacks are just a matter of course. This week has seen another 6.3% pullback by the NASDAQ as stocks like Apple (AAPL US) and Microsoft (MSFT US) took a well-earned rest, we hold both in the MM International Portfolio and see no reason to reducing our exposure at this stage. MM remains bullish these high performing names who have driven the broad US indices ever higher although we do anticipate diminishing momentum and a degree of relative underperformance – MM particularly likes the phrase “buy weakness & sell strength” with the high valuation growth sector.
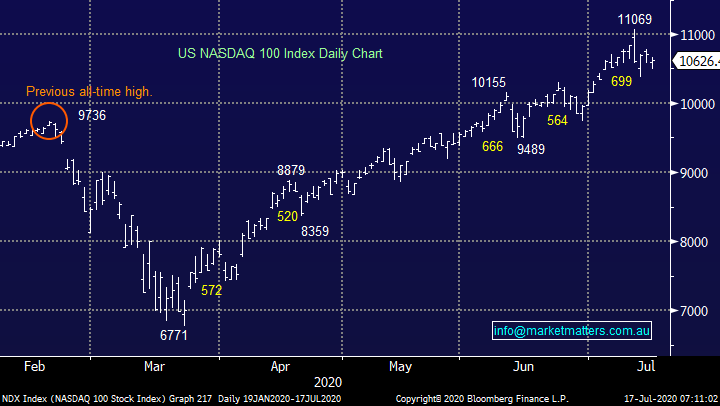
Considering the NASDAQ has soared well over 60% to fresh all-time highs post the panic March sell-off in equities it’s not surprising we’re witnessing a few pullbacks, during its meteoric advance we’ve now seen dips of 7.1%, 5.9%, 6.6%, 5.5% and now the latest 6.3%. The pattern remains clear for now, there are plenty of buyers into pullbacks and we continue to see higher highs & higher lows = the perfect bullish trend. Until we see central banks / governments take their foot off the stimulus gas we believe the quality tech names will remain solid.
MM remains bullish the tech-based NASDAQ.
US NASDAQ 100 Index Chart
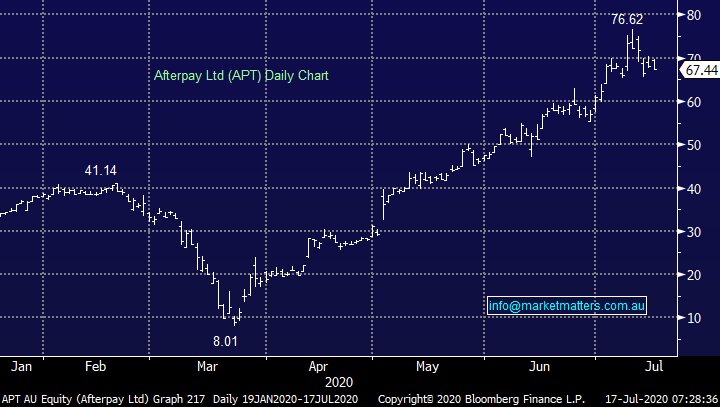
The pullback in the US growth sector flowed through into our own space which has seen a number of high profile names pullback by similar amounts, e.g. over the last month Wisetech (WTC) -6%, Technology One (TNE) -7% and Altium (ALU) -6.2%. By definition its the high beta (volatile compared to the index) end of town who have run the hardest which become the most vulnerable to a deeper pullback and we’ve witnessed exactly this play out in the BNPL (buy now pay later) space since we wrote our report earlier in the week, great timing!
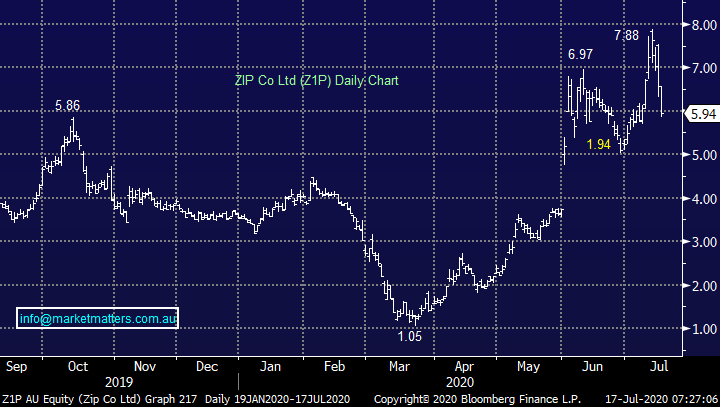
We’ve seen Z1P in which we have a small 2% initial holding react poorly to a good report earlier in the week, a definite sign that some profit taking is rolling through the space. This morning we had a Zoom link up with management and they talked to growth rates from Quadpay, which was the area of the recent quarterly update that had the market somewhat concerned. The rhetoric here was given around dialling back risk, tightening credit criteria hence customer acquisition remained high however transaction volumes were behind some expectations in the market. We will be monitoring this carefully to ensure it doesn’t evolve into something more.
The stock has come back to ~$6.00, the level we flagged to add to our position. For now, we’ll wait for downside momentum to slow before pulling the trigger.
MM feel the volatility in the BNPL will remain elevated over coming months – it’s a high-risk area of the market.
ZIP Co (Z1P) Chart
Afterpay Ltd (APT) Chart
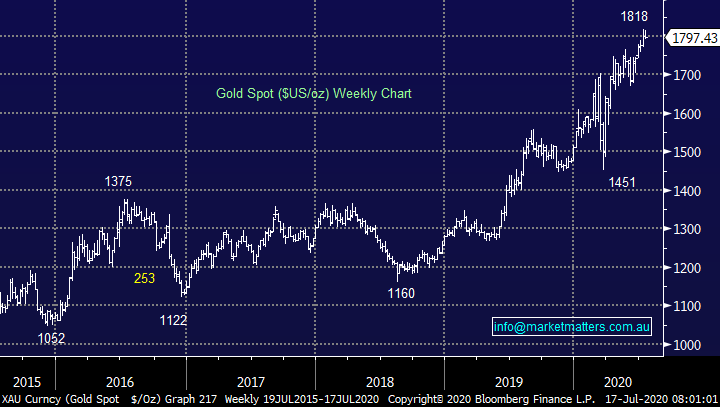
Moving onto the Gold Sector where MM is keen to establish a position, the question we ask ourselves is should we be chasing gold related stocks as the underlying precious metal makes a multi-year high. I have mixed feelings around this $US1800/oz area especially as we’re now seeing some profit taking in the tech space, perhaps gold will follow - MM wants to have gold exposure but a quick $US50-100 pullback would not surprise, we feel it’s probably a 50-50 scenario. The markets bullish & long gold, just like the major tech stocks, hence a quick sharp correction is a very real possibility.
MM is neutral gold short-term.
Gold ($US/oz) Chart
Firstly, when we consider the underlying Australian gold stocks they are relatively optimistically priced hence creating heightened short-term risks i.e. fresh/continued tailwinds look required to remain at current levels, or in other words they are already pricing in a higher gold price.
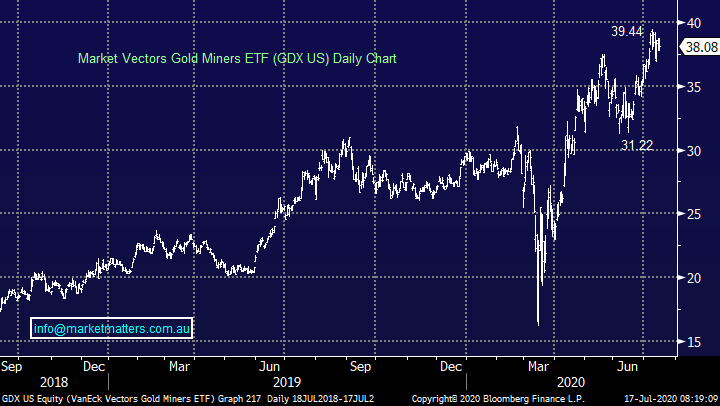
Gold ETF’s enjoyed a stellar 2020, interestingly producing a very similar chart pattern to the NASDAQ index. They have slowed their advance over the last few weeks, but the pullback has been fairly muted, we believe investors should have a plan for a potential 10-15% correction, hardly a dent in the advance since March. However, the underlying view is MM wants to be long gold and its all about how & where.
MM is looking for areas to establish gold exposure through stock (s) plus a gold ETF for our Macro Portfolio.
Market Vectors Gold Miners ETF (GDX US) Chart
Today I have only looked at 3 Australian gold stocks because it’s time to “keep it simple stupid” (KISS) :
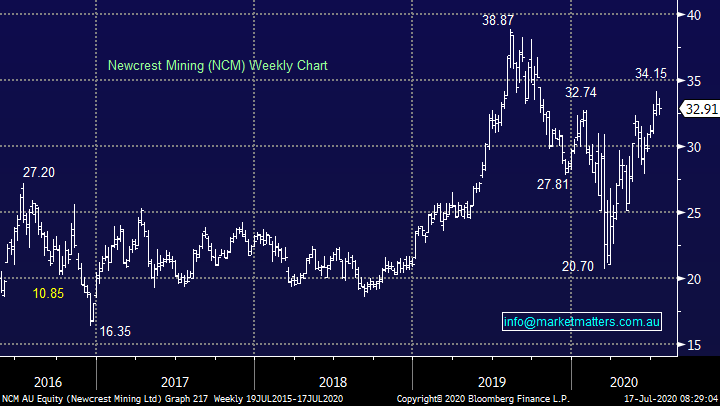
1 Newcrest Mining (NCM) $32.91
To MM heavyweight NCM looks cheap compared to its peers making it our current preferred buy for our Growth Portfolio, the question is simply where do we start accumulating. At this stage the $32 area is appealing while leaving $$’s to average any dip down towards / below $30.
MM is bullish NCM with an initial ~$40 target.
Newcrest Mining (NCM) Chart
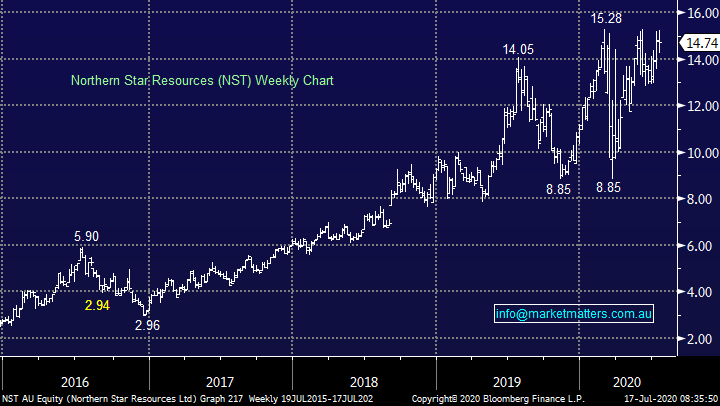
2 Northern Star (NST) $14.74
NST has been a stellar performer over the last 5-years but the risk / reward around the current $15 area is not particularly exciting although we ultimately anticipate a breakout to the upside in 2020.
MM is neutral / bullish NST at current levels.
Northern Star (NST) Chart
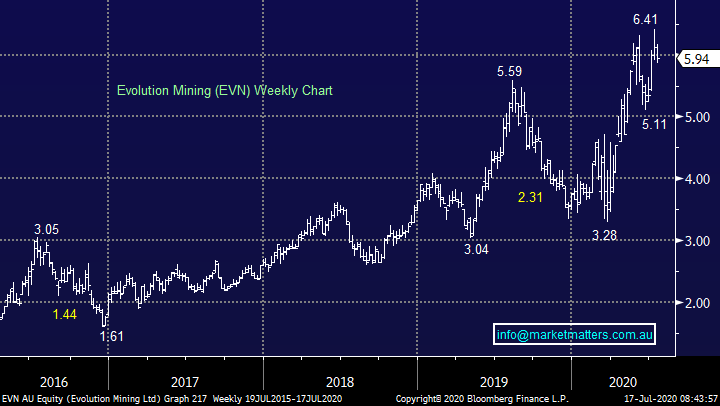
3 Evolution Mining (EVN) $5.94
Evolution appears to be struggling after making fresh multi-year highs last week, a further 10% pullback would not surprise where we feel it will provide attractive risk / reward.
MM is bullish EVN from lower levels.
Evolution Mining (EVN) Chart
Conclusion
MM remains bullish the gold sector, but we will remain patient just for now BUT watch this space we anticipate buying at least Newcrest Mining (NCM) in the coming weeks.
*Watch for alerts.
Have a great day!
James & the Market Matters Team
Disclosure
Market Matters may hold stocks mentioned in this report. Subscribers can view a full list of holdings on the website by clicking here. Positions are updated each Friday, or after the session when positions are traded.
Disclaimer
All figures contained from sources believed to be accurate. All prices stated are based on the last close price at the time of writing unless otherwise noted. Market Matters does not make any representation of warranty as to the accuracy of the figures or prices and disclaims any liability resulting from any inaccuracy.
Reports and other documents published on this website and email (‘Reports’) are authored by Market Matters and the reports represent the views of Market Matters. The Market Matters Report is based on technical analysis of companies, commodities and the market in general. Technical analysis focuses on interpreting charts and other data to determine what the market sentiment about a particular financial product is, or will be. Unlike fundamental analysis, it does not involve a detailed review of the company’s financial position.
The Reports contain general, as opposed to personal, advice. That means they are prepared for multiple distributions without consideration of your investment objectives, financial situation and needs (‘Personal Circumstances’). Accordingly, any advice given is not a recommendation that a particular course of action is suitable for you and the advice is therefore not to be acted on as investment advice. You must assess whether or not any advice is appropriate for your Personal Circumstances before making any investment decisions. You can either make this assessment yourself, or if you require a personal recommendation, you can seek the assistance of a financial advisor. Market Matters or its author(s) accepts no responsibility for any losses or damages resulting from decisions made from or because of information within this publication. Investing and trading in financial products are always risky, so you should do your own research before buying or selling a financial product.
The Reports are published by Market Matters in good faith based on the facts known to it at the time of their preparation and do not purport to contain all relevant information with respect to the financial products to which they relate. Although the Reports are based on information obtained from sources believed to be reliable, Market Matters does not make any representation or warranty that they are accurate, complete or up to date and Market Matters accepts no obligation to correct or update the information or opinions in the Reports. Market Matters may publish content sourced from external content providers.
If you rely on a Report, you do so at your own risk. Past performance is not an indication of future performance. Any projections are estimates only and may not be realised in the future. Except to the extent that liability under any law cannot be excluded, Market Matters disclaims liability for all loss or damage arising as a result of any opinion, advice, recommendation, representation or information expressly or impliedly published in or in relation to this report notwithstanding any error or omission including negligence.