Do we still like commodities after golds plunge? (REH, AAPL US, 700 HK, BPT, RIO)
LOCAL REPORTING CALENDAR: CLICK HERE **Please note, data sourced from Bloomberg, not all ASX companies are on this list and dates can vary**
Today we have results from AGL, AMP, BRG, EVN, GMG, IVC, ORA, QBE, SUL, TLS, TWE & WPL, I cover AGL, BRG, GMG, TLS, TWE in the recording below.

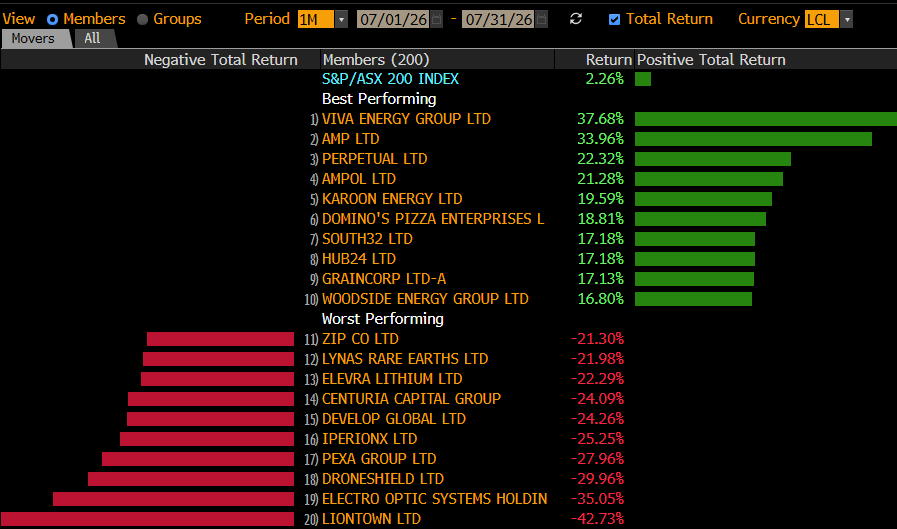
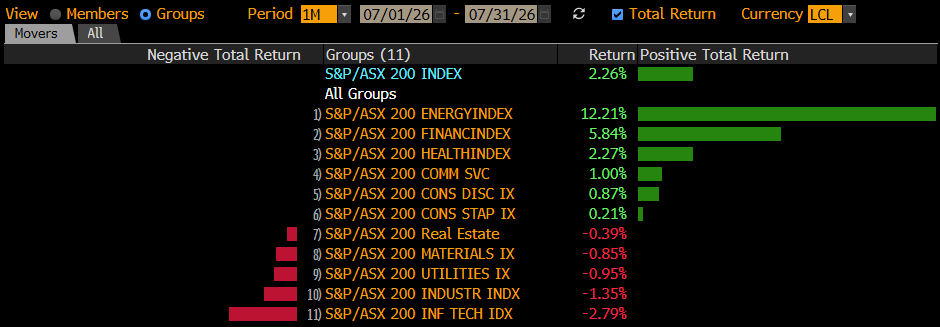
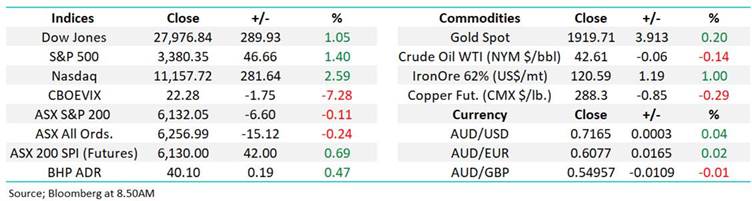
The ASX200 had a fairly quiet Wednesday with losers just nudging winners by the close, the Financial Sector was again best on ground while the IT, Telco and Gold Sectors took the wooden spoon. While the influential banks can maintain their recent upside momentum the local index should remain firm but as reporting season unfolds and the macro-economic backdrop continues to challenge long-term well established trends the volatility under the hood looks likely to remain elevated on both the stock & sector level – in simple terms investors keep changing their minds around what comes next.
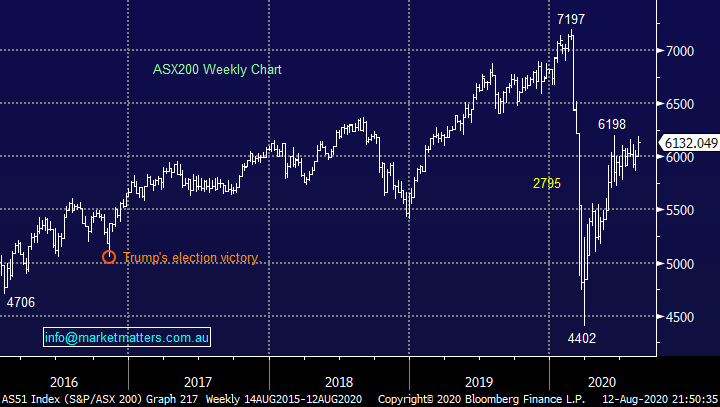
Overnight the US has seen another reversion of the previous days relative performance with IT and Healthcare Sectors enjoying strong sessions while the financials were quiet even as bond yields continued to rally, another example that this decade old trend will require some major changes on the economic front before we see a sustained major rotation – for clarification we do believe that value stocks will finally enjoy some relative catch up on the performance front but we are bullish the whole market over the next 12-18 months. My preferred technical picture would be some consolidation by the ASX200 between 5800 and 6400 over the coming months before an assault on 7000 but this is just guesswork, we’re confident it’s going up with the route the main question.
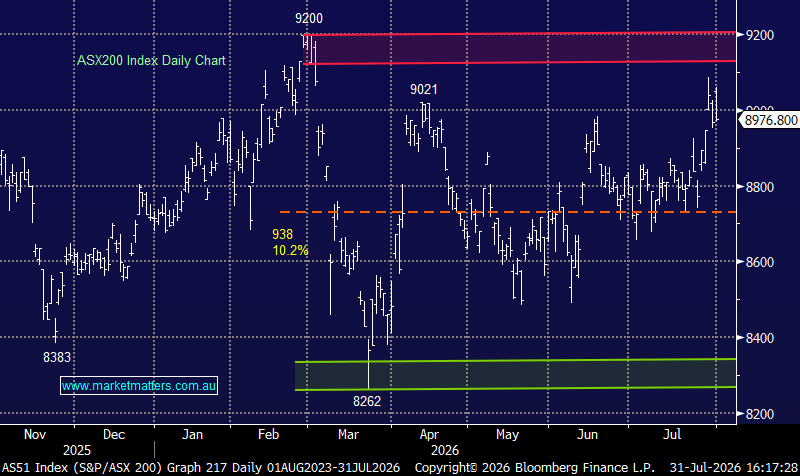
The local index is only 1% below its June high but as heavyweight stocks like Commonwealth Bank (CBA) & BHP Group (BHP) make fresh 5-month highs it feels just a matter of time until we see the index trade through 6200, potentially this week – at this stage we still imagine moving slightly down the risk curve if we see a decent “pop” above 6200, especially if it feels like shorts / underweight fund managers are panic buying.
MM remains bullish the ASX200 medium-term.
ASX200 Index Chart
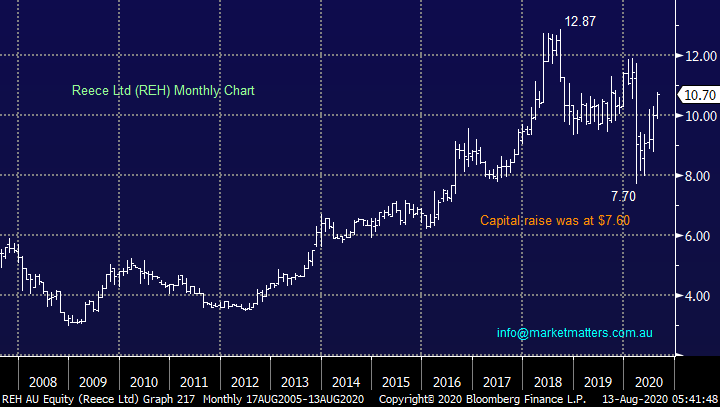
Reece Ltd (REH) is one of our unheralded positions in the MM Growth Portfolio which has been kicking goals of late and we thought it was time to reiterate our bullish outlook – hopefully not the kiss of death! Plumbing and hardware merchant REH has been advancing strongly since March even in the face of a few broker downgrades as they cite risks around trading conditions post COVID-19 given a weak housing market and softening prices but we feel this will be offset by the federal governments stimulus package (s). Also I have noticed extreme weather conditions in the UK summer this year if this is followed by an awful winter freeze in the Northern Hemisphere, especially the US, it will be a bonanza for REH.
MM remains bullish REH initially targeting a break of 2018 highs.
Reece Ltd (REH) Chart
Overseas Indices & markets
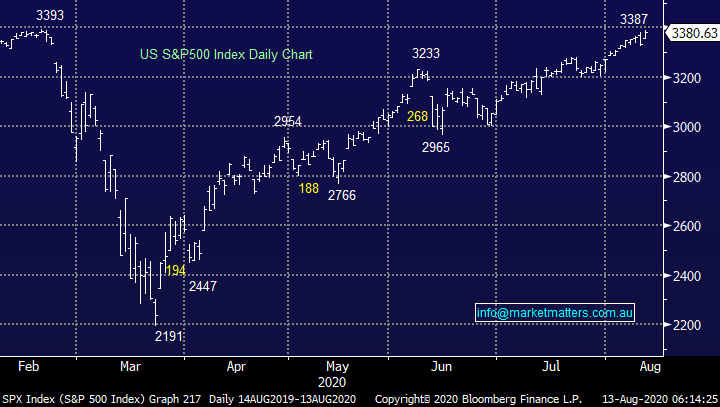
US stocks enjoyed another strong night on Wall Street with the S&P500 now poised only 0.4% away from making a fresh all-time high – MM continues to believe the stock market will climb the wall of worry while investors are long cash hoping / planning to buy at lower levels, of course when / if stocks do retrace many will be too scarred to press the “buy button”. Overall there’s no change in the MM camp, we’re bullish medium-term but a short-term initial pullback from the 3400 area would not surprise but we remain a buyer of dips until further notice.
MM remains bullish US stocks medium-term.
US S&P500 Index Chart
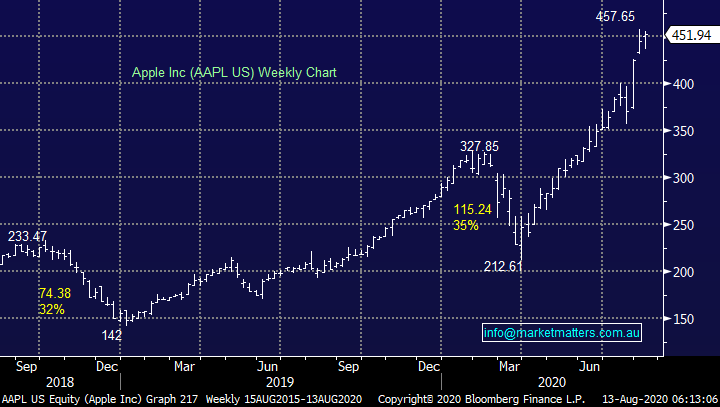
Market heavyweight Apple (AAPL US) is showing us there is absolutely no reason to consider taking some profit anytime soon, a test of $US500 would not surprise sooner rather than later as both the stock and company continue to deliver.
MM is a bullish Apple targeting ~$US500 in 2020.
Apple (AAPL US) Chart.
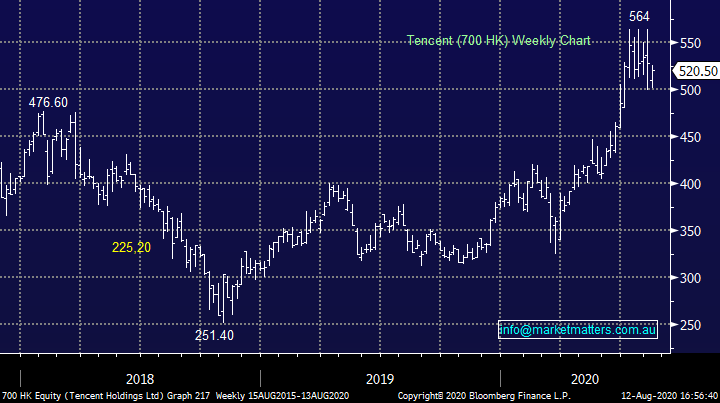
Tencent (700 HK) reported quarterly numbers overnight with revenue growth the best in 2 years generating $US16.5b in sales for the quarter. The area we like most in this business is online gaming with revenue up 40% in the quarter, plus just to reiterate the staggering numbers in this business, they now have 1.2bn users of WeChat & Weixin which is the China equivalent, basically the same at Whatsapp here. We are bullish Tencent despite some ?? over how further Trump will go against China based tech.
Tencent (700 HK) Chart
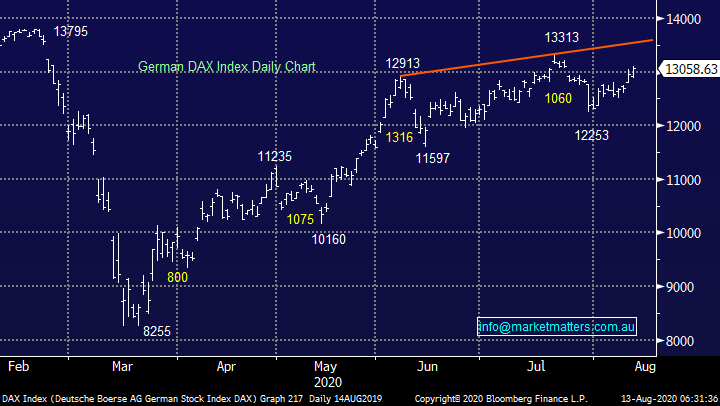
European stocks continue to illustrate that pullbacks in equities are shallower than many expect – including ourselves this time around. Our recent target for the German DAX on the downside was ~below 12,000 but it appears that 8% was enough and the post March bull market is back in play. MM now anticipates another 4-5% upside before resistance might slow things down i.e. buy weakness and only sell decent strength.
MM is a bullish Europe medium-term.
German DAX Index Chart.
What is our favourite commodity after the latest gold crunch.
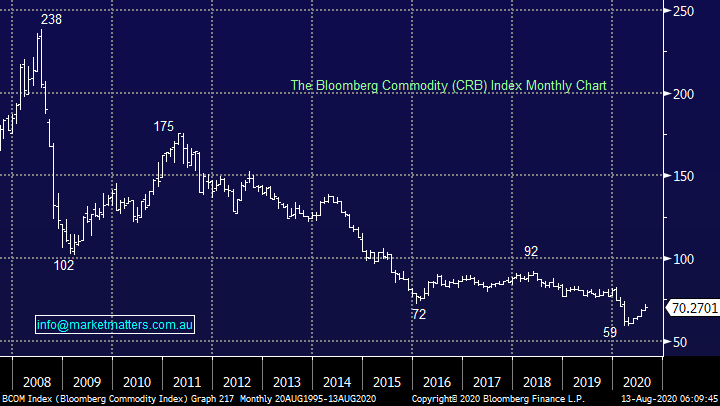
We have been talking about MM’s reflation outlook a lot recently i.e. we anticipate inflation will finally rear its head courtesy of the unprecedented degree of financial stimulus by both global central banks and governments. The entrenched downtrend in the CRB Index illustrated below shows this is clearly a call for a change in trend – the CRB Index is made up of all commodities from precious metals to the energy complex and foodstuffs like soybeans, sugar and corn. Gold might exert the most influence, but it hasn’t been able to offset the numerous bear markets still unfolding in the other markets.
Obviously we are far more interested in the individual commodities when evaluating stocks / sectors but it’s reassuring that a 30-50% rally would hardly dent the decade old downtrend – perhaps I’m wearing rose coloured glasses and the downtrend should be scarring me!
MM remains bullish the “reflation trade”.
Bloomberg CRB Index Chart
1 Precious Metals.
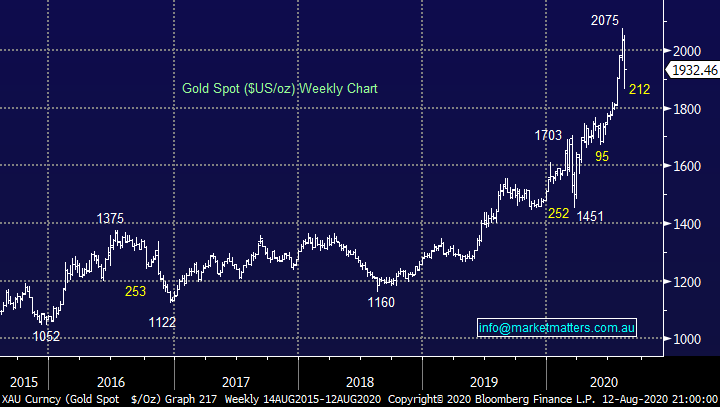
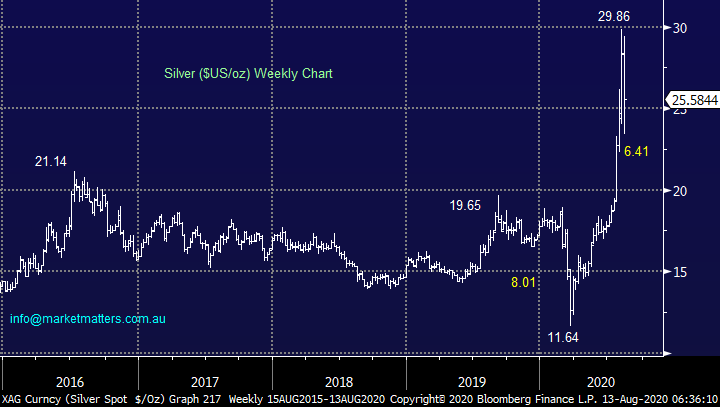
The influence of bond yields on financial markets has been extremely evident over the last few days with gold plunging over $US200/oz, or more than 10% in less than 4-days – we certainly live in interesting times! By 9pm last night the precious metal complex had reversed early losses in a huge way with silver bouncing 10% in just a few hours! However we should ask the question what did the bulls expect, gold had risen for 9 consecutive weeks, its longest winning streak since May, 2006, just this financial year alone the precious metal had risen over 15%.
The irrational exuberance in the precious metal complex has shown the way ahead for us but things needed reining in and they clearly have been, the excited bulls were already inking in the all-time “real” price high set in 1980 of $US2,800/oz. The press was full of gold as were investors portfolio’s, especially the fickle momentum traders hence the perfect recipe for the washout we’ve been calling which has subsequently unfolded. However we believe golds journey is far from over, the latest bullish move was inspired by negative real interest rates only began in late March 2020, just 5-months ago, remember MM believes the gold price could rally for a few years and pullbacks are to be bought.
MM took advantage (hopefully) of this aggressive washout to buy Newcrest Mining (NCM) for our Growth Portfolio and the ETF Securities Silver Bullion ETF (ETPMAG) for our Global Macro ETF Portfolio.
We remain bullish precious metals in the coming months.
Gold $US/oz Chart
Silver $US/oz Chart
2 Energy Stocks
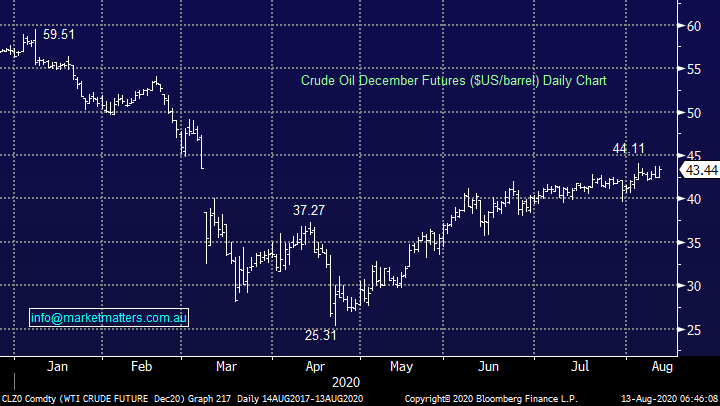
The oil price continues to trade around multi-month highs yet the stocks are well below their equivalent milestone scaled in June, our conclusion is simple – MM believes that the energy sector is materially undervalued and presents excellent risk / reward from current levels. Inventories are already being drawn down due to increasing demand and reduced production, a healthy combination. Also as mentioned earlier in the week we believe Natural Gas has reached a point of inflection leaving only coal to trigger some optimism in the energy complex.
MM remains bullish the Energy Sector.
Crude Oil December Futures ($US/barrel) Chart
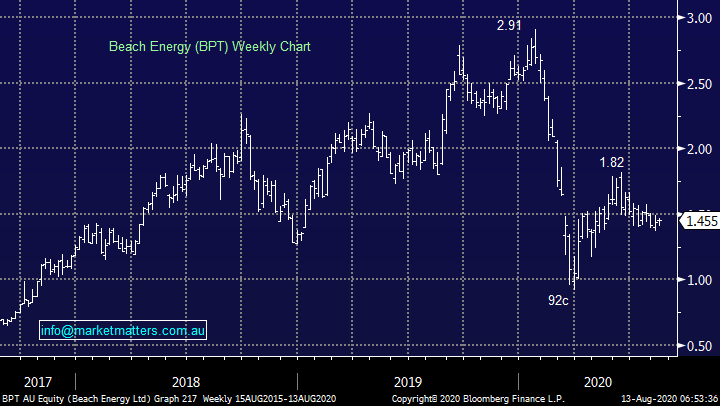
Our preferred exposure is Beach Petroleum (BPT) due to its deep valuation on offer and strong balance sheet i.e. it can fund growth and maintain operations with crude oil at current levels. We also own Woodside (WPL) in our Growth Portfolio, it’s the most conservative option but enjoys the best balance sheet. Hence MM is considering increasing our BPT position.
MM remains bullish BPT medium-term.
Beach Petroleum (BPT) Chart
3 Industrial / Base Metals.
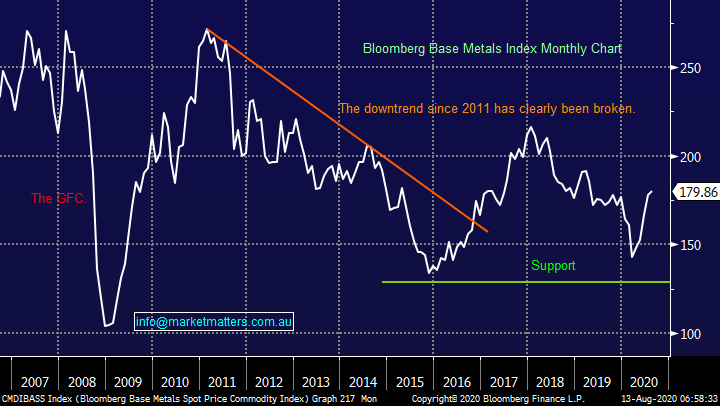
The 50% rally by copper has helped the base metals recover a significant portion of their last few years decline but we believe there’s a lot more left on the upside especially when / if the likes of nickel and aluminium join the party. Dr copper managed to rally over 5% in July but it did fall over 4% last Friday, some further consolidation wouldn’t surprise over the coming weeks.
While we see no reason to exit our copper play via OZ Minerals (OZL) the question we ask is should we be more evenly spread across the metals complex – we also hold Western Areas (nickel) and Alumina (aluminium) plus of course goliath diversified miners BHP Group (BHP) and RIO Tinto (RIO). The simple answer is not at this stage, any further tweaking looks & feels unnecessary, our position reflects our view, it’s time to sit back and see if we are correct.
MM remains bullish the industrial metals.
Bloomberg Base Metals Index Chart
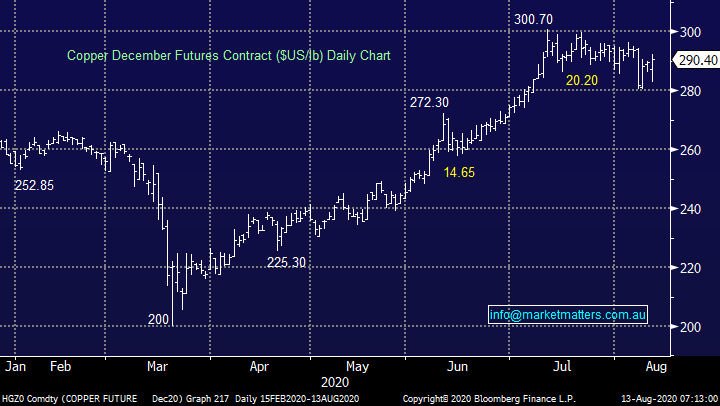
Coppers been consolidating for around a month now with Fridays ~4% drop not really registering on the chart, we are actually bullish short-term liking copper for a break above $US300/lb in the coming weeks.
MM sees an additional 5% upside in copper short-term.
Copper ($US/lb) Chart
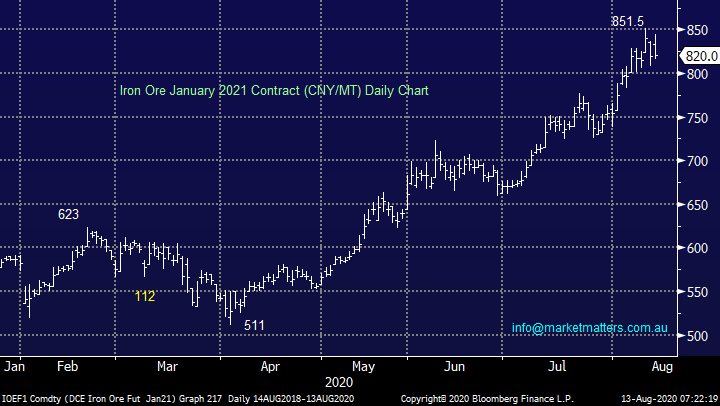
4 Iron Ore.
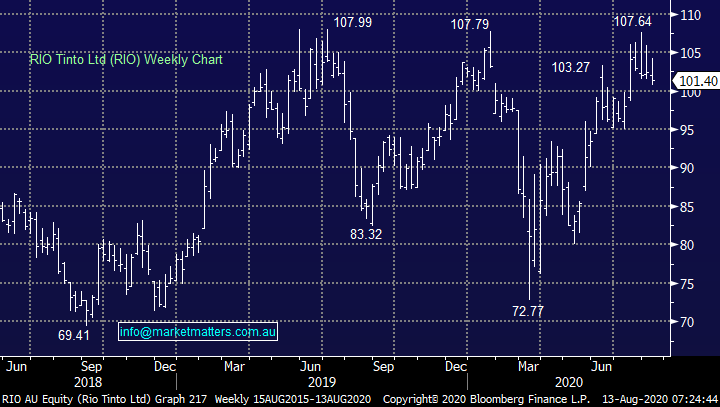
Bulk commodity Iron Ore has been a standout in 2020 rallying over 60% from its April low. Not surprising the related stocks have enjoyed a great year with pure play Fortescue (FMG) the standout up 130% since March while the more diversified RIO Tinto (RIO) has gained just under 50% and BHP Group (BHP) almost 70%. At this stage we feel these are the stocks which have potentially got ahead of themselves on the optimism front and while we remain bullish they are vulnerable to underperformance at least short-term.
Iron Ore(CNY/MT) Chart
RIO Tinto (RIO) Chart
Conclusion
MM likes our portfolio mix across the commodities front but we considering trimming (not closing) either our BHP or RIO position and increasing our BPT holding, a slight move up the risk curve with regard to commodities.
Watch for alerts.
Have a great day!
James & the Market Matters Team
Disclosure
Market Matters may hold stocks mentioned in this report. Subscribers can view a full list of holdings on the website by clicking here. Positions are updated each Friday, or after the session when positions are traded.
Disclaimer
All figures contained from sources believed to be accurate. All prices stated are based on the last close price at the time of writing unless otherwise noted. Market Matters does not make any representation of warranty as to the accuracy of the figures or prices and disclaims any liability resulting from any inaccuracy.
Reports and other documents published on this website and email (‘Reports’) are authored by Market Matters and the reports represent the views of Market Matters. The Market Matters Report is based on technical analysis of companies, commodities and the market in general. Technical analysis focuses on interpreting charts and other data to determine what the market sentiment about a particular financial product is, or will be. Unlike fundamental analysis, it does not involve a detailed review of the company’s financial position.
The Reports contain general, as opposed to personal, advice. That means they are prepared for multiple distributions without consideration of your investment objectives, financial situation and needs (‘Personal Circumstances’). Accordingly, any advice given is not a recommendation that a particular course of action is suitable for you and the advice is therefore not to be acted on as investment advice. You must assess whether or not any advice is appropriate for your Personal Circumstances before making any investment decisions. You can either make this assessment yourself, or if you require a personal recommendation, you can seek the assistance of a financial advisor. Market Matters or its author(s) accepts no responsibility for any losses or damages resulting from decisions made from or because of information within this publication. Investing and trading in financial products are always risky, so you should do your own research before buying or selling a financial product.
The Reports are published by Market Matters in good faith based on the facts known to it at the time of their preparation and do not purport to contain all relevant information with respect to the financial products to which they relate. Although the Reports are based on information obtained from sources believed to be reliable, Market Matters does not make any representation or warranty that they are accurate, complete or up to date and Market Matters accepts no obligation to correct or update the information or opinions in the Reports. Market Matters may publish content sourced from external content providers.
If you rely on a Report, you do so at your own risk. Past performance is not an indication of future performance. Any projections are estimates only and may not be realised in the future. Except to the extent that liability under any law cannot be excluded, Market Matters disclaims liability for all loss or damage arising as a result of any opinion, advice, recommendation, representation or information expressly or impliedly published in or in relation to this report notwithstanding any error or omission including negligence.