Stepping back & reviewing our “underwater positions” (TLS, TWE, EHL, BPT, CGC)
LOCAL REPORTING CALENDAR: CLICK HERE **Please note, data sourced from Bloomberg, not all ASX companies are on this list and dates can vary**
Today we have results from BBN, PPS, ILU, NCM, NAB (trading update). I cover these below.

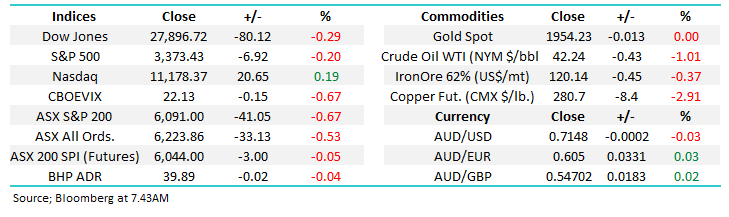
The ASX200 endured a tough Thursday falling 41-points after failing to hold onto early gains, we witnessed the rare occurrence of exactly an equal number of winners & losers but when the banks and CSL are on the wrong side of the ledger it creates a meaningful headwind for the index. Earlier in the week I was confident that we would see the market break above 6200 but in the blink of an eye we’re drifting back towards 6000, its getting boring at the index level although a lot happening in individual stocks – and more to come next week!
Reporting season has pleasingly taken centre stage as it usually does this time of year and as expected the volatility on the stock level is rising almost daily, yesterday in the ASX200 we saw 8 stocks rally by 5% or more while 4 stocks fell by the same degree. Basically misses /disappointing forward guidance such as Telstra (TLS) yesterday are not being tolerated while most decent news is being embraced by a market that remains very nervous on many levels.
The other dampener which crossed the newswires yesterday morning was the unemployment rate coming in at 7.5% as opposed to the forecasted 7.8%, back to front I know but better data means less stimulus and that’s the fuel driving the equities train at present. However the market was already down around 30-points at 11.30am when the data was released so it certainly wasn’t the driving factor behind the days decline, to me stocks simply felt tired from the get go.
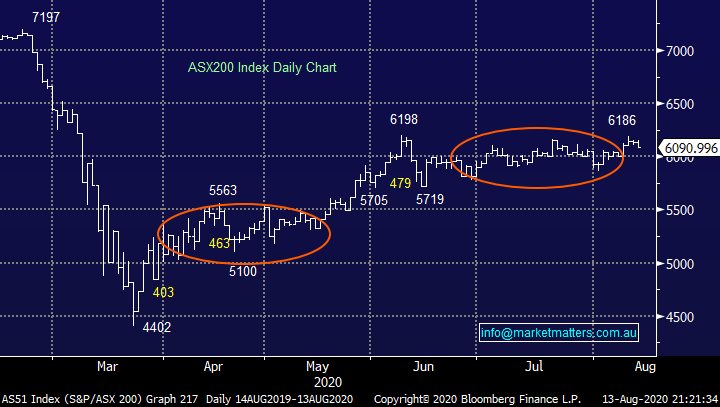
MM remains bullish the ASX200 medium-term.
ASX200 Index Chart
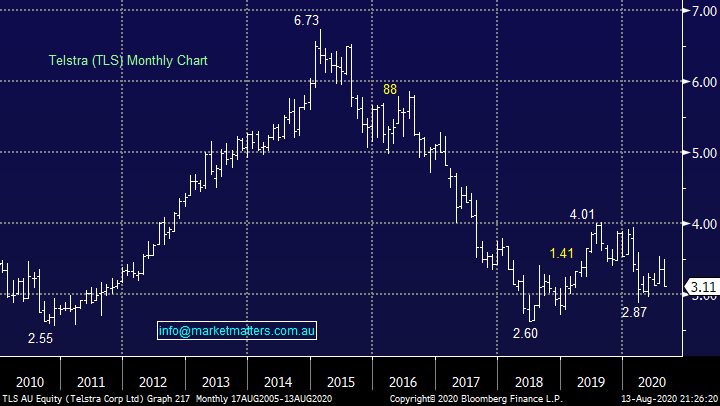
Telstra (TLS) was clobbered over 8% following yesterday’s result, overall we felt it was a “mixed result” although the market clearly didn’t like it. The positive was the dividend being maintained with a number of analysts forecasting a cut - at least it suggests TLS have more clarity around the future of their business moving forward. Earnings for FY20 were a touch soft, the market was looking for profit above $1.91bn and they came in at $1.84bn, but FY21 guidance was about 8% below expectations and the market appears to be paying far more attention to the future earnings than the present.
Digital transformation is a thematic we believe will continue to grow as companies move to support a more remote workforce, TLS should be well positioned to take advantage of this evolution which COVID-19 has clearly accelerated.
MM is neutral Telstra (TLS) but its back on our radar.
Telstra (TLS) Chart
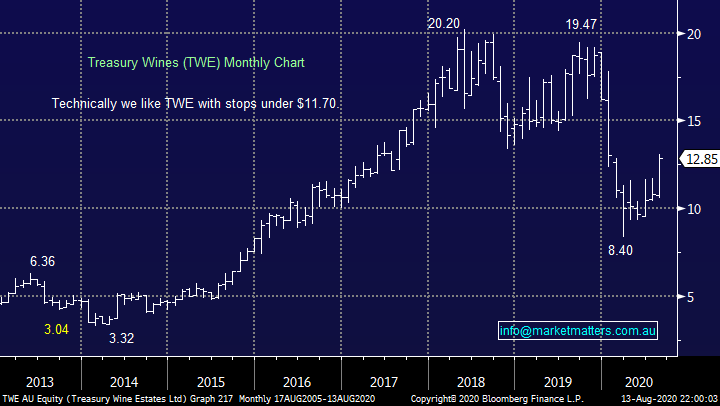
Treasury Wine Estates (TWE) soared over +12% following a smack in-line result, down 25% on last year with all geographies posting a fall in earnings although the Americas hurt the most. While the US trade deteriorated in the first half, COVID-19 was clearly the main driver of declining profit which bodes well for the rebound. The company continues to remain cautious which is unsurprising, however TWE did note that signs of recovery had started to show in sales. The key to any improvement will be a return to growth in the US as Asia already looks to have put the worst conditions behind it.
A great example of a little forward optimism from a stock near its lows leading to a strong bounce, as we said earlier the market is very nervous around many areas hence ok is good enough for the ‘cheaper’ end of town i.e. investors are bracing for bad news so relief rallies like TWE’s are not surprising. At this stage we are not considering buying TWE into the bounce but the risk / reward is ok while the stock holds above its highs of the last 5-weeks i.e. operate stops below $11.70.
MM likes TWE with stops below $11.70.
Treasury Wines (TWE) Chart
Overseas Indices & markets
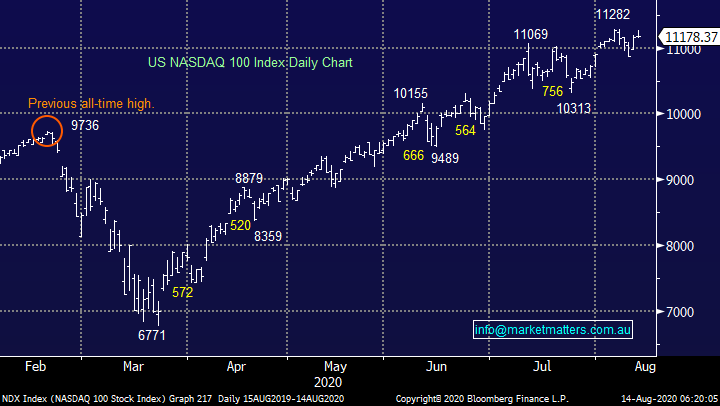
US stocks had a choppy night with the tech-based NASDAQ rallying but Dow & S&P500 fell slightly while the $US drifted lower, all in all a nothing session. The NASDAQ is within striking distance of another all-time high and while the upside momentum is clearly waning I remain very conscious of the weight of money hoping to buy at lower levels, arguably the path of “most pain” from here is a few weeks sideways consolidation before a resumption of the impressive uptrend.
MM remains bullish US stocks medium-term.
US NASDAQ Index Chart
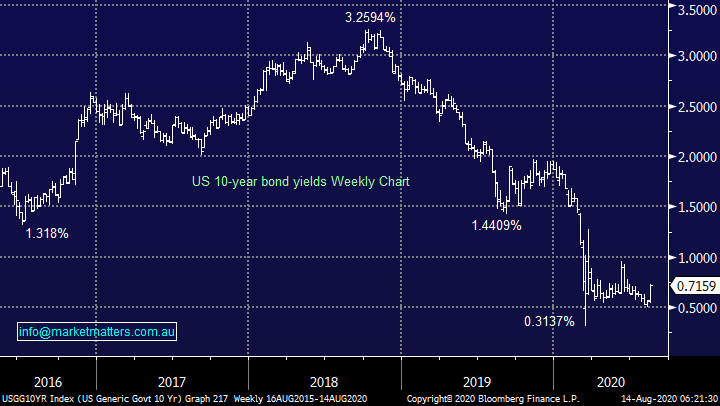
Overnight we saw US bond yields continue to rally implying professional money is moving away from the safety of bonds, flagging an economic recovery in the process. A quick glance at the chart below shows this weeks bounce is only a blip on the radar but at MM we are looking for yields to ultimately go much higher on a relative basis and this should create the tailwind to support our thesis that the Banking Sector is positioned well for the next 12-18 months.
MM remains bullish US Bond Yields.
US 10-year Bond yields Chart.
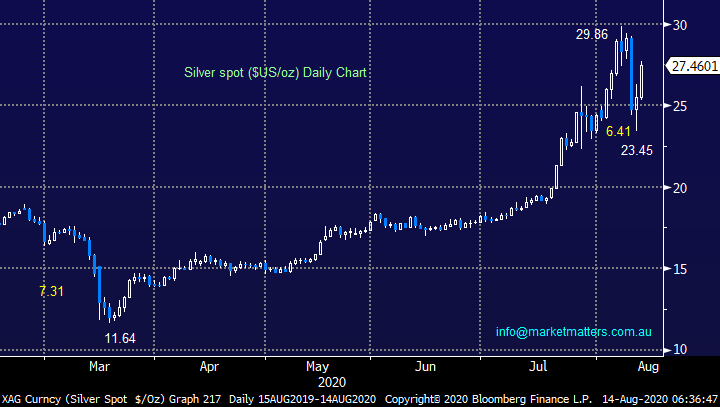
Precious metals have recovered strongly from the aggressive washout earlier in the week with silver already bouncing a solid +17%, another 10% higher and we may consider taking profit in our ETF position and let the dust settle, but we do want to be long over the next 1-2 years so any selling is only likely to be into strength.
MM remains bullish silver initially targeting a break of $US30/oz.
Silver spot ($US/oz) Chart
Reviewing our “underwater positions” in the MM Growth Portfolio.
We have a saying at MM which I believe is the backbone of successful investing although not necessarily always the easiest to implement – “look after the losers and the winners will look after themselves”. This undoubtedly overlaps with an old market adage which the vast majority of successful investors swear by – “run your profits and cut your losses”. A simple way to explain the logic is through basic 101 mathematics, if a stock halves your next position has to double just to breakeven, no easy feat as we all know.
Many investors including ourselves at times get caught up in avoiding taking losses but we should be adopting an unemotional cold attitude to our stock holdings, constantly evaluating the merits or otherwise of holding onto positions, whether they be up or down. It’s all about the future not the past, and searching for performance is what we’re all about at MM. The reality of investing is that stocks go both down and up, just because we buy them and want them to rise, doesn’t mean it becomes reality - nor for that matter does a stock falling necessarily mean our thesis is broken. Constant evaluation is very important.
Invest in the now and future, not the rear view mirror.
Today I have simply revisited our 3 investments that are the most underwater in our Growth Portfolio and even though some of the damage can be attributed to COVID-19 its no excuse to be caught like the proverbial ostrich with our head in the sand. One thing we pride ourselves on at MM as being a 100% transparent in what we’re doing and why, after all we’re writing about our own portfolios.
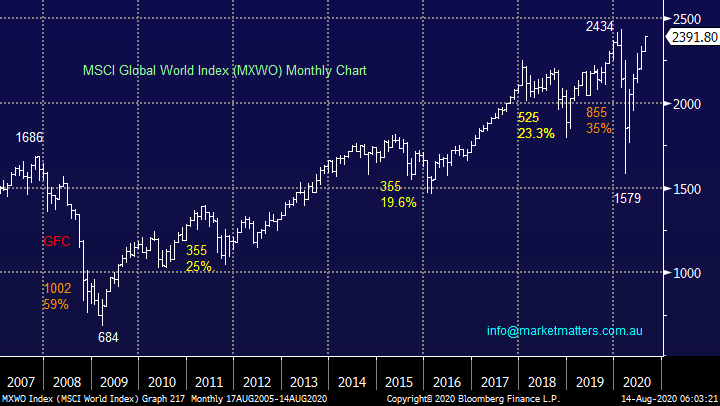
Next week I will look the 4-6th worst performers and then we will switch our attention to other portfolios. One point to bear in mind is if MM is correct and equities continue to rally over the next 12-18 months we feel a number of the “dogs” of 2020 will recover as economic optimism improves hence selling now might not be as prudent as in a “normal market” if such a thing exists!
MM remains bullish global equities medium-term.
MSCI Global World Index Chart
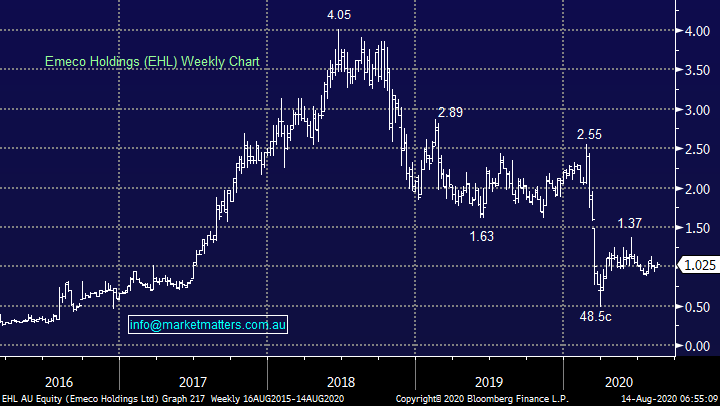
1 Emeco Holdings (EHL) $1.02.
Mining heavy machinery rental business EHL reported full year earnings on the 27th July and the numbers were good with revenue up more than 16% to ~$540m while generating free cash flow of over $70m, very healthy in our opinion as it works to pay down debt. The healthy mining sector is great news for EHL and we believe this backdrop will be in play for at least the majority of 2021, hence we can see exciting risk / reward upside for the stock which remains down more than 50% since COVID-19 hit markets.
MM is bullish EHL at current levels.
Emeco Holdings (EHL) Chart
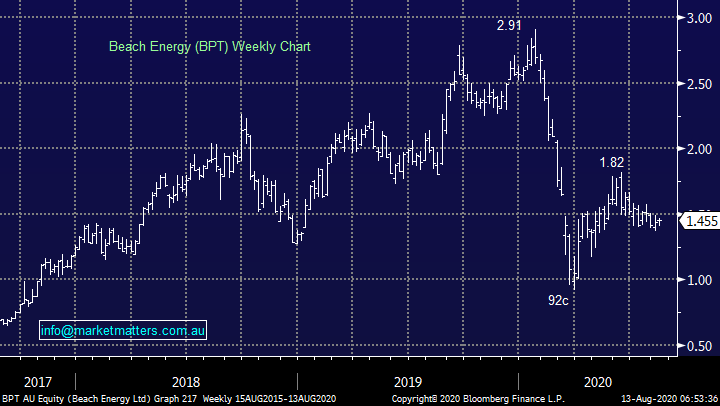
2 Beach Petroleum (BPT) $1.45
MM is bullish the Energy Sector as we outlined yesterday with our preferred exposure actually being Beach Petroleum (BPT) due to its deep valuation on offer and strong balance sheet i.e. the business can fund growth and maintain operations with crude oil at current levels. MM also owns Woodside (WPL) in our Growth Portfolio, it’s a relatively conservative option but enjoys the best balance sheet. However, MM is considering increasing our BPT position, not closing it. Interestingly it has a similar look and feel to EHL i.e. the recovery story.
MM remains bullish BPT medium-term.
Beach Petroleum (BPT) Chart
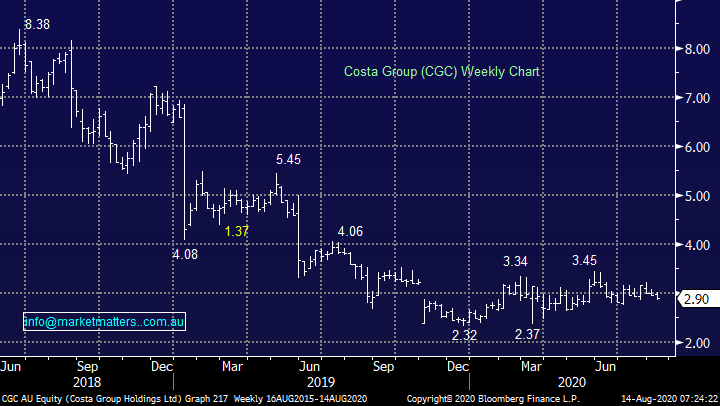
3 Costa Group (CGC) $2.90.
Fruit and vegetable grower CGC is theoretically in a good space if our reflation trade plays out and the cost of food & produce rises – at the moment every time I go to the supermarket I feel like blueberries, my kids favourite, are on sale! Issues such as drought and specific crop disease has been a bane for the grower but while mother nature is always full of surprises, it tends to be cyclical implying the company is overdue a good run.
CGC is Australia’s largest agricultural business and its had the kitchen sink thrown at it from bushfires, drought, disease and now COVID-19 but food prices are starting to increase which is a huge tailwind for CGC whose costs remain basically unchanged. Its been a frustrating journey but we feel CGC deserves some more rope because its recovery could be dramatic if our reflation view plays out.
MM is leaning towards a bullish to neutral stance on CGC.
Costa Group (CGC) Chart
Conclusion
MM continues to like EHL and BPT and actually wouldn’t be adverse to averaging either / both, Costa Group (CGC) is a little more concerning and on close watch but it does fit our macro reflation outlook.
Have a great day!
James & the Market Matters Team
Disclosure
Market Matters may hold stocks mentioned in this report. Subscribers can view a full list of holdings on the website by clicking here. Positions are updated each Friday, or after the session when positions are traded.
Disclaimer
All figures contained from sources believed to be accurate. All prices stated are based on the last close price at the time of writing unless otherwise noted. Market Matters does not make any representation of warranty as to the accuracy of the figures or prices and disclaims any liability resulting from any inaccuracy.
Reports and other documents published on this website and email (‘Reports’) are authored by Market Matters and the reports represent the views of Market Matters. The Market Matters Report is based on technical analysis of companies, commodities and the market in general. Technical analysis focuses on interpreting charts and other data to determine what the market sentiment about a particular financial product is, or will be. Unlike fundamental analysis, it does not involve a detailed review of the company’s financial position.
The Reports contain general, as opposed to personal, advice. That means they are prepared for multiple distributions without consideration of your investment objectives, financial situation and needs (‘Personal Circumstances’). Accordingly, any advice given is not a recommendation that a particular course of action is suitable for you and the advice is therefore not to be acted on as investment advice. You must assess whether or not any advice is appropriate for your Personal Circumstances before making any investment decisions. You can either make this assessment yourself, or if you require a personal recommendation, you can seek the assistance of a financial advisor. Market Matters or its author(s) accepts no responsibility for any losses or damages resulting from decisions made from or because of information within this publication. Investing and trading in financial products are always risky, so you should do your own research before buying or selling a financial product.
The Reports are published by Market Matters in good faith based on the facts known to it at the time of their preparation and do not purport to contain all relevant information with respect to the financial products to which they relate. Although the Reports are based on information obtained from sources believed to be reliable, Market Matters does not make any representation or warranty that they are accurate, complete or up to date and Market Matters accepts no obligation to correct or update the information or opinions in the Reports. Market Matters may publish content sourced from external content providers.
If you rely on a Report, you do so at your own risk. Past performance is not an indication of future performance. Any projections are estimates only and may not be realised in the future. Except to the extent that liability under any law cannot be excluded, Market Matters disclaims liability for all loss or damage arising as a result of any opinion, advice, recommendation, representation or information expressly or impliedly published in or in relation to this report notwithstanding any error or omission including negligence.