Simplifying the talk around options causing the latest tech rout (OZL, 9984 JP)
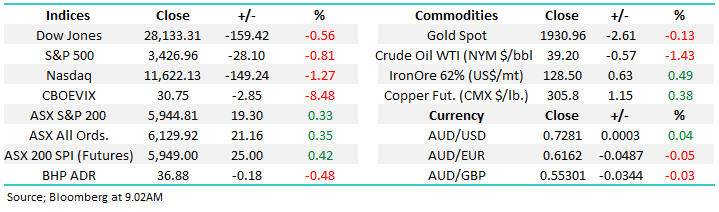
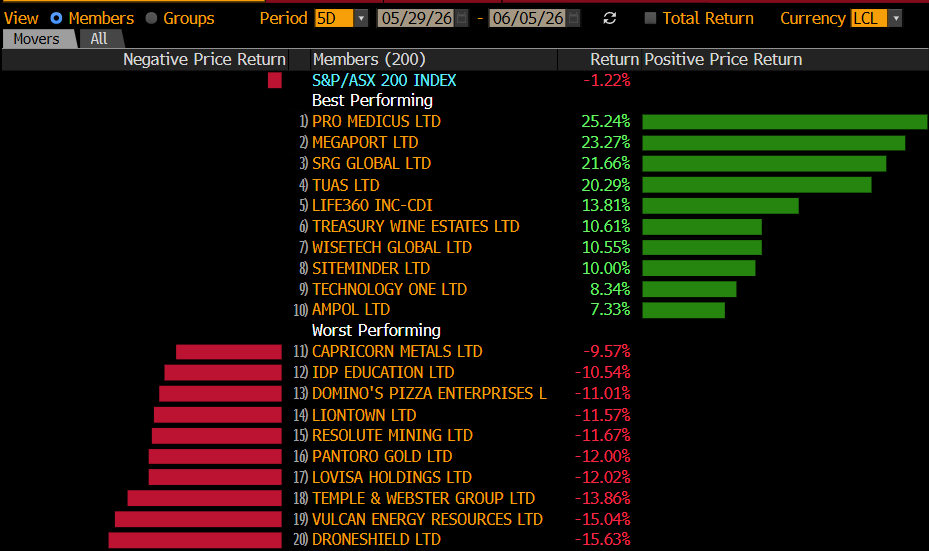
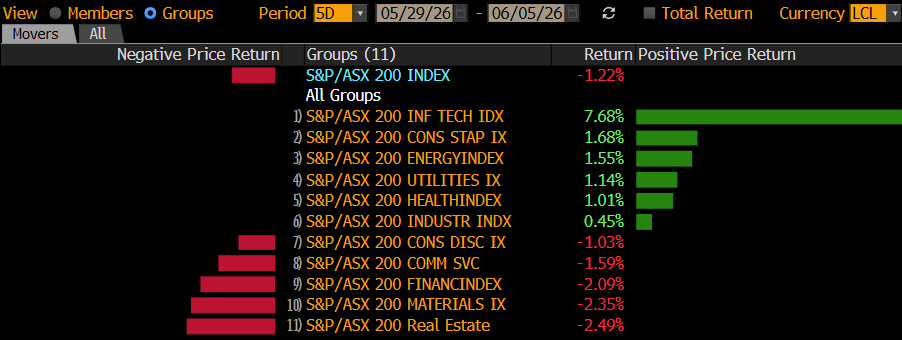
The ASX200 continues to rotate on both the index level and under the hood, Monday saw solid buying in the banks and resources and although less than 45% of the market closed positive on the day the likes of BHP & CBA rallying was sufficient for us to buck the recent bearish trend. The US was closed overnight for Labor Day but their S&P500 futures were still flying around during our daytime however the local market was firm throughout most of its session as investors like ourselves saw value in certain pockets of the market.
Yesterday afternoon we tweaked our Growth & Income Portfolios in line with our thoughts in the MM Weekend Report i.e. “plan your trade and trade your plan”. When I look at our flagship portfolio this morning its very close to where I want it, at least for now, in this market things continue to evolve in the blink of an eye. We keep flagging it but my “best guess” for MM’s next move will be around the gold sector however at this stage it’s a coin toss in which direction i.e. we remain buyers of weakness and sellers of strength.
In Mondays “Q & A” report we touched on the previously red hot lithium sector and it did remind me of both the gold and the BNPL spaces of late, not in terms of fundamentals but more with regard to investor interest and the building undertones of FOMO (Fear of missing out). History tells us that these run away trains tend to run harder and further than many expect but when they do correct it’s also harder / sharper than the bulls thought possible hence even while we have exposure to both of these recent pockets of outperformance it’s a manageable position size which importantly lets us sleep at night.
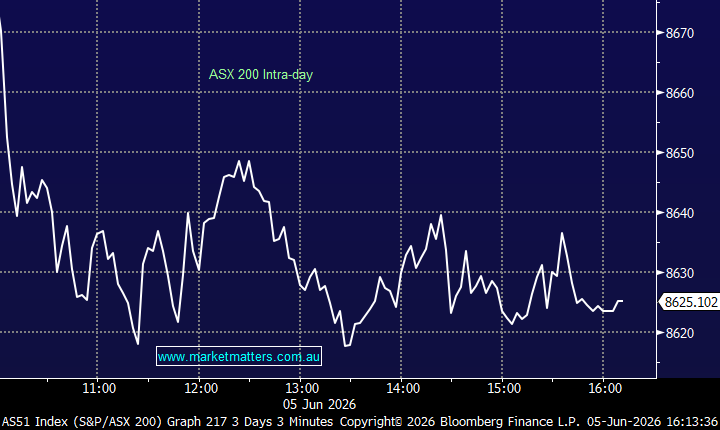
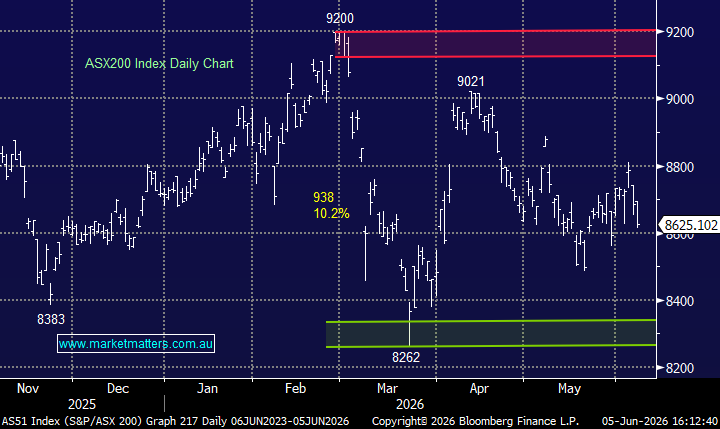
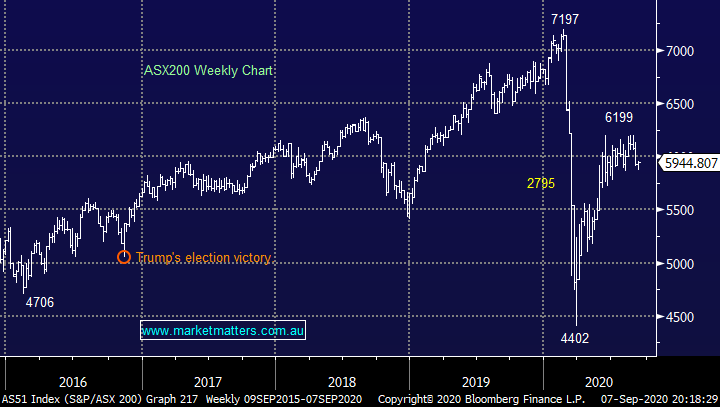
MM remains bullish the ASX200 medium term.
ASX200 Index Chart
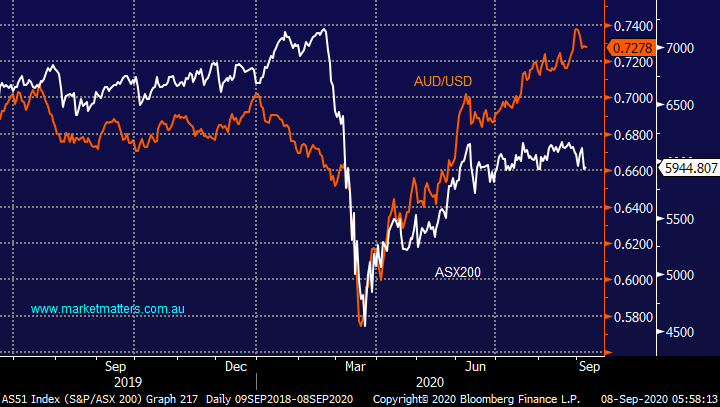
The Australian Dollar $A continues to trade around its 2-year high enjoying the combination of firm commodity prices and a drifting $US. Over recent years the correlation between the $A and the ASX has been pretty good with the currency tending to be a slight leader but at present its running strongly on its lonesome. An appreciating local currency has been a core view at MM through 2020 and this hasn’t wavered which if correct strongly suggests local stocks will ultimately play some aggressive catch-up, perhaps a stronger than usual Santa Claus rally is looming, a post US election relief rally is definitely comprehendible.
MM is bullish both of the $A and ASX200 medium-term.
Australian Dollar $A v ASX200 Chart
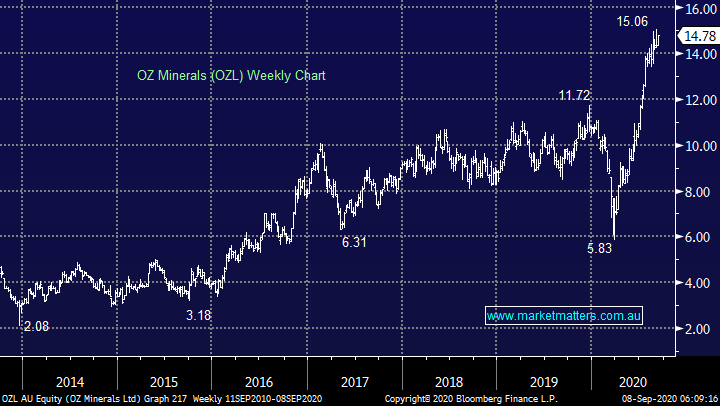
Some subscribers might be a little confused as to why we reduced our OZ Minerals (OZL) position yesterday when we remain bullish resources and the reflation trade. Our reasoning was 2-fold:
1 – We believe that OZL has become “rich” from a valuation perspective after its ~150% rally and a period of consolidation is our preferred scenario for the weeks ahead. MM is happy to stay long OZL in-line with our reflation outlook but feathering back our exposure made sense.
2 – Conversely after its 20% pullback we felt nickel producer Western Areas (WSA) represented good value and we were happy to increase our position size from 3% to 4%, simply a slight tweak within our resources holdings in the MM Growth Portfolio.
MM remains bullish OZL.
OZ Minerals (OZL) Chart
Overseas Indices & markets
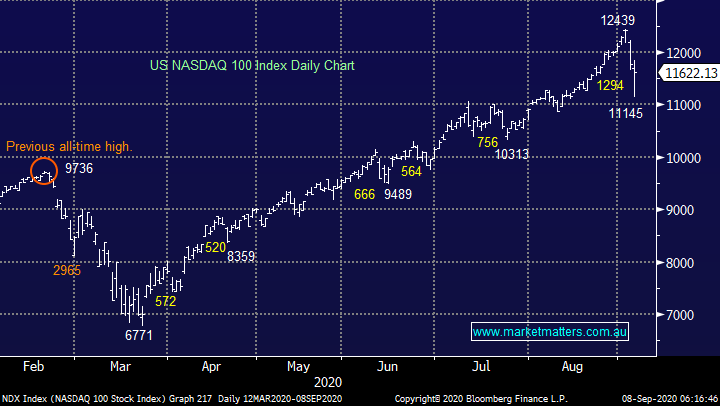
Overnight US stocks were closed for Labor Day, but their futures continued to trade in a very volatile fashion with the tech based NASDAQ finally closing down -0.4% after chopping around in a relatively large 2% range.
MM remains bullish US stocks medium-term.
US NASDAQ Index Chart
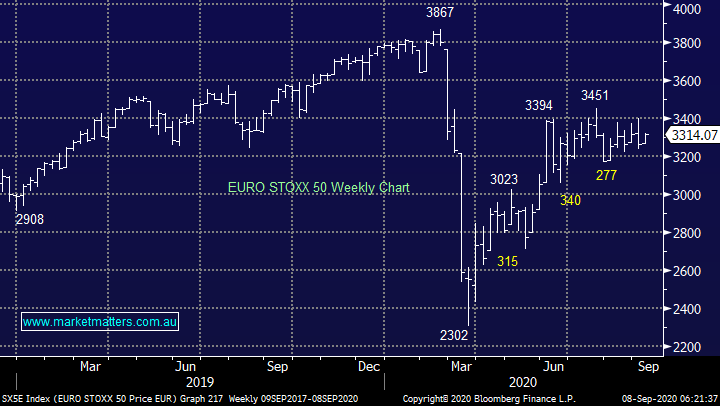
European indices enjoyed a strong session overnight with UK FTSE and German DAX both rallying over 2%, gains which bodes well for local stocks this morning who are far more correlated to the region as opposed to the US. The rhetoric being banded around was that European stocks would be relatively resilient compared to the tech triggered falls in the US. BREXIT resolution wobbles were almost embraced or ignored by the market as it now resides way back in the queue of importance for stocks.
MM is neutral European stocks short-term.
EURO STOXX Index Chart
As a few of you know, yesterday I left my phone at home which is not ideal, however you’ll be pleased to see the checklist my eldest daughter has now positioned next to my bike in the garage - I’ll have no excuse in future!
Did options cause the NASDAQ to plunge 10% in recent days?
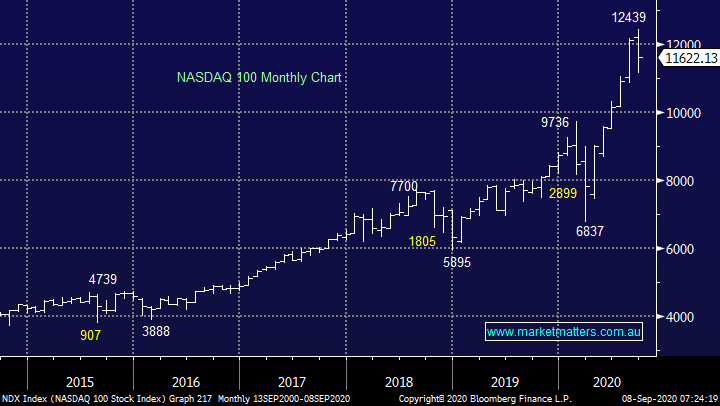
The financial press has recently jumped on the band wagon of option trading causing the latest rout in the tech stocks, today we’ve tried to clear the often muddy waters around this subject so we can all focus our efforts on more important issues with regard to investing. Firstly, it’s important to remember that journalists write stories to sell newspapers or in today’s new world to get clicks / impressions. Indeed the press have helped fuel the “wall of worry” for equities over the last 6-months as tech shares have basically doubled, they love to write about an imminent crash due to valuations or whatever reason sounds good on the day but they rarely mention the mountains of cash being made by the likes of Apple (AAPL US), Microsoft (MSFT US) and Co.
The NASDAQ may be due a rest, but MM remains bullish.
NASDAQ Index Chart
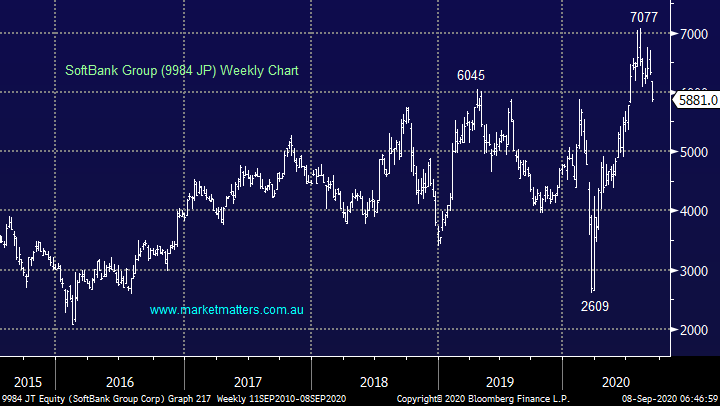
Yesterday SoftBank tumbled over 7% in Tokyo after reports the high-flying Japanese conglomerate had made huge tech bets via equity derivatives / options. The company’s asset management business has the mandate for option trading but there has been no comments or details of such trading from SoftBank, it’s all speculation that must now be flying around via mobiles and the internet as opposed to in the bars and restaurants pre-COVID. Japanese billionaire Masayoshi Son is the driving force behind the company and he has a reputation as a speculator including his recent purchase of 2.5 trillion of his own stock – it’s always nice to see owners buy their own shares as opposed to looking for opportunities to sell.
At this stage there is zero foundation behind the rumours and the chart below simply looks like a pullback after the stocks massive +170% appreciation. The UK’s Financial Times claimed the group has placed a $4bn “bet” on tech stocks with $30bn leveraged exposure and its currently enjoying paper profits of $4bn, sounds like a good bet at this stage.
However, our concern is the level of understanding of what’s involved if these rumours are in part true, their positions might be long, short, a volatility play etc. The point being there are numerous ways to skin the cat with options, all great when you get it right but not necessarily going to move the market when your wrong, but it can.
MM likes Softbank at current levels.
SoftBank Group (9984 JP) Chart
There are 3 major ways an investor can position themselves with options, below is a very simplified explanation of each. Please note, this is for educational purposes only:
1 Buy or sell a Call option: when the market rises all things being equal so will the value of a call option. When investors buy a call option it will create some buying in the underlying asset as the seller (granter) will hedge via the respective market e.g. if they sold a call in Apple they will buy some Apple shares to hedge.
A - If an investor had bought the call option it’s great when the market rises but you lose when it falls, if / when they sell out it will cause some selling in the underlying market, the higher the market the greater the selling and vice versa.
B - If an investor had sold the call option it’s great when the market falls but you lose when it rallies, if / when they cover it will cause some buying in the underlying market, the higher the stock rallies the greater the calls value and the more hedging will be required in the underlying shares.
2 Buy or sell Put options: a complete mirror of above, the buyer of a Put is positioning themselves for a fall in the market.
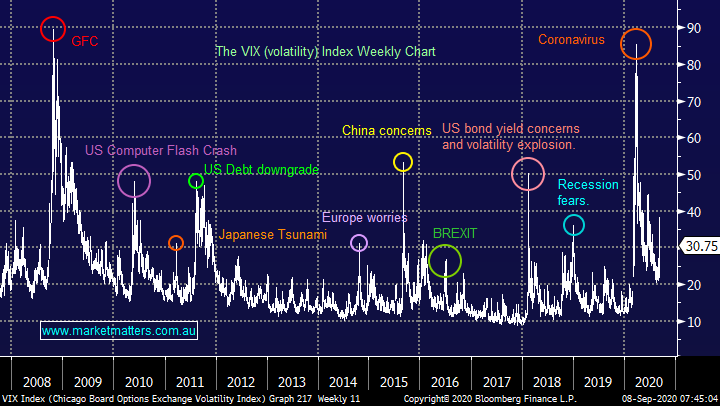
3 Buy or sell Volatility options : this is where things can really get hairy, if investors have placed large bets that a market will remain quiet and then it surprises in either direction the hedging required by the incorrectly positioned investor can be exponential in nature as can be seen by the spikes below in the VIX when markets breakout, usually because of unexpected news. However, I cannot imagine with the NASDAQ rallying so strongly that these positions would have been particularly prevalent.
NB Market makers are positioning themselves around volatility, not the direction of a stock or market, they sell options when their models say investors are paying too much for a respective bet and vice versa.
Volatility Index (VIX) Chart
MM has mentioned a few times over recent weeks how retail investors have started getting more involved in leveraged trading with the tech space understandably garnering their most attention – unfortunately retail investors are often used as a contrarian indicator because they have a history of “going long at the top”. Retail punters have just spent $40bn on call options in just one month, a huge bullish punt by a group that often get it wrong, at least short-term. The chart below from Bloomberg illustrates perfectly the recent surge in bullish bets.
However, while these bets may well lose and they aren’t looking too clever today they won’t create an avalanche of selling, they just pushed the quality tech names a bit too far too fast. Once these bets have been banked by the professional market players there’s no reason to think the bull market will not recommence. The average position taken by these aggressive punters is only 2-weeks, not long term investing hence we get a logical timeframe for the current retracement. The sellers of the calls had to buy stock to hedge hence as the market endures a pullback these positions will exacerbate the selling but not for more than 1-2 weeks.
The path of most pain for retail investors is down for 2-weeks and then back up!
NB Institutions tend to take longer dated positions with less hedging required by market makers (the stock markets bookmaker).
Option positioning in 3 high flying tech stocks
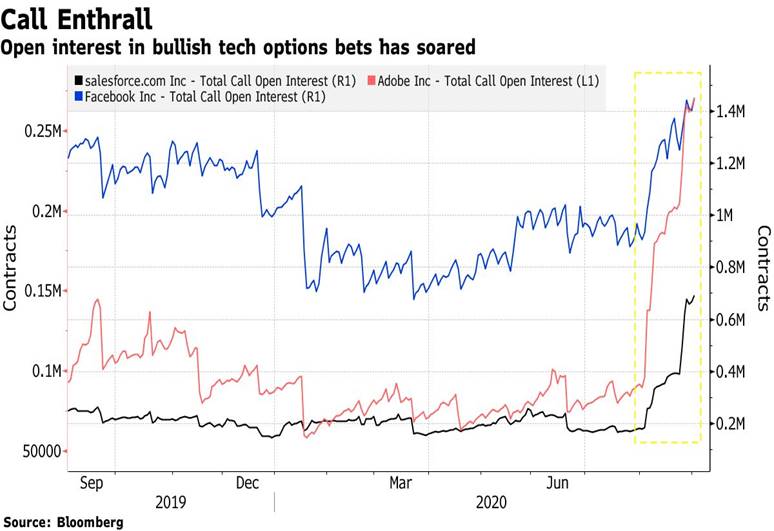
The Financial Times reported the SoftBank spent $4bn on options, only 10% of the retail positioning to put things into perspective, personally I’m sure the momentum traders are carrying a far larger position. Bull markets have corrections as they travel on their merry way, it’s one of the ways that its keeps traders / investors honest, stocks are not a printing press for the greedy.
Last week the CNN “Fear & Greed” indicator only sat at 59, a Greed print but nowhere near the Extreme Greed mark which traditionally sees market top out.
CNN “Fear & Greed” indicator Chart
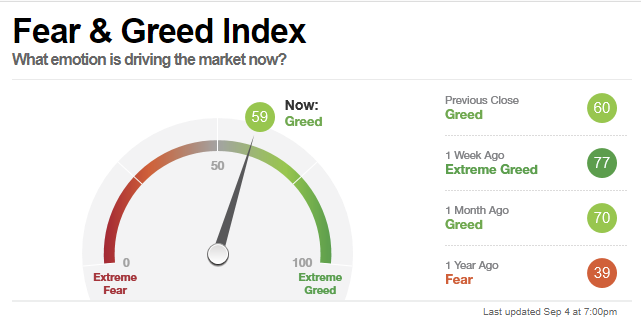
Source: CNBC
Conclusion
Options positioning is just another excellent gauge of when a market becomes too bullish or bearish and it can be used to optimise entry / exit timing but it’s no reason to determine what stocks an investor should buy.
Have a great day!
James & the Market Matters Team
Disclosure
Market Matters may hold stocks mentioned in this report. Subscribers can view a full list of holdings on the website by clicking here. Positions are updated each Friday, or after the session when positions are traded.
Disclaimer
All figures contained from sources believed to be accurate. All prices stated are based on the last close price at the time of writing unless otherwise noted. Market Matters does not make any representation of warranty as to the accuracy of the figures or prices and disclaims any liability resulting from any inaccuracy.
Reports and other documents published on this website and email (‘Reports’) are authored by Market Matters and the reports represent the views of Market Matters. The Market Matters Report is based on technical analysis of companies, commodities and the market in general. Technical analysis focuses on interpreting charts and other data to determine what the market sentiment about a particular financial product is, or will be. Unlike fundamental analysis, it does not involve a detailed review of the company’s financial position.
The Reports contain general, as opposed to personal, advice. That means they are prepared for multiple distributions without consideration of your investment objectives, financial situation and needs (‘Personal Circumstances’). Accordingly, any advice given is not a recommendation that a particular course of action is suitable for you and the advice is therefore not to be acted on as investment advice. You must assess whether or not any advice is appropriate for your Personal Circumstances before making any investment decisions. You can either make this assessment yourself, or if you require a personal recommendation, you can seek the assistance of a financial advisor. Market Matters or its author(s) accepts no responsibility for any losses or damages resulting from decisions made from or because of information within this publication. Investing and trading in financial products are always risky, so you should do your own research before buying or selling a financial product.
The Reports are published by Market Matters in good faith based on the facts known to it at the time of their preparation and do not purport to contain all relevant information with respect to the financial products to which they relate. Although the Reports are based on information obtained from sources believed to be reliable, Market Matters does not make any representation or warranty that they are accurate, complete or up to date and Market Matters accepts no obligation to correct or update the information or opinions in the Reports. Market Matters may publish content sourced from external content providers.
If you rely on a Report, you do so at your own risk. Past performance is not an indication of future performance. Any projections are estimates only and may not be realised in the future. Except to the extent that liability under any law cannot be excluded, Market Matters disclaims liability for all loss or damage arising as a result of any opinion, advice, recommendation, representation or information expressly or impliedly published in or in relation to this report notwithstanding any error or omission including negligence.