US Mid-Terms settled – markets rally (CBA, WOR)
WHAT MATTERED TODAY
A reasonably volatile session played out today, thanks largely to the news flow coming from the US mid-term elections with the local maket one of the first to digest the ebbs and flow from the ballet boxes. We now know the Democrats, as expected have taken the lower house while in the Senate, the Republicans have done better than expected and will retain power plus they’ll add seats to their majority. In simple terms, the market has rallied +28% since Trump took office and the Republicans have driven through economic reforms that have ultimately been market friendly. While today they have lost power in the lower house, the fact they have won and built on their majority in the Senate could be descibed as a win for Mr Trump.
All of that said, from an investment standpoint the stats paint a pretty bullish picture. Looking back to 1946 there have been 18 midterm elections, of those, 18 times the market has been higher in 12 months’ time irrespective of the combination between the houses and the President’s allegiance. In terms of average return in the year following mid-term elections, the average gain is 17%. Taken from the date of the midterm +12months yields an even better result or in other words, stocks perform twice as well in the year that a mid-term election happens relative to years without mid-terms (every 4 years).
There could be a number of explanations for this, however the most obvious and one I would hang my hat on is the removal of uncertainty. The market seems to feed on the uncertainty ahead of elections only to rally on the certainty after them no matter what the outcome. It probably explains why the Australian market has been a tough place in recent years driven by a revolving door of Prime Ministers and a swinging pendulum from moderate left to moderate right with no clear direction or strong leadership either way. Whatever you think of Trump, and there are many words that could describe him, he’s been decisive and gotten things done, something that hasn’t happened in Australia for some time.
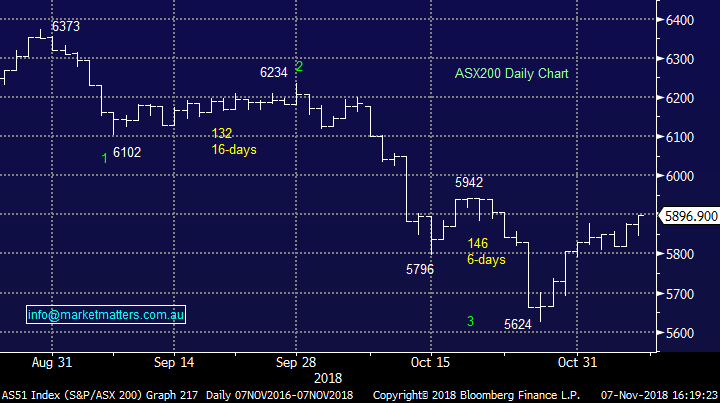
This outcome is a bullish one for markets, and while we’ve been mildly bullish the ASX from the lows, targeting 5900, that level has now been largely satisfied today. We will look to trim some stocks into further strength above 5925, however given the building momentum and the seasonal strength we typically see into Christmas, we’re likely to be patient.
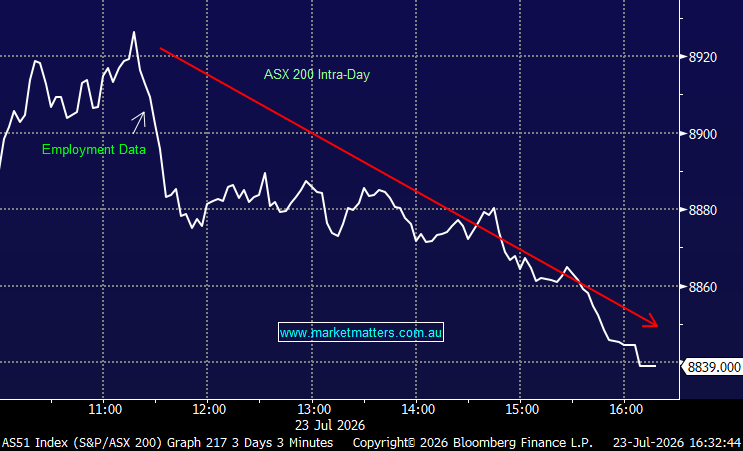
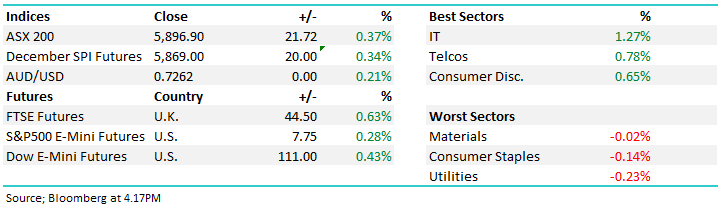
While the index only added +20pts today, it was up +52pts from the low adding to the +50pts we saw yesterday. Overall, ASX 200 closed up +21points or +0.37% at 5896. Dow Futures are currently up +94 points or +0.37%
ASX 200 Chart
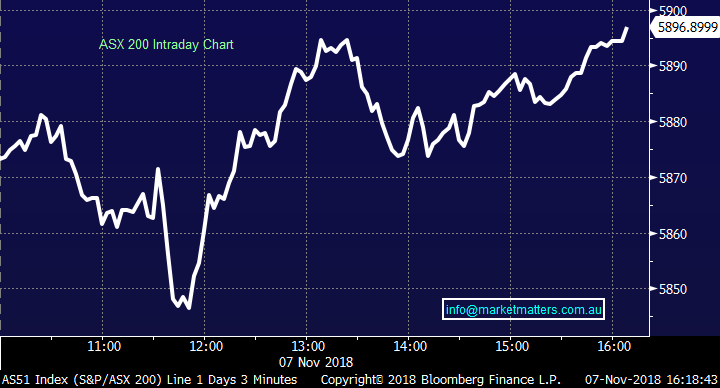
ASX 200 Chart
CATCHING OUR EYE
Broker Moves; not a lot out today from Aussie based Analysts given the cup yesterday!
RATINGS CHANGES:
· Windlab Downgraded to Hold at Moelis & Company; PT A$1.35
· Kiwi Property Upgraded to Outperform at Forsyth Barr; PT NZ$1.34
· Precinct Properties Cut to Underperform at Forsyth Barr
· Goodman Property Cut to Underperform at Forsyth Barr; PT NZ$1.38
· Argosy Upgraded to Outperform at Forsyth Barr; PT NZ$1.08
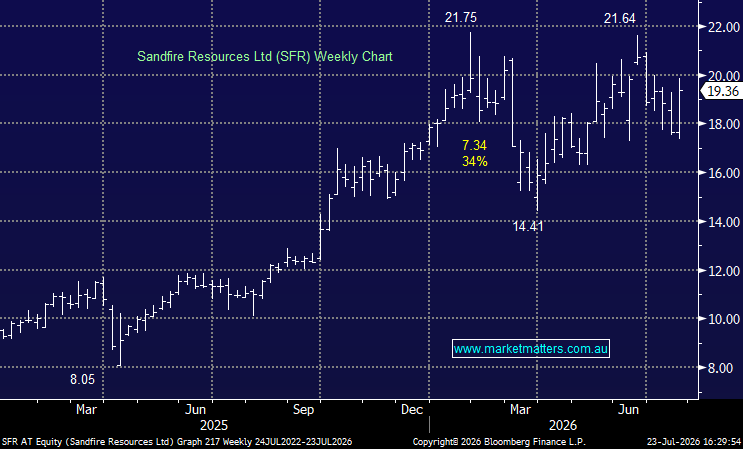
· Sandfire Downgraded to Sell at Morningstar
· Westpac ADRs Upgraded to Buy at Citi
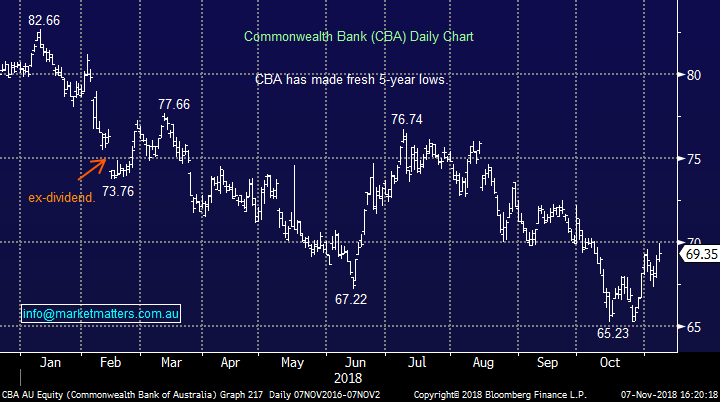
Commonwealth Bank (CBA) $69.35 / +0.58%; CBA released a Q1 trading update today which essentially portrayed a similar story to the other banks that delivered full year numbers in the last week or so. Cash profit came in at $2.5B, putting it on track for a $10.2B full year – slightly ahead of the market’s expected $9.93B. The lending quality still remains higher, as 90-day overdue home loans fell 4%, although impaired assets did rise slightly to $3.4B over the quarter.
Home loan growth managed an annualized figure of 3% and CBA are doing well to keep a lid on expenses, falling 1% from the 2H18 average. CET1 (capital) came in low at 10%, however their announced asset sales will increase this number to over 11%, well above the 10.5% unquestionably strong number.
All-in-all a result that is very similar to the WBC, NAB & ANZ full year numbers - showing little loan growth, reasonable capital positions, low bad & doubtful debts and some cost saving measures on the way which is enough to please investors at this stage. The result is a small beat and should see incremental upgrades to forecasts if trends continue.
Commonwealth Bank (CBA) Chart
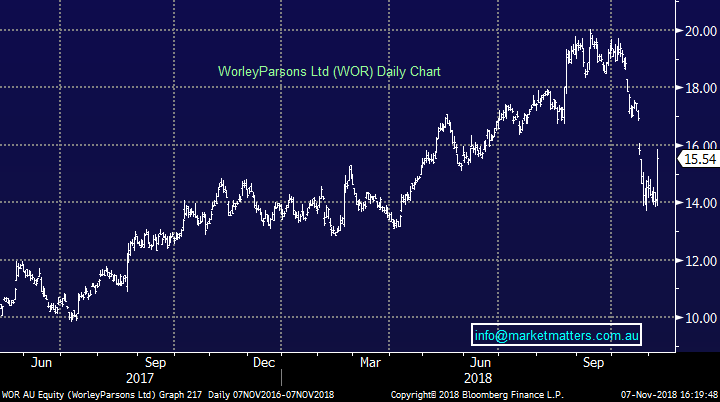
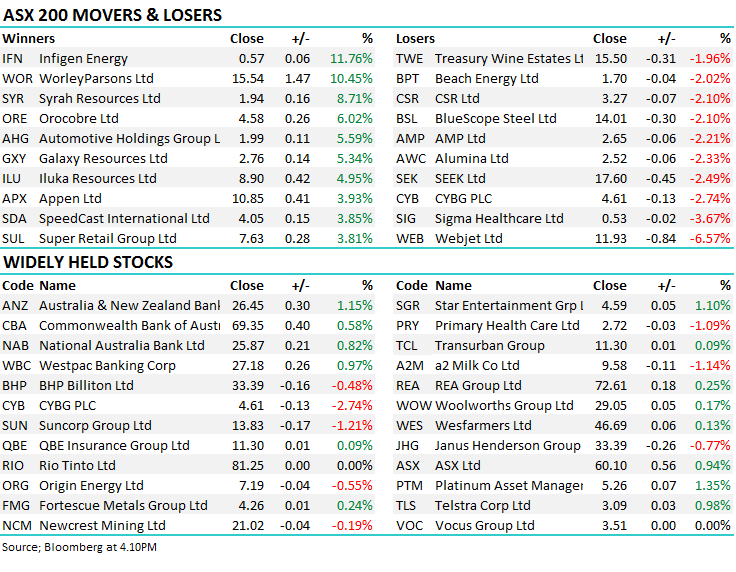
Worley Parsons (WOR) $15.54 / +10.45%; the engineering firm rallied strongly today after announcing that the largest shareholder Dar Group has taken up all of its available rights – totalling around $660M. Originally the company had committed to $185m, or just under 30% of the available rights, quoting availability of cash as an issue however a sizable margin loan from JP Morgan has allowed Dar Group to take up their full entitlement.
The stock has rightfully popped on the news – trading ~10% higher on the day as the market becomes more and more comfortable there won’t be a shortfall in the raise which is closing/has closed at 5pm today. Many had feared that the underwriters, Macquarie and UBS, would have to take a sizable portion of the raise considering the original indication that Dar would leave $485m on the table. The stock was also trading at a significant discount to the new shares being issued. As at yesterday’s close, the discount was over 10% - closing at $13.87 vs a $15.56 issue price. This gap has since closed substantially, with the stock closing today just 2c short of the new issue price.
The other consideration would have been from the ‘shorts’. When a short seller is short the stock they ultimately become short the rights. This is good if the share price trades below the right prices, but not good on the other side of the ledger. The news today would / should be a catalyst for shorts to cover with about 2.5% / 6m shares held short.
Worley Parsons (WOR) Chart
OUR CALLS
No changes to the portfolios today.
Have a great night
James / Harry & the Market Matters Team
Disclosure
Market Matters may hold stocks mentioned in this report. Subscribers can view a full list of holdings on the website by clicking here. Positions are updated each Friday, or after the session when positions are traded.
Disclaimer
All figures contained from sources believed to be accurate. Market Matters does not make any representation of warranty as to the accuracy of the figures and disclaims any liability resulting from any inaccuracy. Prices as at 07/11/2018
Reports and other documents published on this website and email (‘Reports’) are authored by Market Matters and the reports represent the views of Market Matters. The MarketMatters Report is based on technical analysis of companies, commodities and the market in general. Technical analysis focuses on interpreting charts and other data to determine what the market sentiment about a particular financial product is, or will be. Unlike fundamental analysis, it does not involve a detailed review of the company’s financial position.
The Reports contain general, as opposed to personal, advice. That means they are prepared for multiple distributions without consideration of your investment objectives, financial situation and needs (‘Personal Circumstances’). Accordingly, any advice given is not a recommendation that a particular course of action is suitable for you and the advice is therefore not to be acted on as investment advice. You must assess whether or not any advice is appropriate for your Personal Circumstances before making any investment decisions. You can either make this assessment yourself, or if you require a personal recommendation, you can seek the assistance of a financial advisor. Market Matters or its author(s) accepts no responsibility for any losses or damages resulting from decisions made from or because of information within this publication. Investing and trading in financial products are always risky, so you should do your own research before buying or selling a financial product.
The Reports are published by Market Matters in good faith based on the facts known to it at the time of their preparation and do not purport to contain all relevant information with respect to the financial products to which they relate. Although the Reports are based on information obtained from sources believed to be reliable, Market Matters does not make any representation or warranty that they are accurate, complete or up to date and Market Matters accepts no obligation to correct or update the information or opinions in the Reports. Market Matters may publish content sourced from external content providers.
If you rely on a Report, you do so at your own risk. Past performance is not an indication of future performance. Any projections are estimates only and may not be realised in the future. Except to the extent that liability under any law cannot be excluded, Market Matters disclaims liability for all loss or damage arising as a result of any opinion, advice, recommendation, representation or information expressly or impliedly published in or in relation to this report notwithstanding any error or omission including negligence.