Are coal stocks finally attracting some real buying? (CWY, BIN, WHC, NHC, YAL)
The ASX200 started the week off in an encouraging manner rallying 40-points to basically close at 5900, at this rate we’ll be back at 6000 before you know it! The strength was fairly broad based on Monday with the Resources Sector really catching my attention from energy plays coal & oil to copper, nickel, gold and iron ore, it was basically a good session all-round for the miners. The IT stocks remained on the wrong side of the ledger although a -0.7% fall implies some bargain hunting is slowly surfacing.
However, our market didn’t rally without some meaningful external assistance, the US S&P500 futures were trading up more than 1% when we closed for the day. Rhetoric from Goldman Sachs and Deutsche Bank suggesting the US tech sell-off was close to complete would have helped sentiment plus the Fed is expected to remain dovish this week, a huge tailwind until one day. Most of Asia embraced the US tone in a similar manner to ourselves with both the Japanese and Hong Kong markets both rallying ~0.6%.
NB Dovish means the Fed are likely to keep interest rates around zero while taking whatever other means are under its control to help stimulate economic growth post COVID-19.
Overnight the US market held onto the futures gains made during our time zone but the lack of follow through has the SPI futures pointing to a flat open. BHP is set to open up 40c while we have turned our attention this morning to the embattled Coal Sector following strong rallies by Whitehaven (WHC) and NewHope (NHC) yesterday.
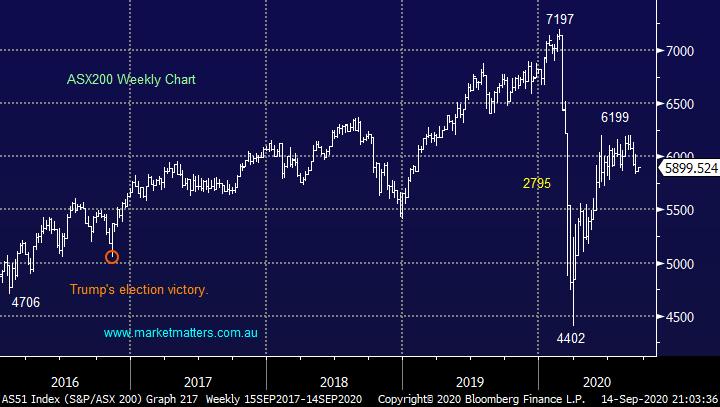
MM remains bullish the ASX200 medium-term.
ASX200 Index Chart
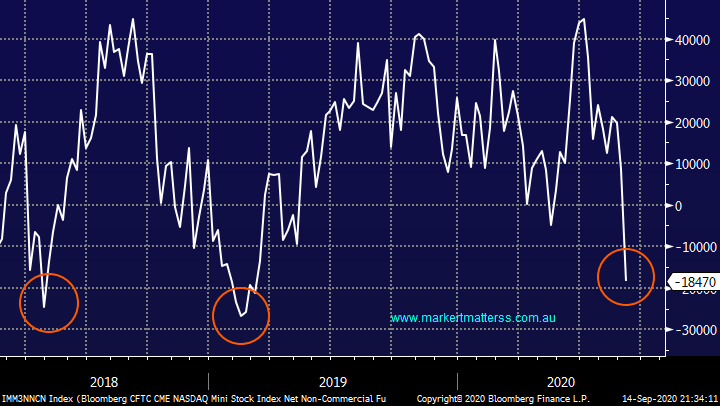
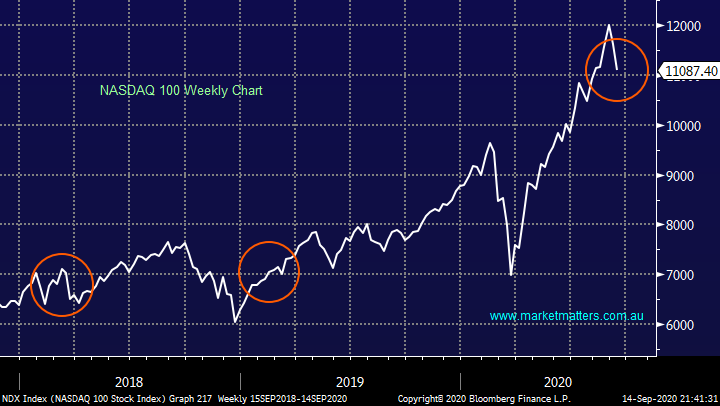
After around 18-months of bullish sentiment / positioning the speculators have turned bearish on the NASDAQ futures, the news is catching some exposure in the financial press, should we be concerned – the 2 charts below illustrate NASDAQ’s movements over the same period that we’re considering the investors flight from the likes of Apple & Amazon. The positioning report shown below registered 2 other occasions when investors lost faith in the tech sector, both times the market was higher 6-months later, not surprising in a rampant bull market but the conclusion is its nothing to worry about as a standalone indicator, if anything it’s a contrarian buy signal.
MM is bullish the NASDAQ around current levels.
Speculator positioning on the NASDAQ 100 Chart
NASDAQ 100 Chart
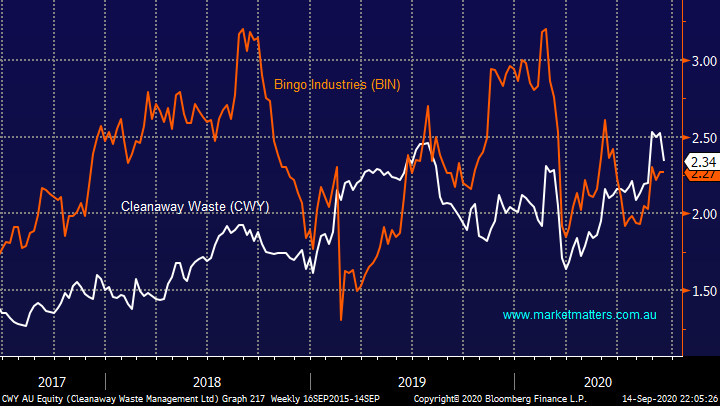
Yesterday we saw Cleanaway Waste (CWY) take the wooden spoon of performance falling over 7% after 2 announcements – the CFO is departing and the company responded to rumours around misconduct by the current CEO although it amounted to no more than mentoring and monitoring. Its important to note that since CEO Mr Bansai has been steering the ship the stock’s up around 3 fold hence any uncertainty around his position is not positive.
At times there have been solid opportunities to switch between Bingo (BIN) and CWY but at this stage we don’t feel this latest move has vaguely made CWY cheap, we’re going to stay put with BIN until further notice.
MM is comfortable holding BIN.
Cleanaway Waste (CWY) v Bingo Industries (BIN) Chart
Overseas Indices & markets
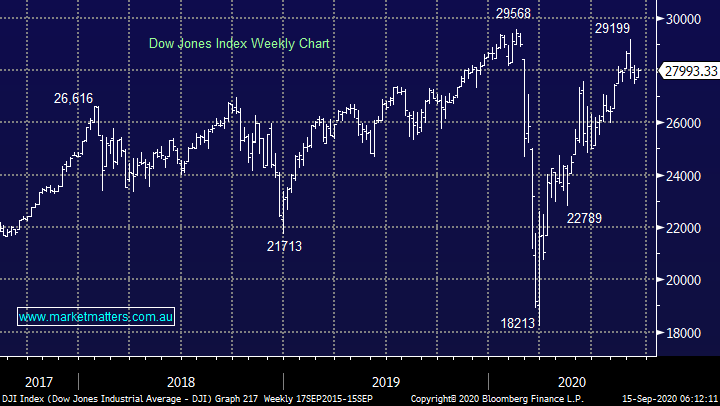
Overnight US stocks bounced back led by the tech sector but encouragingly every sector closed in positive territory. The commonly quoted Dow rallied over 300-points to finish only 5.3% below its 2020 all-time high i.e. things aren’t that bad in equity land. Its now less than 50 days until the US election so investors should expect plenty of increased volatility as the news flow intensifies until that often-asked question “can Trump win again?” is answered.
MM remains bullish US stocks medium-term.
US Dow Jones Index Chart
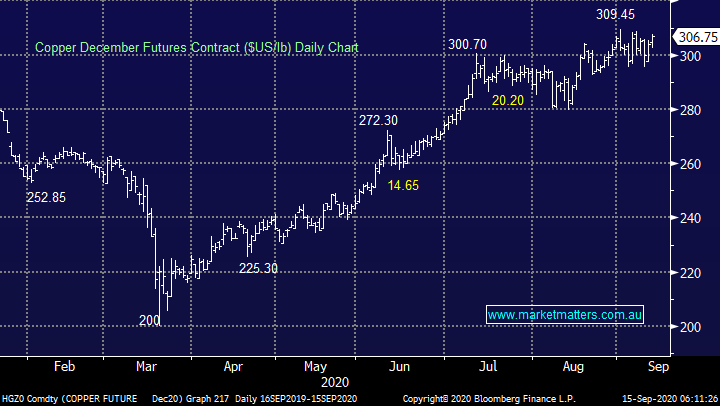
Overnight we saw another strong session from the commodities as the $US slipped lower, both gold and copper rallied just shy of 1%. We believe the sector is poised for another sharp rally as the $US slowly starts to continue its downward march; hence we are being pedantic with our selling of RIO Tinto (RIO) short-term in the Income Portfolio.
MM remains bullish Resources Sector medium-term.
Copper December Futures ($US/lb) Chart
Is it time to step up and buy coal stocks?
The Coal Sector has probably been the darkest corner of the market of the last year with the likes of Whitehaven Coal (WHC) down over 70%. The fall has been attributed to 2 primary factors in our opinion
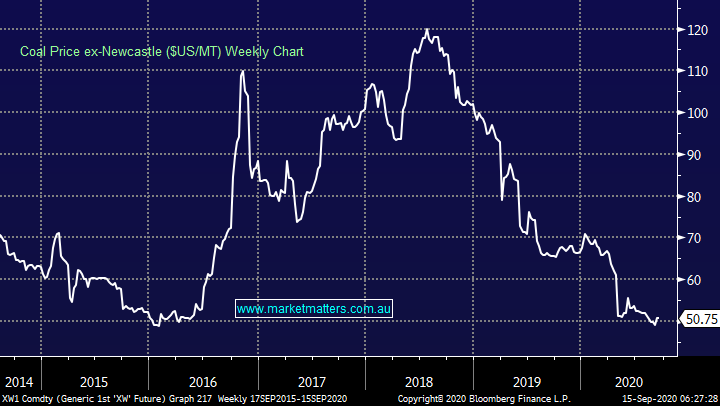
1 – Over the last 2-years the coal price has more than halved dragging with it the whole sector.
2 – There has been a substantial migration to non-fossil fuel investing amongst global money managers, these “clean” mandates by definition reduces the demand for stocks driving down the comparative valuations.
The end result is we get a friendless extremely cheap sector that will bounce sharply when the coal price can bounce, or at least stop falling. Medium-term the coal market is expected to remain under heavy pressure amid growing natural gas-powered production and rising share of renewable energy generation as more countries try to move to more environmentally friendly energy. Hence any foray into the coal sector should be recognised as a short-term counter trend play, not a long-term investment which by definition will not suit all readers.
MM feels the coal price is poised to bounce at least 10-15%.
Coal Price ($US/MT) Chart
Today I have simply reviewed 3 of Australia’s purest coal plays to see if the risk / reward is finally looking interesting for the aggressive “Active Investor” - importantly with this style of investment cutting losses is critical if it doesn’t unfold as hoped, again not for everybody.
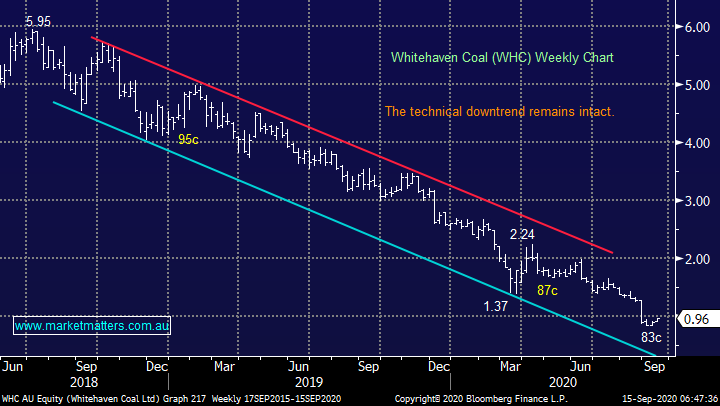
1 Whitehaven Coal (WHC) 96c
WHC has remained in a horrible downtrend now for over 2-years which has seen its shares plunge by around 85%. While we don’t own WHC , we have spoken about it in 2020 a number of times concluding it was ‘all too hard’ as the stock is suffering from a painful 2-edged sword – a collapsing coal price and many global fund managers no longer investing in fossil fuels however everyone loves a bargain hence WHC has been the topic of a number of Monday questions over the last 12-months.
What concerned me in their last update was the rise in gearing, which ticked up meaningfully. SHAW’s analyst in the stock Peter O’Connor actually likes it at current levels on valuation grounds (he has a $1.80 price target) and we discussed the company in our recent Webinar. I believe the stock is now what we would term “looking for a low” but after rallying close to 15% it’s not exciting. However, if we see another test of 80c MM may take a small speculative position but we don’t believe this is a stock to chase into strength.
MM is neutral but watching WHC.
Whitehaven Coal (WHC) Chart
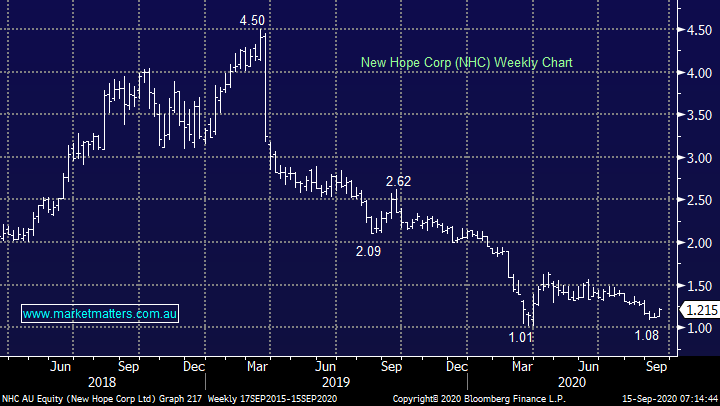
2 New Hope Corp (NHC) $1.21
Thermal coal business NHC remains a billion-dollar business even after its shares have fallen so dramatically and again the stocks looking interesting as it plumbs the $1 region. We could consider the stock in 2 ways with technicals and risk / reward playing a critical aspect when trying to buy bargains or as professionals usually say “pick bottoms” please excuse the image over your cornflakes.
1 – Buy today with stops below $1.12.
2 – Look to buy a false spike down under $1.
MM is watching NHC carefully for an attractive risk / reward opportunity.
New Hope Corp (NHC) Chart
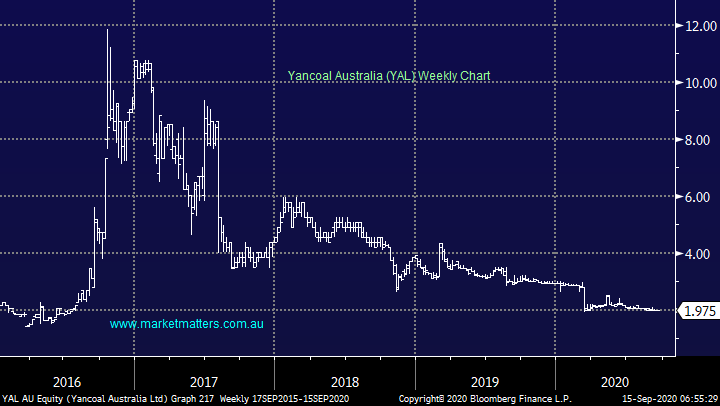
3 Yancoal Australia (YAL) $1.97
YAL is actually the largest Australian coal company with market cap of $2.6bn a fact that might surprise many as its probably the least discussed of the 3. The relatively new CEO has a strong track record and the stocks stability over the last year is testament to a degree in the markets belief in his ability. This is actually a potentially excellent yield play although their last payment was omitted – another one to watch carefully.
MM is neutral YAL.
Yancoal Australia (YAL) Chart
Conclusion
MM has successfully avoided coal over the last 2-years, but we now believe the time is arriving fast to potentially take on some aggressive exposure - we are observing the sector closely.
Have a great day!
James & the Market Matters Team
Disclosure
Market Matters may hold stocks mentioned in this report. Subscribers can view a full list of holdings on the website by clicking here. Positions are updated each Friday, or after the session when positions are traded.
Disclaimer
All figures contained from sources believed to be accurate. All prices stated are based on the last close price at the time of writing unless otherwise noted. Market Matters does not make any representation of warranty as to the accuracy of the figures or prices and disclaims any liability resulting from any inaccuracy.
Reports and other documents published on this website and email (‘Reports’) are authored by Market Matters and the reports represent the views of Market Matters. The Market Matters Report is based on technical analysis of companies, commodities and the market in general. Technical analysis focuses on interpreting charts and other data to determine what the market sentiment about a particular financial product is, or will be. Unlike fundamental analysis, it does not involve a detailed review of the company’s financial position.
The Reports contain general, as opposed to personal, advice. That means they are prepared for multiple distributions without consideration of your investment objectives, financial situation and needs (‘Personal Circumstances’). Accordingly, any advice given is not a recommendation that a particular course of action is suitable for you and the advice is therefore not to be acted on as investment advice. You must assess whether or not any advice is appropriate for your Personal Circumstances before making any investment decisions. You can either make this assessment yourself, or if you require a personal recommendation, you can seek the assistance of a financial advisor. Market Matters or its author(s) accepts no responsibility for any losses or damages resulting from decisions made from or because of information within this publication. Investing and trading in financial products are always risky, so you should do your own research before buying or selling a financial product.
The Reports are published by Market Matters in good faith based on the facts known to it at the time of their preparation and do not purport to contain all relevant information with respect to the financial products to which they relate. Although the Reports are based on information obtained from sources believed to be reliable, Market Matters does not make any representation or warranty that they are accurate, complete or up to date and Market Matters accepts no obligation to correct or update the information or opinions in the Reports. Market Matters may publish content sourced from external content providers.
If you rely on a Report, you do so at your own risk. Past performance is not an indication of future performance. Any projections are estimates only and may not be realised in the future. Except to the extent that liability under any law cannot be excluded, Market Matters disclaims liability for all loss or damage arising as a result of any opinion, advice, recommendation, representation or information expressly or impliedly published in or in relation to this report notwithstanding any error or omission including negligence.


