Subscribers questions (PAN, MXWO, APX, MP1, QQQ US, BABA US, MQG, AAPL US, NAB, BVS)
This week stocks are likely to start on a positive note following a strong session on Wall Street which was led by the recently under pressure tech names such as Apple (AAPL US) +3.8% and Microsoft (MSFT US) +2.5%. If we are correct with our bullish outlook through October tech is likely to lead the line as it did from the March lows both locally and overseas – the Tech Sector is only ~4% of the ASX200 but it has a large Beta (often moves in an exaggerated manner) plus often has a noticeable impact on the underlying market sentiment.
This morning will be fascinating for the Banking Sector following Friday’s explosive rally as lending governing powers were transferred from ASIC to the more business favourable APRA. Effectively Canberra is using banks and their freshly relaxed lending of credit as a new tool from its monetary policy kitbag – by hook or by crook they intend to keep our economy afloat with one eye fixed on property prices, relaxed lending is a huge shot in the arm for prices during these uncertain times.
Sportsbet still has Joe Biden at $1.80 and Donald Trump trailing at $2.00, a close contest is looming in just 36-days, I’m sure most of us will all be well and truly over the whole circus by time the results flash across our screens. The first debate occurs this week with Trump already demanding Biden takes a drug test beforehand, a similar ploy he rolled out with Hillary. At this stage, markets appear fairly relaxed, perhaps its being regarded by many as a fairly pedestrian event following a year which saw COVID-19.
Having listened to many podcasts recently from a range of sources on the US election aside from the clear consensus that it’s too close to call, my other observation is that the result is likely to be less important to the market than many expect. Whoever gets in the focus will be on the passage of stimulus, which both parties support (it’s the quantum they are haggling about). One independent research firm I follow makes the point that elections don’t have a big impact on markets in the medium term, macroeconomic policy remains the key driver, and I’d have to agree. The consensus that this US election will be the driver of huge volatility seems like it’s now become the consensus call. Given we can’t add much insight into the election, perhaps most value can simply be added by focussing on the macro dynamics, which remain supportive of stocks.
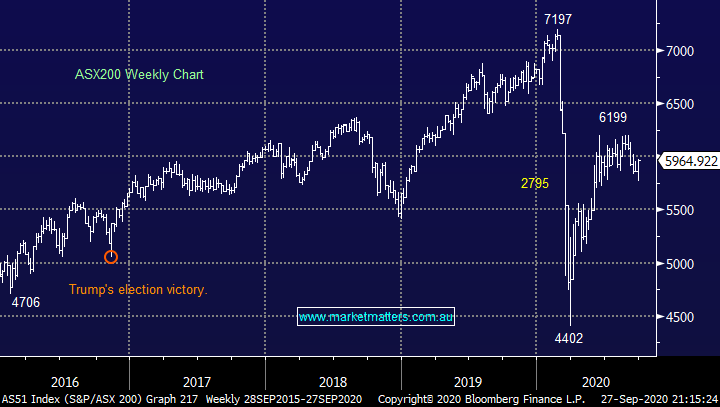
MM remains bullish Australian stocks short-term.
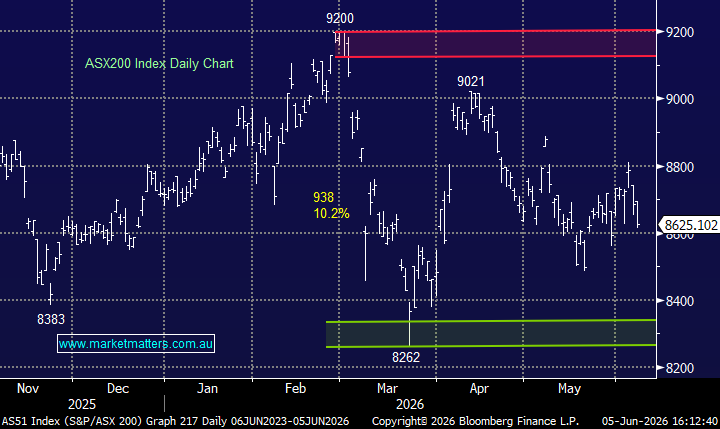
ASX200 Index Chart
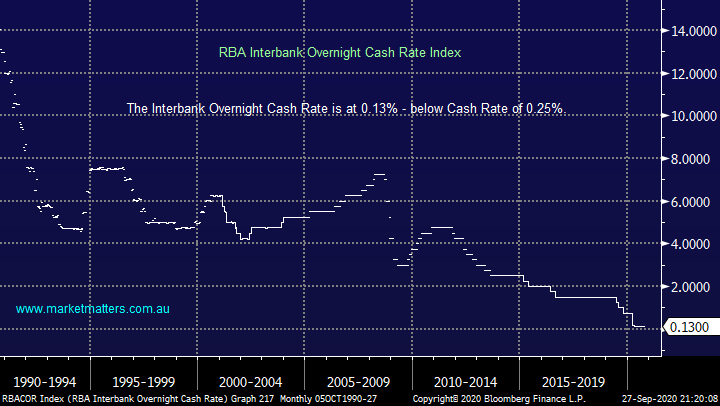
Last week Westpac economist Bill Evans forecasted the RBA will cut rates from 0.25% to 0.1% in October, personally I don’t believe the impact will be as significant as the banks relaxing their lending criteria but obviously it all helps, in absolute terms he’s calling rates to fall an astonishing 60%! With the interbank overnight lending rate at 0.13% and 3-year bonds pegged to the governments targeted 0.25%, there’s plenty of room for banks to make money from a mortgage around 2.5--3%. Healthy banks and lending is what’s required to help our economy reinvigorate itself and its one of the reasons the RBA has avoided dangerous path of negative interest rates.
MM believes rates will remain low throughout 2021.
RBA Interbank Overnight Cash Rate Chart
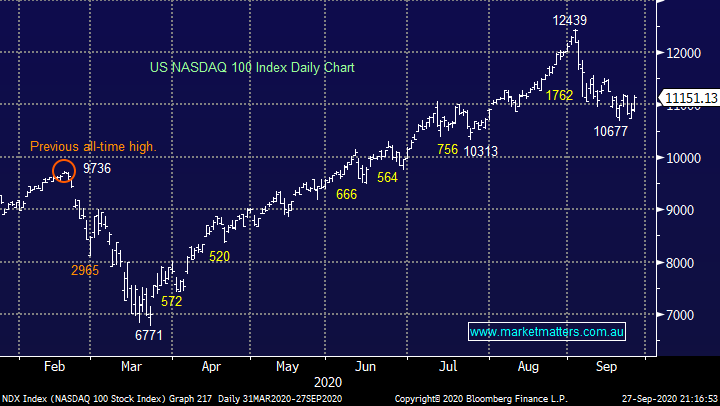
The tail that’s wagged the proverbial dog of equities in September has been the US tech stocks where even heavyweight Apple Inc (AAPL US) corrected 25% although a stock split did create a classic blow off in its share price. If we are correct the likes of Apple have found, or are looking for, a meaningful low / springboard to attempt another assault on its early month all-time highs.
MM remains bullish US Tech.
US NASDAQ Index Chart
Thanks again for the much-appreciated questions.
Question 1
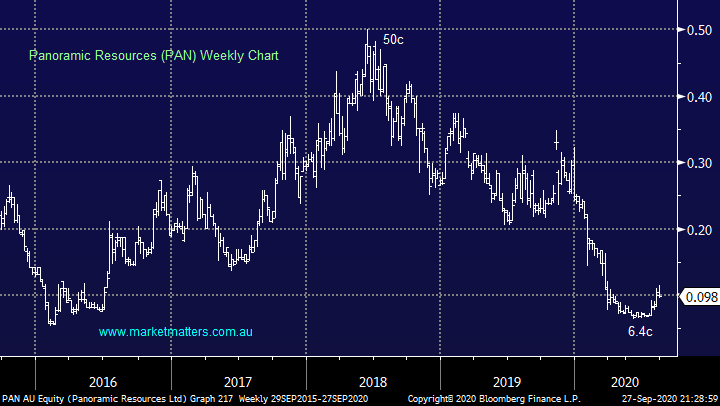
“Hi, very much enjoying my new subscription. I know you like WSA but my nickel play is PAN which I happily bought at 7c. What are your thoughts on PAN and the conditions it would need to get back to its lofty heights of 22c... or dare I dream of pre-COVID 30 cents???” - Alain M.
Morning Alain,
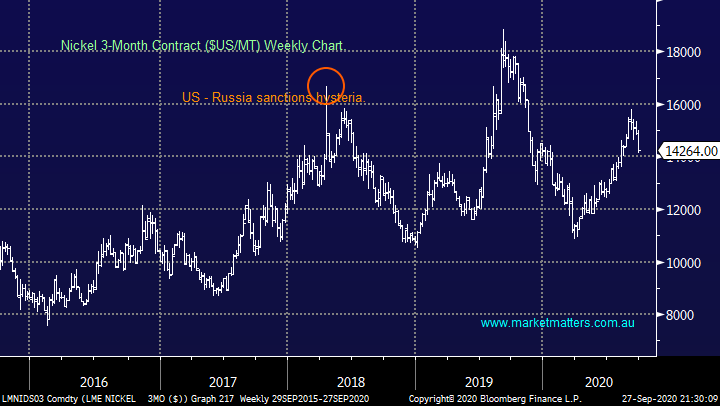
Welcome on board, I’m delighted your enjoying the new subscription. PAN is a $200m WA based resource company which is exposed to nickel, copper and cobalt sulphide or in other words its very battery focused. Elon Musk has just asked the mining fraternity to commit more efforts to nickel but its already trading well below its highs of 2019 reducing the short-term attraction.
For PAN to regain 22c I would simply extrapolate its relationship with nickel over recent times, in other words I feel everything else being equal nickel would need to rally ~30%.
MM likes PAN as an aggressive nickel play.
Panoramic Resources (PAN) Chart
Nickel ($US/MT) Chart.
Question 2
“Hi James I have enjoyed playing the market over the years, but now at, 87 years old it is time to rethink! I have some 30 different stocks showing about a 5.5% overall loss. The worst are AGL at -17%, BVS at -24% and OGC at - 30% Ideally I should like to cash up (but expensive) and invest in LIC or EFT for my grandchildren. Any thoughts?” – Thanks, a troubled Terry M.
Morning Terry,
I understand your dilemma, I come across a number of people having similar thoughts. At MM we do not provide personal advice but I do believe investors including ourselves should always look at any holding in terms of how they see it today looking forward, not where they got in with the obvious exception being tax considerations and that’s one for the accountant.
Perhaps one option is to slowly scale out of existing holdings similar to how we often do both in and out of a position, definitely less risk / stress than second guessing the short-term market twists & turns.
In term of ETFs, the following provide a broad market exposure.
IVV – covers the S&P 500 in America
A200 – covers the ASX 200 in Australia
IEU – covers the top 350 companies in Europe
IEM – covers Emerging Markets
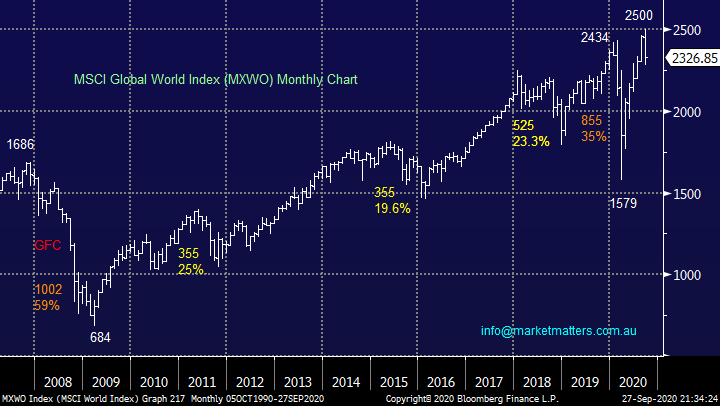
Or, a simple way to get coverage of ‘The World’ ex Australia is through the Vanguard MSCI International Shares ETF under code VGS which seeks to track the return of the MSCI World ex-Australia (with net dividends reinvested), in Australian dollars Index, before taking into account fees, expenses and tax.
MM likes equities as long-term investment asset class.
MSCI World Index (MXWO) Chart
Question 3
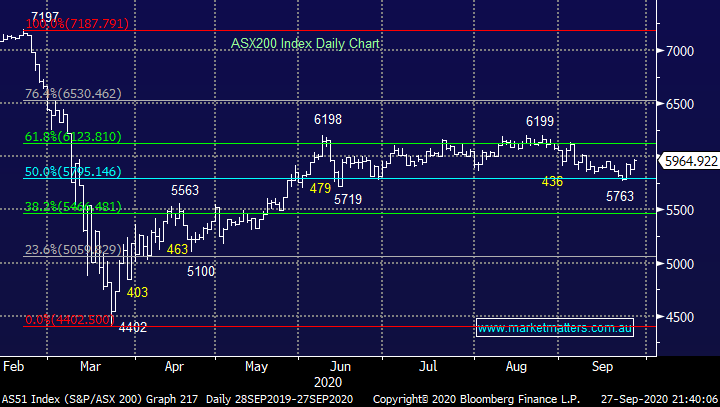
“Hi All at Market Matters. Firstly I would like to thank you for the great work that you do and I enjoy reading your reports which are informative. Just to confirm that I am a subscriber and have been for just under 2-years noting that this is my first question. Some weeks ago a subscriber talked about options and I thought that there may be others trading this particular product. I have traded equity options in the past doing both puts and calls. However after a review of same and doing some trading on the ASX200 Index I found this to be a more positive idea and I was wondering if your Sunday report each week could show the Fibonacci retracements and extensions IE 23.6%, 38.2%, 50%, 61.8%, 78.6%, 100% realising that 50% and 100% are not true Fibonacci figures. If this is possible perhaps it could be repeated in the Monday AM report. I look forward to a positive response.” - Kind Regards Alan D.
Morning Alan,
I’m glad you’ve finally pressed the button and asked a question, hopefully the first of many!
The chart below shows the Fibonacci retracements on the ASX from its March decent, obviously these are part of a subjective technical armoury when it comes to investing / trading i.e. we could have started the move from 4402 and be looking for pullbacks to the rally from the panic March low. For subscribers unfamiliar with such numbers outside of the Da Vinci Code book / movie of course:
1 - After strong moves in either directions markets often correct 38.2%, 50% or 61.8% before resuming the direction of the trend / move. Hence if as an investor you are looking to buy a market these are logical areas to accumulate.
2 – Alternatively if investors are looking for stops many people say a strong market should not correct more than 61.8% hence if it does, I’m out.
Following this question, I will use such Fibo. levels when I feel they are relevant to our thinking / potential actions moving forward but I will KISS and only use the main 3 mentioned above.
ASX200 Index Chart
Question 4
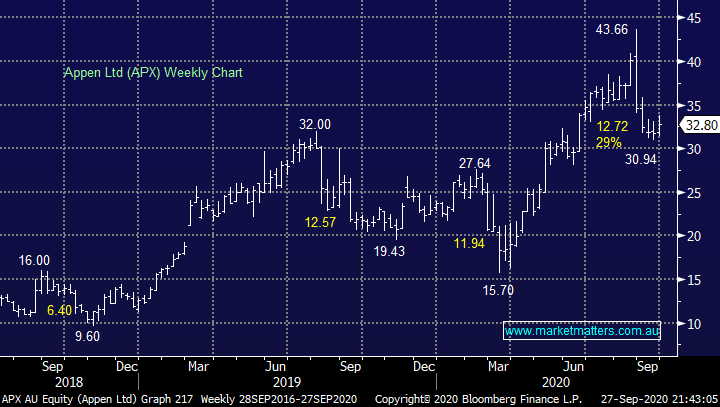
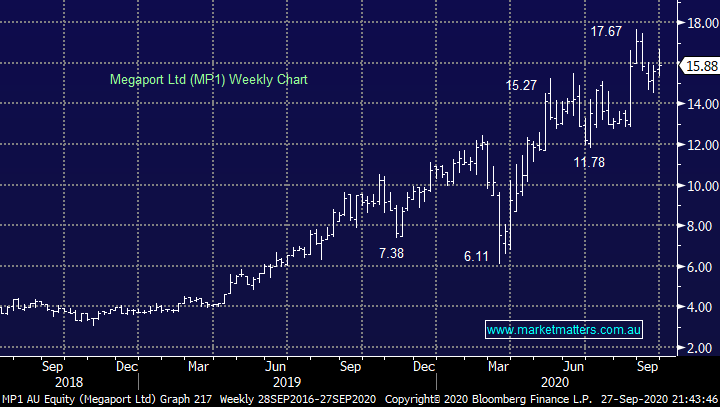
“Hi there guys, question at what price did you get into Appen (APX) & Megaport (MP1) as they never traded near the target/entry price after the alert was issued? At what tolerance level +(%) do you suggest we should be entering at?” – Thanks Steve B.
Morning Steve,
We entered Appen (APX) at $31.70 and Megaport (MOP1) at $15.68, as you say both of these levels are above the entry price but they are within the 1% tolerance we always use with both entry / exit levels – sorry if you’re a new subscriber who hasn’t seen us refer to this in the past. As a side note even with this latitude MM has missed stocks purchases / sales, a downside of being a real as opposed to theoretical portfolio!
MM remains comfortable with both holdings.
Appen Ltd (APX) Chart
Megaport Ltd (MP1) Chart
Question 5
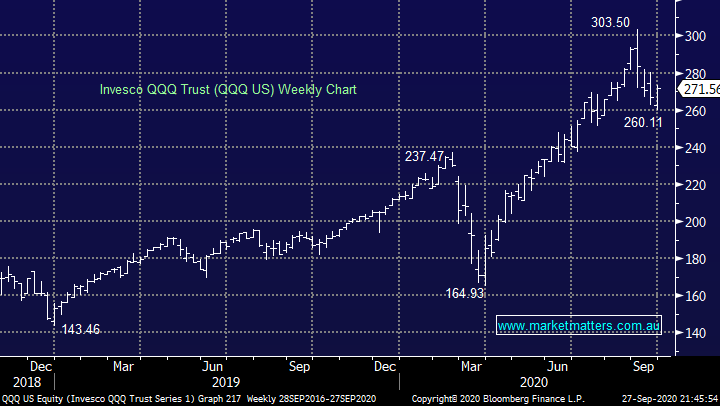
“Thanks for all your reports I note you have a buy on QQQ in the global ETF portfolio- a US based ETF that invests in Nasdaq stocks Can I ask why you wouldn't buy one of the ASX ETF’s on the NASDAQ such as NDQ or even HNDQ which is hedged.” – Russell E.
Morning Russell,
The are 2 reasons but importantly all 3 ETF’s should perform strongly if we are correct and US tech is poised to rally strongly:
1 – We felt the need for hedging the currency exposure was minimal with the $A testing the 74c area.
2 – We anticipate the extremes in the NASDAQ will probably unfold when the US stocks are trading hence providing better entry / exit opportunities.
MM remains bullish the QQQ.
Invesco QQQ Trust (QQQ US) Chart
Question 6
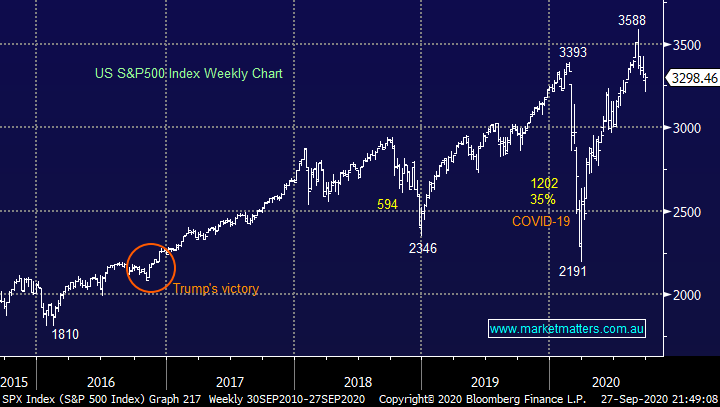
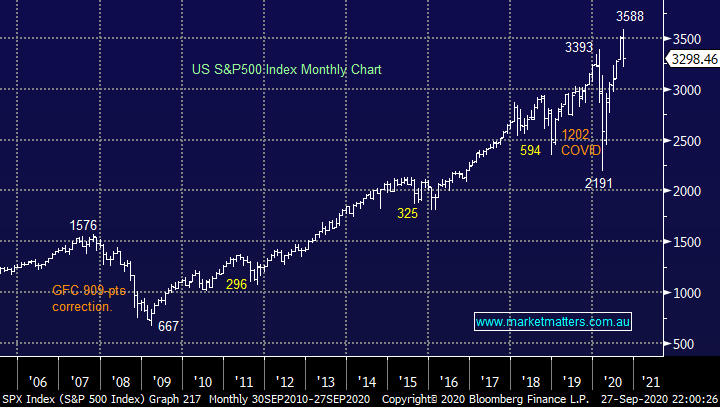
“G'day James & Team. Thanks for your ongoing independent thinking and suggestions in these tricky times. I was a little uncomfortable with the statement in the Monday morning report stating 'just read some of Bidens rhetoric, it doesn’t bode too well for stocks: “Throughout this crisis, Donald Trump has been almost singularly focused on the stock market, the Dow and Nasdaq. Not you. Not your families,” Joe Biden. Firstly I would argue that this is not necessarily rhetoric on Biden's part as it would be hard to say his statement lacks truth. Other than that, as for a Biden victory not boding well for financial markets, this can be also challenged on the basis that it has been shown that American stock markets have performed better under Democrat rather than Republican administrations. However, that fact is more to do with business cycles and does not imply cause and effect says Professor Jeremy Siegel. An interesting article on this can be found at: www.forbes.com/sites/sergeiklebnikov/2020/07/23/historical-stock-market-returns-under-every-us-president/ ” - Cheers, David H.
Morning David,
Undoubtedly a fascinating subject which will get plenty of air time over the next 36-days but personally I do believe stocks have enjoyed Trumps Presidency as illustrated below - in particular tax breaks and deregulation have been embraced by the market. Importantly these comments have zero indication of my personal political leanings just our interpretation around stocks today although I do agree the points raised in your question.
MM believes that macro policy will remain the primary driver of stocks medium term
US S&P500 Index Chart
Question 7
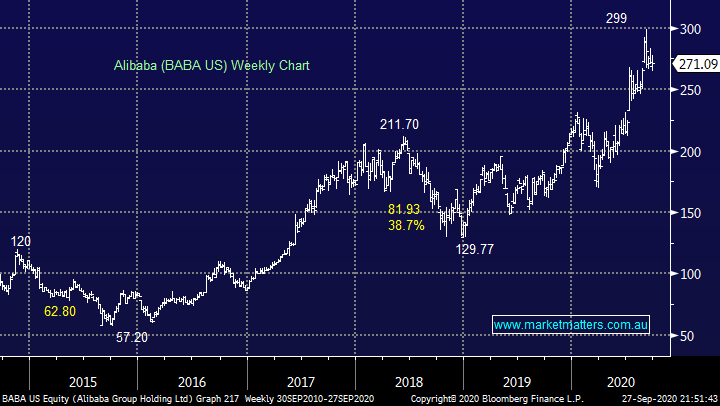
“Do you know anything about the Ant IPO which is going ahead in Hong Kong? I have read it is supposed to be one of the largest in the world. I believe it is associated with Alibaba which was quite successful.” - Thank you, David H,
Hi David,
Ant Financial is the operator of a cloud-based financial platform designed to provide cloud computing services to financial enterprises. The company is a spin-off from tech billionaire, Jack Ma's Alibaba Group Holdings, has already raised funding in excess of US$20B pre-IPO, making it one of the largest (if not the largest!) fintech start-ups in the world today with a current implied valuation of US$150B!
The Ant Group could be headed for the largest initial public offering in history, as the Chinese financial-technology juggernaut chases a valuation that would rival the biggest payments companies in the world. The Alibaba Group Holding Ltd.–affiliated company controlled by Jack Ma has filed paperwork to list its shares concurrently on the Hong Kong and Shanghai exchanges. Assuming global tech stocks are holding together I imagine this will more than likely be a big success.
Getting any stock in such as IPO is very hard, I tried many avenues to secure an allocation in Snowflake (SNOW US) which was recently listed in the US, but without any luck.
MM is long & bullish Alibaba.
Alibaba (BABA US) Chart
Question 8
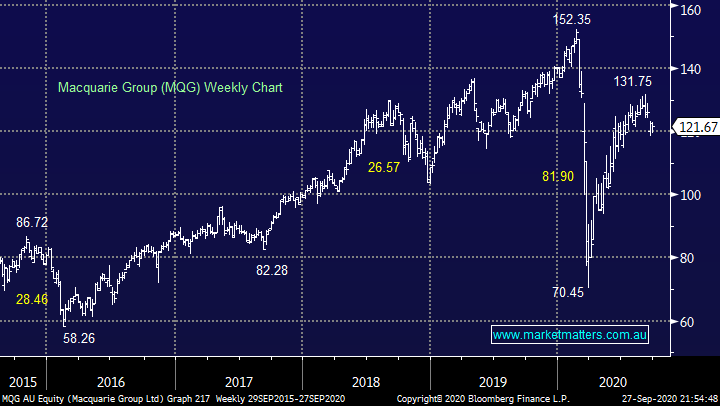
“Hi James and team, One quick and very pre-emptive question. What have you heard around the traps concerning the possible Macquarie led IPO for Nuix? I would be keen to get set for this one.” – Cheers Jeff M.
Hi Jeff,
Macquarie Group (MQG) is preparing to list its majority-owned software provider Nuix in a deal that would value the data-analysis program seller at close to $1.5 billion. Nuix is extremely well positioned to be a great float residing in the hot technology sector which has actually benefitted from COVID-19. Nuix is used globally to manage cyber security, risk and compliance threats plus investigate fraud using its own data analytics engine. Unlike many floats, Macquarie holds a massive 65% of Nuix on its own balance sheet and looks set to make a massive profit compared to its original cost for the stake.
Valuation remains key as volatility increases in the tech sector and with lots of water to go under this bridge before the anticipated float in the first half of 2021 – we will continue to watch and evaluate the news flow.
Macquarie Group (MQG) Chart
Question 9
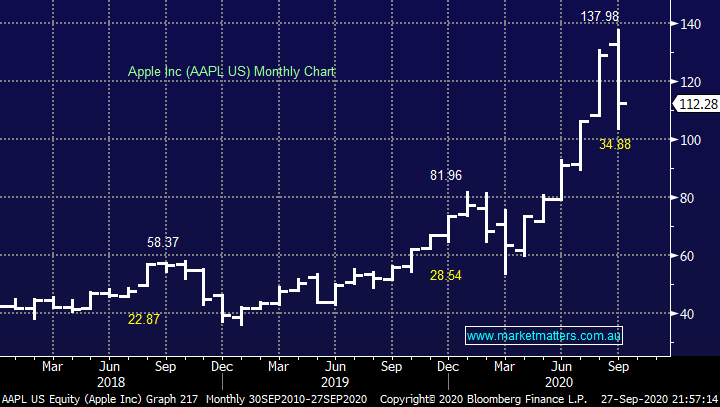
“Hey James & Team, love your opinion, can I please have your review on opt, par. mms and enter point. where can buy BABA , Apple and enter point. thanks for your time” - Regards Yi.
Hi Yi,
Sorry that’s a lot of stocks to cover in one question but with the exception of Maximus (MMS US) we like all of them at today’s price. As we discussed earlier we are bullish into October and assuming this view unfolds there’s no time like the present for buyers. Apple Inc (AAPL US) for example has now corrected 25% and after seeing the price of a new iPhone yesterday I’m bullish – well over $2,000 shocked me!
MM is bullish stocks into October.
Apple Inc (AAPL US) Chart
Question 10
“Dear James and Team - a Monday morning question if I may. I have been thinking about 'Black Swan' events. We retail investors used to fear them, but more in the abstract rather than as something that could happen tomorrow. These days the increasing pace of life seems to be throwing up these events more regularly (Tech Wreck, GFC, COVID etc etc). So (and here's my question, finally!) should we fear another 'Black Swan' if Trump acts on his anti-democratic rhetoric and/or violence breaks out in the US come their election in November? Would it be prudent at the least to prune profit positions ahead of November?” - Karl B.
Morning Karl,
We will be watching the tape for clues but if stocks do run strongly into November our plan is to increase cash but in today’s market that might be all finished in just a few days. We do believe volatility is set to increase into Christmas hence we are constantly evaluating our risk profile. I feel like we’re on the same page if perhaps for slightly different reasons, remember Black Swan events by definition occur when least expected and everyone’s already scrutinizing the election carefully, we are looking to execute our current mantra “ sell strength & buy weakness” with valuations & sector rotation front and centre of our thoughts.
MM is bullish short-term.
US S&P500 Index Chart
Question 11
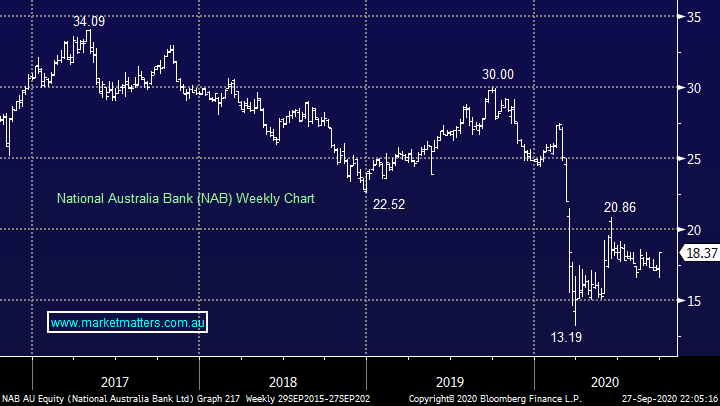
“Hi James, I have several questions. Is it now a good time to top up CBA NAB and WBC ? Should I consider taking profits in BHP and FMG ? Any views on CDM ?” -Keep up the great work. David M.
Morning David,
A question full of questions hence please excuse the short answers:
1 – We are comfortable being market weight the banks at present but with bond yields showing no signs of recovery we are refraining from going aggressively long, at least for now.
2 – The resources have already corrected over 50% of our targets, we are considering buying back into the sector via Fortescue (FMG) around $15.
3 – Cadence Capital (CDM) has been a horrible investment over the past few years however it is improving having recovered strongly from its March lows, more than doubling from 32c, we are now neutral as the stock approached 80c however it does still trade at a 16% discount to NTA.
National Australia Bank (NAB) Chart
Question 12
“Hi James, Thanks again for your insights. Enjoy reading your reports. With the US Election looming would be interested in your thoughts about the sectors and stocks you see particularly benefitting the most and losing the most under a Trump victory and a Biden victory.” - Thanks Peter O.
Morning Peter,
An interesting question which deserves more than a quick answer at the end of today’s report. I will focus a whole morning report on the subject
Question 13
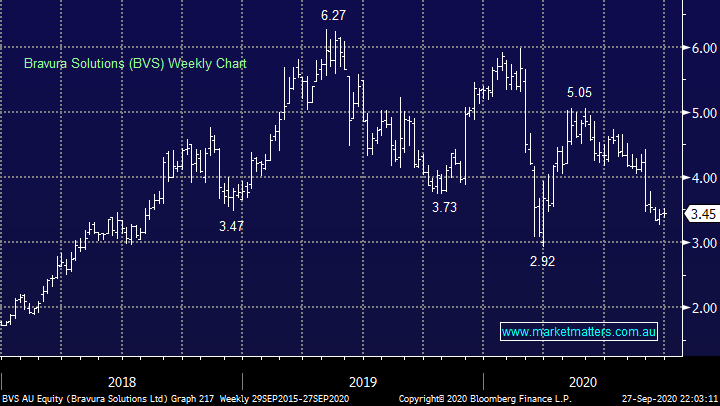
“Hi James and the team. I’m really enjoying your strategy thoughts. Could you talk a bit about how you handle your stock selections that seem to be in trouble. Large unrealised losses on WSA BVS BIN BPT EHL CGC ABP PPT. It’s interesting that even the pros get it wrong sometimes. I’m just interested in how much pain you are prepared to tolerate before you agree that you've got it wrong. Can you give an update on how each fund is performing overall, like fund managers do, YTD or last 12-months. Keep up the great work. Loving the thought processes.” – Regards Marvin C.
Morning Marvin,
I feel a distinct sense of Deja Vue with this question. Dealing with losses is arguably the most important aspect to successful investing however as we’ve suggested above / many times before, it’s important to look at positions now with an eye on the future, what the company / stock will do from here rather than always looking behind you. In very simple terms, we consider 3 questions – has the reason we bought gone? Do we want to exit the stock? If so what’s the optimum price we see achievable in the coming weeks.
For example of the stocks you’ve mentioned in the Growth Portfolio Bravura (BVS) has been at the front of our minds as we look to pick an ideal exit level but as it nestles in the Tech Sector we anticipate a bounce from current levels.
In terms of performance:
Growth portfolio: +10.16%pa since inception (10th May 2016)
Income portfolio: +4.01% pa since inception (5th July 2017)
International Equities portfolio: +16.26%pa since inception (26th June 2019)
Global ETFs portfolio: -1.58%pa since inception (3rd July 2019)
We also have an emerging companies portfolio which is not yet published on the site which has an inception date of 31st January 2020. This portfolio will be launched in the coming months with the new Market Matters website.
**As at 31st August**
MM is looking to sell BVS ~$3.75, or 10% higher.
Bravura Solutions (BVS) Chart
Have a great day & week!
James & the Market Matters Team
Disclosure
Market Matters may hold stocks mentioned in this report. Subscribers can view a full list of holdings on the website by clicking here. Positions are updated each Friday, or after the session when positions are traded.
Disclaimer
All figures contained from sources believed to be accurate. All prices stated are based on the last close price at the time of writing unless otherwise noted. Market Matters does not make any representation of warranty as to the accuracy of the figures or prices and disclaims any liability resulting from any inaccuracy.
Reports and other documents published on this website and email (‘Reports’) are authored by Market Matters and the reports represent the views of Market Matters. The Market Matters Report is based on technical analysis of companies, commodities and the market in general. Technical analysis focuses on interpreting charts and other data to determine what the market sentiment about a particular financial product is, or will be. Unlike fundamental analysis, it does not involve a detailed review of the company’s financial position.
The Reports contain general, as opposed to personal, advice. That means they are prepared for multiple distributions without consideration of your investment objectives, financial situation and needs (‘Personal Circumstances’). Accordingly, any advice given is not a recommendation that a particular course of action is suitable for you and the advice is therefore not to be acted on as investment advice. You must assess whether or not any advice is appropriate for your Personal Circumstances before making any investment decisions. You can either make this assessment yourself, or if you require a personal recommendation, you can seek the assistance of a financial advisor. Market Matters or its author(s) accepts no responsibility for any losses or damages resulting from decisions made from or because of information within this publication. Investing and trading in financial products are always risky, so you should do your own research before buying or selling a financial product.
The Reports are published by Market Matters in good faith based on the facts known to it at the time of their preparation and do not purport to contain all relevant information with respect to the financial products to which they relate. Although the Reports are based on information obtained from sources believed to be reliable, Market Matters does not make any representation or warranty that they are accurate, complete or up to date and Market Matters accepts no obligation to correct or update the information or opinions in the Reports. Market Matters may publish content sourced from external content providers.
If you rely on a Report, you do so at your own risk. Past performance is not an indication of future performance. Any projections are estimates only and may not be realised in the future. Except to the extent that liability under any law cannot be excluded, Market Matters disclaims liability for all loss or damage arising as a result of any opinion, advice, recommendation, representation or information expressly or impliedly published in or in relation to this report notwithstanding any error or omission including negligence.