The MTUM ETF provides exposure to a portfolio of large- and mid-cap US stocks exhibiting the strongest price momentum. In simple terms, it systematically buys stocks with the strongest recent performance and reduces exposure to those losing momentum. The ETF tracks the MSCI USA Momentum SR Variant Index, selecting and weighting holdings based on six- and 12-month price performance. Managed by BlackRock, this US$26bn ETF is one of the market’s best-known momentum factor ETFs, providing investors with a single-ticket way to capture the well-documented tendency for recent outperformers to continue outperforming over the medium term.
This is a concentrated ETF, with the top 10 positions accounting for ~40% of holdings; semiconductors dominate the fund, with Micron, AMD, Broadcom, Intel, Lam Research and Applied Materials together comprising more than 20% of total assets, highlighting the sector’s strong momentum over the past year. Outside technology, Caterpillar and GE Vernova provide industrials exposure, while ExxonMobil and Johnson & Johnson add diversification across the energy and healthcare sectors.
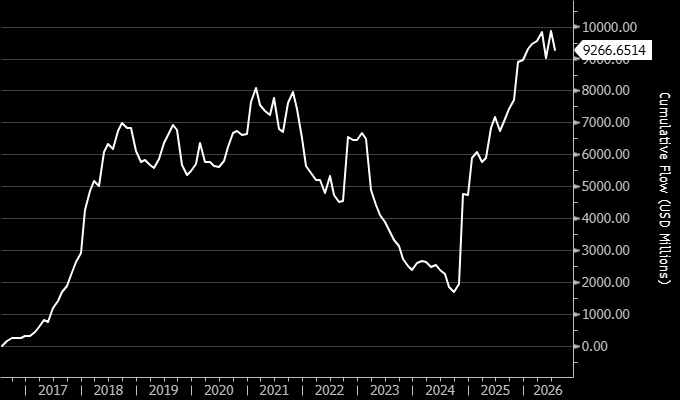
As momentum trading has delivered results over the last 12-18 months, FUM has poured into the ETF, with the post-US election the obvious inflection point:
- Cumulative flows rebounding to almost US$10 billion by June 2026, just as profit-taking hit the semiconductor stocks!

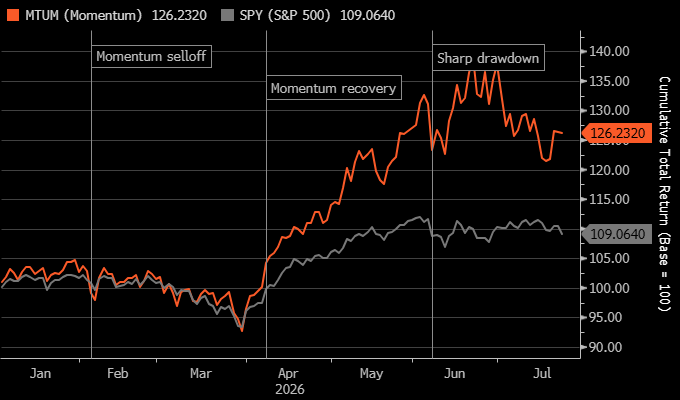
The “momentum trade” has been getting almost too much press of late, with the semiconductors unwinding as investors and speculators alike became too bullish. MTUM has significantly outperformed the S&P 500 in 2026, returning +26.2% YTD through July 23 versus +9.1% for the S&P 500, an outperformance of approximately +17%. However, MTUM’s outperformance is high-beta in nature; it has delivered impressive returns YTD, but with significantly greater drawdowns and volatility along the way. Its worst single day (-5.95% on June 5) was more than double SPY’s worst day (-2.58%), underscoring the asymmetric risk profile of momentum factor investing.
- The MTUM ETF has corrected 15% to date, but we wouldn’t be chasing the momentum trade at this stage.