Is Fortescue (FMG) the next Telstra (TLS)? (MYR, CBA)
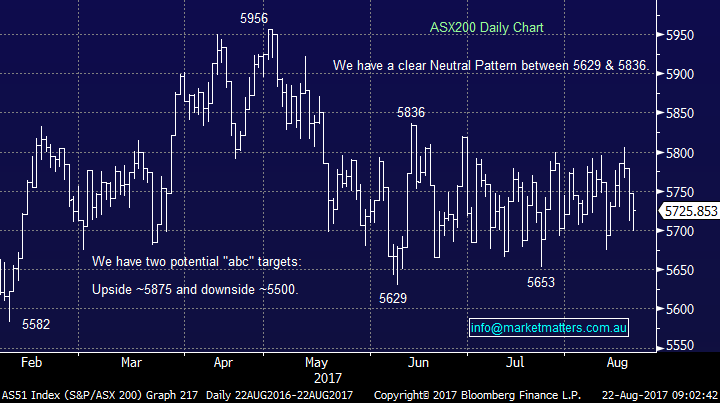
The ASX200 extended its almost random trading walk into the 14th week of range bound oscillation between 5629 and 5836. The market opened strongly helped by the positive sentiment from Fortescue’s (FMG) result only to be aggressively sold down almost 60-points, before yet again managing to recover ~20-points in the last 30 minutes of the day. With BHP reporting this morning perhaps the market will finally lose its shackles over the coming few days. **In terms of BHPs result, it’s just out and they have missed expectations in terms of earnings (3% miss) and dividend which came in at 83cps versus 84cps consensus. The only offset to this is lower debt of $16bn versus the market at $18bn so it seems like they have focussed on debt reduction in the first instance, over and above dividends. The conference call at 9am will provide more detail**
As expected we had a few big movers on the day as corporate Australia continued with its reporting season, some of the winners included Fortescue (FMG) +6.4%, APN Outdoors (APO) +6.1%, Beach Energy (BPT) +10.5% and G8 Education (GEM) +8.9% while amongst the losers were BlueScope Steel (BSL) -21.8%, Vocus (VOC) -14.6% and Ardent Leisure (AAD) -3.9%. We read an interestingly report in the AFR yesterday which said that to-date 1.3x more companies have missed expectations compared to those that have exceeded analysts’ forecasts. When we combine this poor corporate performance with a distinctly “wobbly” US stock market the ASX200 is clearly performing well to tread water.
We still maintain a slight technical / seasonal bias for a pullback towards 5500 but a catalyst to cause this ~4% correction remains absent.
ASX200 Daily Chart
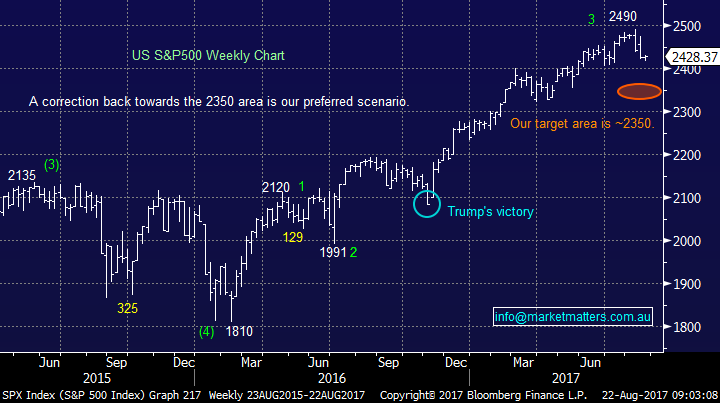
US Stocks
US equities were basically unchanged overnight and a few days sideways price action would now not surprise us with important economic events later in the week.
We remain bearish US stocks targeting a correction of ~5% over coming weeks as sell signals continue to emerge.
US S&P500 Weekly Chart
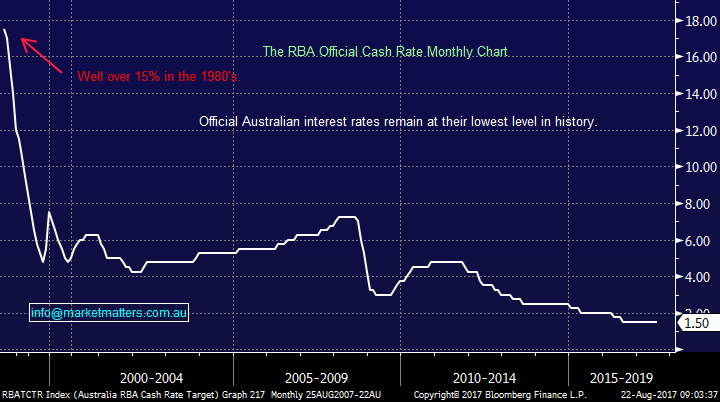
Global bond markets have enjoyed one of the strongest bull markets in history as interest rates across the world plunged to their lowest levels in history. Locally even though mortgage rates have been creeping higher over recent months the RBA official cash rate has remained at its historical low point of 1.5% for the last 12-months.
Home mortgages are still readily available ~4% compared to well over 14% in the late 1980’s. Even bringing the timeframe closer to the present it’s amazing to think that interest rateswould need to more than quadruple to get back to GFC levels, only around 10-years ago, and over triple to be at levels experienced just 6-years ago.
RBA Targeted Cash Rate Monthly Chart
One of the main games in town, due to falling interest rates over the last decade, has been the hunt for yield from stocks who often pay healthy fully franked dividends generating an income well in excess to the returns available from a bank deposit. The AX200 is actually the best-yielding equities index compared to the 12 largest stock markets in the world i.e. we are spoilt at least on one level!
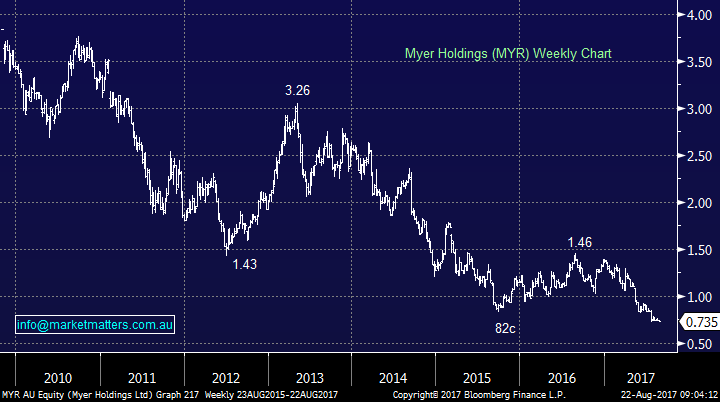
However, this very same hunt for yield has made many investors pay dearly as they have worn blinkers and ignored other fundamental issues around a particular company e.g. lack of growth, or even contraction, unsustainable payout ratios, competitive threats etc. Two awful examples that I have witnessed unfold are Myer (MYR) and to a lesser extent Metcash (MTS).
MYR traded well over $3.50 not long after listing in late 2009 and for most of its trading life its paid an amazing yield like todays 8.2% (FF), however the stock has fallen over $3 from its 2010 high to close at 73.5c yesterday while it has paid well under $1 in dividends during the same period, this unfortunately equates to huge wealth destruction.
The clear lesson is high dividend yield does not mean profitable and safe investing.
Myer Holdings (MYR) Weekly Chart
As interest rates rise, which we believe is almost inevitable, investors may be walking in a potential minefield as they continue to chase yield from Australian stocks.
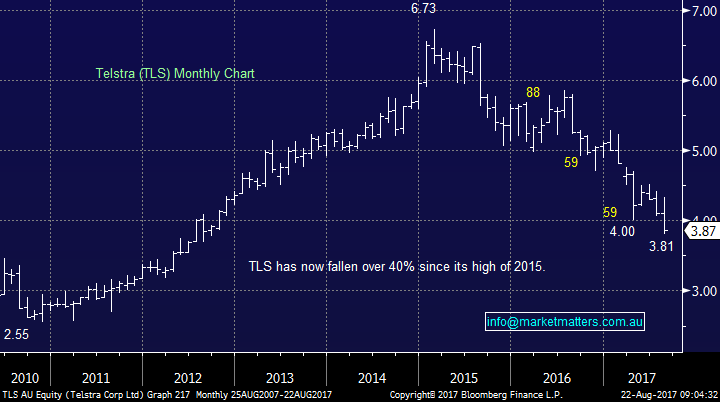
As most of us have read over the last week around 1 million Telstra shareholders have seen their investment savaged as the company signalled their intention to slash their dividend to 22c for FY18 from the current 31c. A cut to its sacred dividend was broadly expected due to the estimated $2-3bn fall in earnings courtesy of the NBN - Note they are still paying a 15.5c fully franked dividend later this month. However, while the cut was always inevitable the reality and magnitude certainly rattled the market.
We actually find it amazing that suddenly most of the telco analysts who did not get close to forecasting the almost 30% cut to its dividend are now saying 22c is not sustainable while 16-18c is more on the money.
TLS will be yielding what we believe is now a relatively sustainable 5.7% fully franked dividend commencing next financial year, basis $3.87.
If the TLS dividend is further slashed another 20% to 18c then we need to buy TLS ~$3.60 to receive a 5% fully franked yield - this is MM’s current level to average our initial purchase at $3.85.
However, Investors should be aware that TLS is describing itself as a tech company and we believe they have a great foundation to find growth, however remember that APPLE only pays a 1.6% yield so TLS dividend is highly unlikely to move higher in the foreseeable future.
We believe TLS is actually now an ideal active investment which happens to currently pay a healthy fully franked yield, we are likely to have no hesitation is taking profit on any 50c rally in the TLS share price as we have done previously on more than one occasion.
Telstra (TLS) Monthly Chart
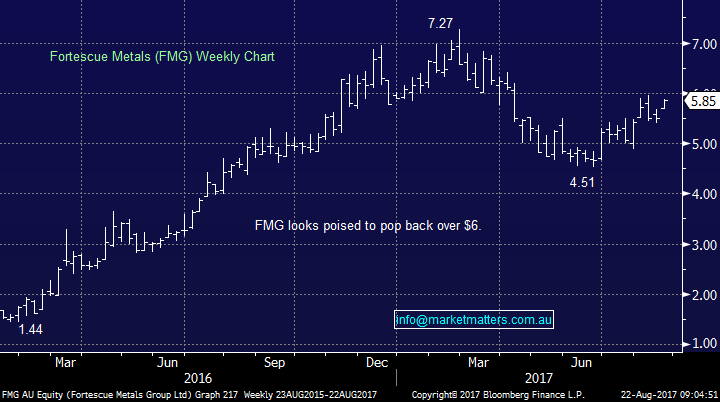
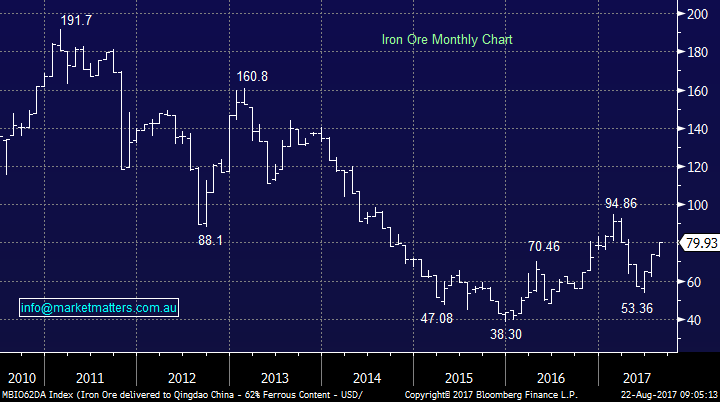
Yesterday FMG actually reported a miss on earnings but a huge positive surprise on capital management sending the stock up over 6%. They are going to pay an exciting 25c fully franked dividend on September 1st, certainly more eye catching than TLS today. However, if iron ore halves in price again on say a China slow down this current dividend picture will change very rapidly. “Twiggy” Forrest and FMG have done an amazing job at turning FMG around primarily by reducing the cost of production and paying down debt but the iron ore price remains key. At this stage, the market’s expectations for Iron Ore are a lot lower than the current spot price, and therefore the longer the price stays elevated, the more earnings upgrades FMG will receive. On the revised dividend guidance (50-80% of NPAT), Fortescue is likely to yield somewhere between 4.5-7% fully franked – which is HUGE for a resource stock (at this point in time).
We believe FMG is an excellent active investing / trading stock with a likely health dividend moving forward which we may on occasion attempt to capture but the current dependency on iron ore cannot be ignored.
Fortescue Metals (FMG) Weekly Chart
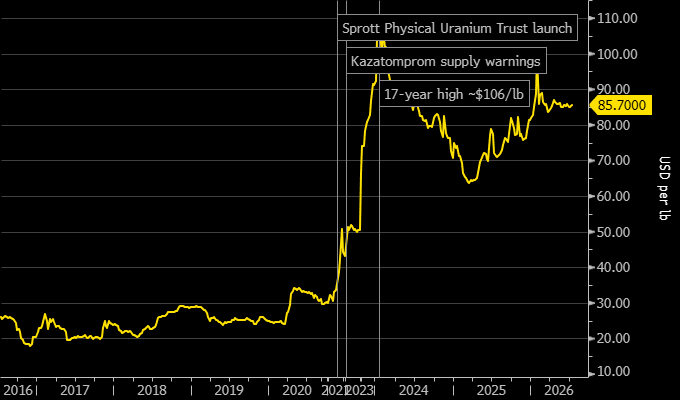
Iron Ore Monthly Chart
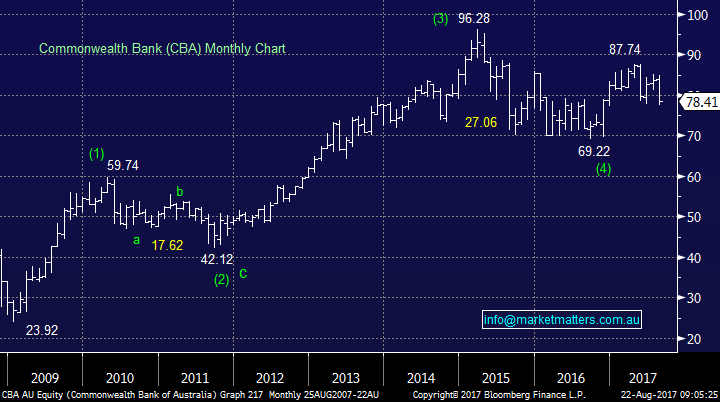
Commonwealth Bank currently pays 5.47% fully franked and unlike other “yield play” stocks like Sydney Airports (SYD) and Transurban (TCL) will actually enjoy higher interest rates from an operational perspective.
We pointed out back in 2015 when we sold our CBA position well over $90 that investors were way too often quoting “you can’t go wrong in the banks” which clearly proved very wrong as they subsequently corrected almost 30%. However, in the high -$70 region we can see value from CBA with potential capital gain and a healthy fully-franked yield.
Commonwealth Bank (CBA) Monthly Chart
Conclusion (s)
We actually believe the best strategy to enjoy the healthy dividend yield on offer in the Australian share market is via group of stocks / hybrids i.e. “The Market Matters Income Portfolio” is obviously our current picks.
If investors run away from TLS and pile into FMG at current levels it feels like potential panic in both directions at what may prove to be market extremes. We do have some higher risk stocks in our portfolio e.g. Harvey Norman and Genworth who are both working pretty well at the moment. Undoubtedly, they may be a place on our list for Fortescue but the reliance on the iron ore price will be prominent in our selection.
https://www.marketmatters.com.au/new-income-portfolio-csv/
Overnight Market Matters Wrap
· The US closed with little change and seems that it will be like this for the remainder of this week as investors sit on the sideline, as investors wait for some light to be shed from the gathering of central bankers in Jackson Hole.
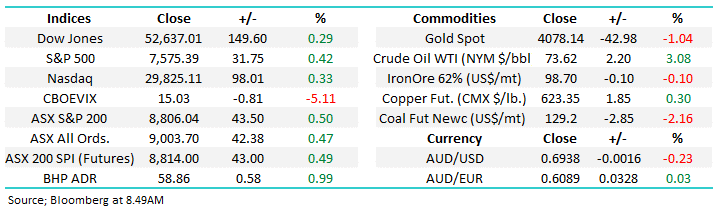
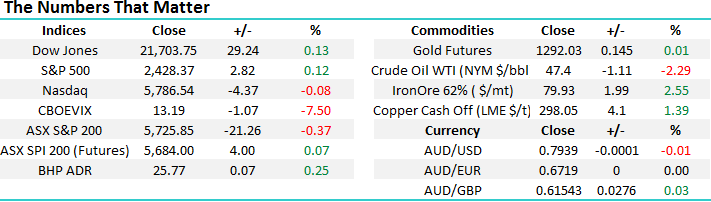
· Iron Ore followed Asia’s strength from yesterday, rallying 2.55% to US$79.93/t, along with our ‘Aussie Battler’ back above the US79c level.
· Domestically, focus remains on earnings, with the following due to report today – ACX, AMC, BHP, CTD, GXL, ING, LHC, MND, OSH, SYD, VRT and WSA.
· The September SPI Futures is indicating marginally soft open in the ASX 200 this morning, above the 5720 level.
Disclosure
Market Matters may hold stocks mentioned in this report. Subscribers can view a full list of holdings on the website by clicking here. Positions are updated each Friday.
Disclaimer
All figures contained from sources believed to be accurate. Market Matters does not make any representation of warranty as to the accuracy of the figures and disclaims any liability resulting from any inaccuracy. Prices as at 22/08/2017. 5.00PM.
Reports and other documents published on this website and email (‘Reports’) are authored by Market Matters and the reports represent the views of Market Matters. The MarketMatters Report is based on technical analysis of companies, commodities and the market in general. Technical analysis focuses on interpreting charts and other data to determine what the market sentiment about a particular financial product is, or will be. Unlike fundamental analysis, it does not involve a detailed review of the company’s financial position.
The Reports contain general, as opposed to personal, advice. That means they are prepared for multiple distributions without consideration of your investment objectives, financial situation and needs (‘Personal Circumstances’). Accordingly, any advice given is not a recommendation that a particular course of action is suitable for you and the advice is therefore not to be acted on as investment advice. You must assess whether or not any advice is appropriate for your Personal Circumstances before making any investment decisions. You can either make this assessment yourself, or if you require a personal recommendation, you can seek the assistance of a financial advisor. Market Matters or its author(s) accepts no responsibility for any losses or damages resulting from decisions made from or because of information within this publication. Investing and trading in financial products are always risky, so you should do your own research before buying or selling a financial product.
The Reports are published by Market Matters in good faith based on the facts known to it at the time of their preparation and do not purport to contain all relevant information with respect to the financial products to which they relate. Although the Reports are based on information obtained from sources believed to be reliable, Market Matters does not make any representation or warranty that they are accurate, complete or up to date and Market Matters accepts no obligation to correct or update the information or opinions in the Reports.
If you rely on a Report, you do so at your own risk. Any projections are estimates only and may not be realised in the future. Except to the extent that liability under any law cannot be excluded, Market Matters disclaims liability for all loss or damage arising as a result of any opinion, advice, recommendation, representation or information expressly or impliedly published in or in relation to this report notwithstanding any error or omission including negligence.
To unsubscribe. Click Here