Should we add to our BHP position?
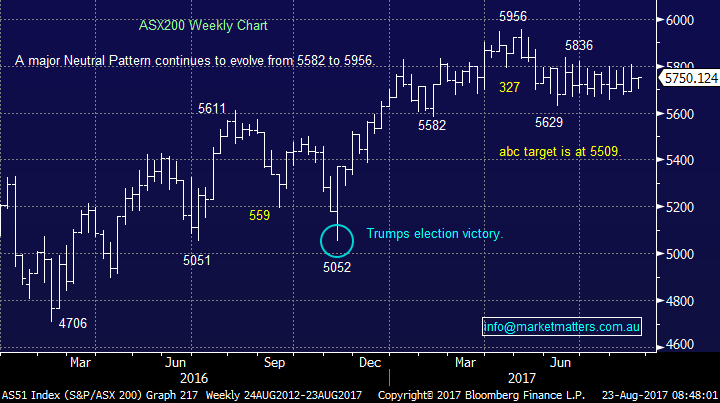
Yesterday the ASX200 continued with its holding pattern between 5629 and 5836 which is now well into its 14th week with no apparent catalyst to generate any deviation from its current sideways path. This has undoubtedly been a very frustrating period for many traders / investors alike but we continue to advocate a degree of patience, it’s just when you give up on the market that it provides an opportunity.
We have held a negative bias for a number of weeks targeting the 5500-area but recently we have been forced to acknowledge that stocks continue to find excellent support into any weakness. Last night’s rally by US stocks negates our short-term negative view for the S&P500, this potential scenario was outlined in the weekend report – “Standout chart of the week”. Global stocks have now shrugged off both North Korea and Donald Trump’s lack of ability to govern, remember the phrase we often quote: “A market which doesn’t fall on bad news is a strong market” – MM.
ASX200 Weekly Chart
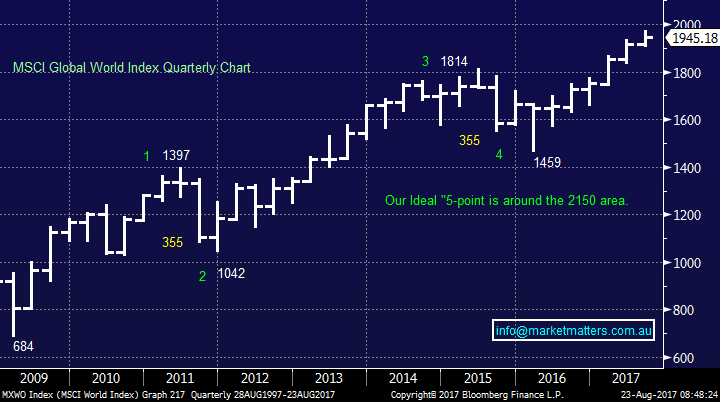
We believe it remains very important for MM subscribers to remember that our long-term view is that the current bull markets for stocks which began back in March 2009 is maturing relatively fast and although it’s not yet a “smelly stilton” caution should be heeded rather than chasing stocks for “fear of missing out” (FOMO).
We targeted over 2100 for the MSCI Global World Index back in 2016 when many doubted our view, here we are over 30% higher and although we still see further upside simply chasing the market as a whole is clearly now a flawed strategy e.g. over the last month Domino’s (DMP) -23%, Magellan (MFG) -8%, Challenger (CGF) -7%, QBE Insurance (QBE) -9% and Telstra (TLS) -6%.
MSCI World Index Quarterly Chart
US Stocks
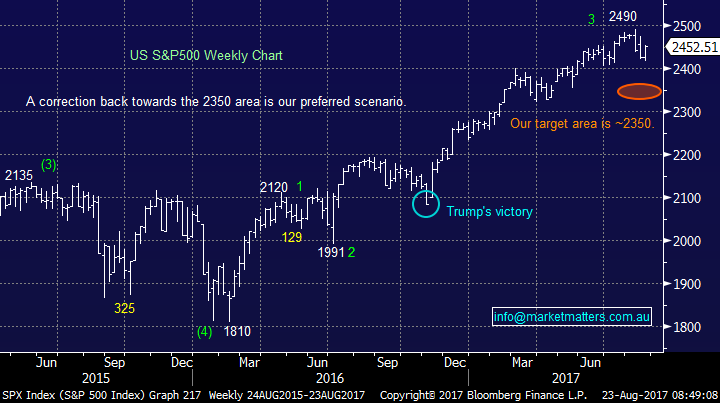
US equities enjoyed a very strong night with the S&P500 gaining 1% which leads to a “tweak” in our current view for US stocks. We still see the 2350 area being tested but another test of ~2500 first would not surprise i.e. a similar style of topping pattern / correction to April-July 2016.
We remain bearish US stocks targeting a correction of ~5% over coming weeks as sell signals continue to slowly emerge.
US S&P500 Weekly Chart
Yesterday “the big Australian” BHP reported a 5-fold increase in underlying profit with efficient cost cutting and strong commodity prices likely to generate an impressive ~$10bn of free cash flow in 2018. In a very similar manner to Fortescue (FMG) they missed expectations in terms of earnings (~3%) plus the dividend was 1c below consensus at 84c but the hidden message pleased the market. The planned sell off of shale assets was interpreted that BHP is actually listening to shareholders which is always taken positively plus debt reduction rarely goes down badly with the market. Lying in bed last night thinking (as you do) about the BHP result yesterday and the numbers they released, a few things became apparent.
They’re producing a huge amount of cash and that is likely to continue. Last year they reduced debt by $9bn plus they paid out near $4bn in dividends. Net debt now sits at $16bn and they have guided to a target range of $10-$15bn – so, still some way to go but not the extend of reduction we saw in FY17. They also flagged asset sales headlined by US Shale which should yield somewhere between $6-$10bn, however there is more like $10-$18bn of potential sales on the cards, so clearly asset sales could get net debt into their targeted range opening up the likelihood of a ‘lot’ bigger dividends in the years ahead – particularly with capital expenditure (capex) capped for the next 3 years.
As mentioned yesterday the forward-thinking message that will be delivered by the incoming chairman on 1st September may have a large impact on the BHP share price for the balance of 2017, however we’d expect the message to be fairly upbeat.
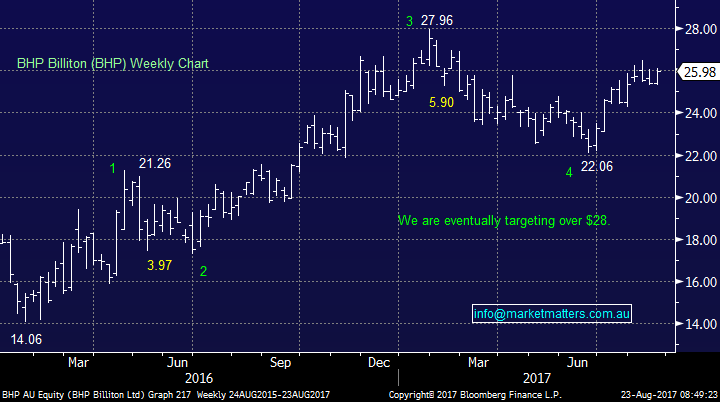
We remain bullish BHP with a target ~$28.50 / 9% higher.
BHP Billiton (BHP) Weekly Chart
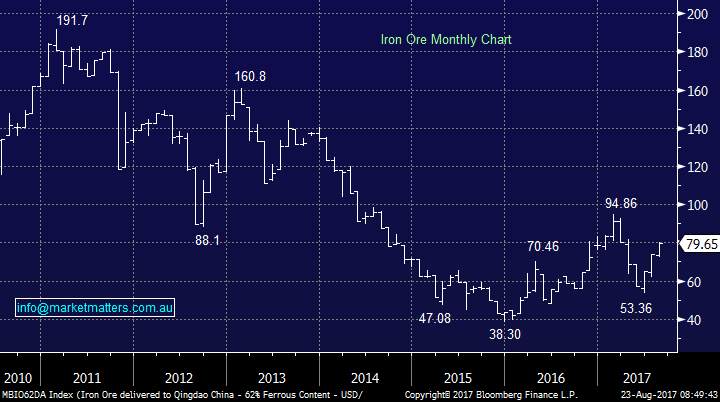
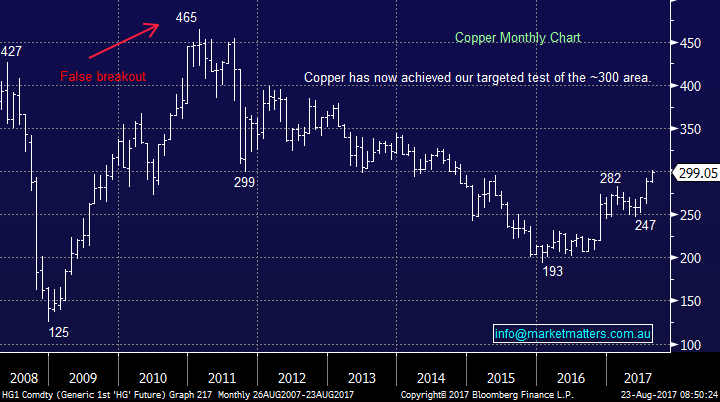
The fundamental picture looks very good for the miners while the price of iron ore and copper for example remain strong - most local resource stocks have simply become printing presses BUT as we said yesterday there are obvious risks chasing the sector for yield. Iron ore has doubled since early 2016 and copper is 50% higher from recent lows - any pullback in these currently strong markets will be a clear negative to the Australian resource sector and remember, miners are price takers, not price makers.
BHP has advanced strongly since early 2016, in-line with global stocks and both iron ore and copper. Not surprisingly the correlation between BHP and the copper / iron ore price is significant hence any increase in exposure to resources equates to an expectation that commodities will add to their gains since early 2016.
We remain comfortably long BHP but see no reason to increase our holding into current strength, particularly given our exposure sits at 7.5% of the growth portfolio.
Iron Ore Monthly Chart
Copper Monthly Chart
Conclusion (s)
We like both our BHP and AWC as our exposure to the local resources sector but see no reason add to them at current levels. Alumina reports tomorrow.
This however does not mean we will not buy other resource stocks in 2017.
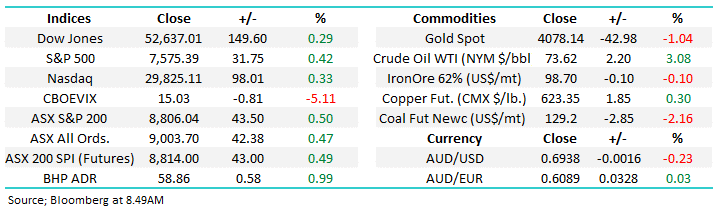
Overnight Market Matters Wrap
· The US closed in positive territory as political tensions ease and investors anticipate the reform tax to be in place.
· Corporate earnings today are ATM, BAP, CCL, CHC, CWY, HSO, IAG, IDR, ISD, QUB, SGR, SRV, SRX, TGR, TRS, VOC & WOW.
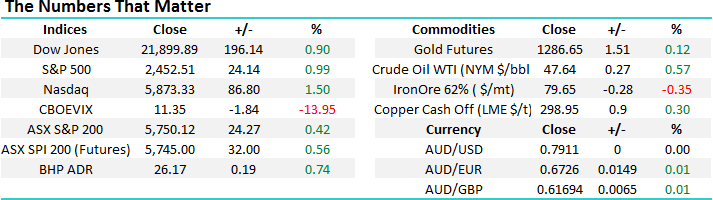
· The September SPI Futures is indicating the ASX 200 to open 30 points higher, towards the 5780 level this morning.
Disclosure
Market Matters may hold stocks mentioned in this report. Subscribers can view a full list of holdings on the website by clicking here. Positions are updated each Friday.
Disclaimer
All figures contained from sources believed to be accurate. Market Matters does not make any representation of warranty as to the accuracy of the figures and disclaims any liability resulting from any inaccuracy. Prices as at 23/08/2017. 8.00AM.
Reports and other documents published on this website and email (‘Reports’) are authored by Market Matters and the reports represent the views of Market Matters. The MarketMatters Report is based on technical analysis of companies, commodities and the market in general. Technical analysis focuses on interpreting charts and other data to determine what the market sentiment about a particular financial product is, or will be. Unlike fundamental analysis, it does not involve a detailed review of the company’s financial position.
The Reports contain general, as opposed to personal, advice. That means they are prepared for multiple distributions without consideration of your investment objectives, financial situation and needs (‘Personal Circumstances’). Accordingly, any advice given is not a recommendation that a particular course of action is suitable for you and the advice is therefore not to be acted on as investment advice. You must assess whether or not any advice is appropriate for your Personal Circumstances before making any investment decisions. You can either make this assessment yourself, or if you require a personal recommendation, you can seek the assistance of a financial advisor. Market Matters or its author(s) accepts no responsibility for any losses or damages resulting from decisions made from or because of information within this publication. Investing and trading in financial products are always risky, so you should do your own research before buying or selling a financial product.
The Reports are published by Market Matters in good faith based on the facts known to it at the time of their preparation and do not purport to contain all relevant information with respect to the financial products to which they relate. Although the Reports are based on information obtained from sources believed to be reliable, Market Matters does not make any representation or warranty that they are accurate, complete or up to date and Market Matters accepts no obligation to correct or update the information or opinions in the Reports.
If you rely on a Report, you do so at your own risk. Any projections are estimates only and may not be realised in the future. Except to the extent that liability under any law cannot be excluded, Market Matters disclaims liability for all loss or damage arising as a result of any opinion, advice, recommendation, representation or information expressly or impliedly published in or in relation to this report notwithstanding any error or omission including negligence.
To unsubscribe. Click Here