6 trends catching our attention (CBA, WES, WOW, AWC, BHP, TLS, HSO)
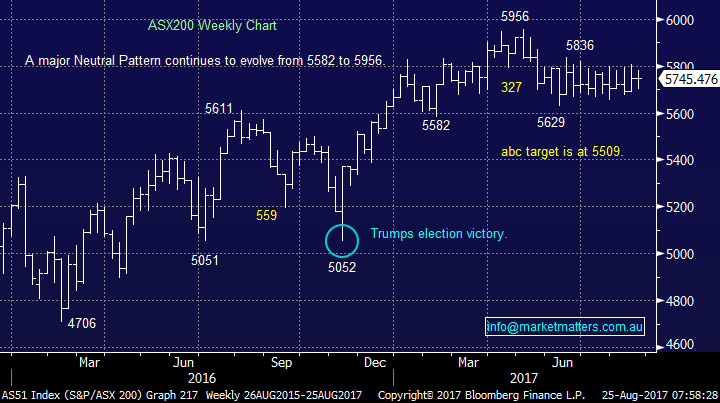
The ASX200 had a relatively quiet day and looks destined to enter its 15th consecutive week range bound between 5629 and 5836. We’ve been expecting a break out for a few weeks but alas the market remains comfortable around this 5700-area, we wouldn’t actually be surprised if the breakout when it finally occurs fails and were back at 5700 within a few days, that would certainly be “the path of most pain” for the trend following traders.
In contrast to the index on the stock level the volatility was yet again huge with 4 stocks in the ASX200 moving over 5% and a number of other scenarios unfolding that caught our eye. Today we are going to take a look at 6 specific things that grabbed our attention during yesterday’s trading session.
ASX200 Weekly Chart
US Stocks
US equities slipped around 0.2% overnight as the market moved into “wait and see mode” ahead of Jackson Hole where we are likely to receive some insight from Fed officials on their feelings for the US economy moving forward, obviously including future interest rates increases.
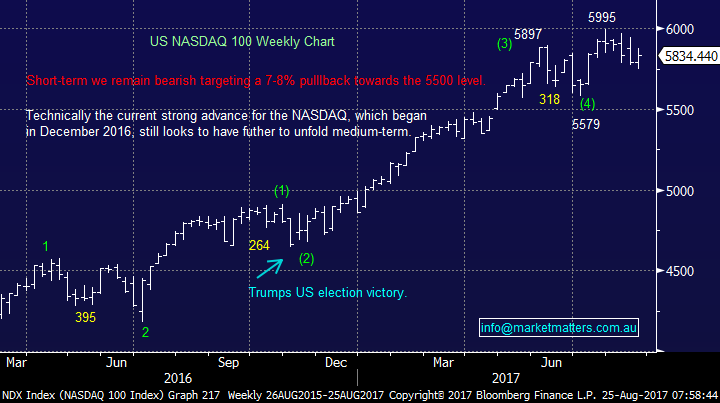
We remain mildly bearish US stocks targeting a correction of ~5% over coming weeks as sell signals continue to slowly emerge.
US NASDAQ Weekly Chart
1. Banks
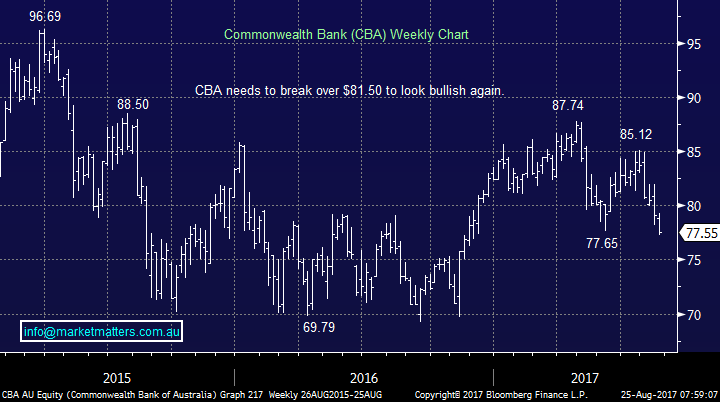
The banks feel heavy at present but they actually remain up 2.6% for the last month and only CBA is noticeably lower over this timeframe, and it paid a $2.30 fully franked dividend 9 days ago. We already own CBA in both our Platinum and Income Portfolios but if it continues to drift lower towards the $75 area we will be tempted to increase this exposure in at least one portfolio.
Commonwealth Bank (CBA) Weekly Chart
2. Switch from Woolworths (WOW) to Wesfarmers (WES)
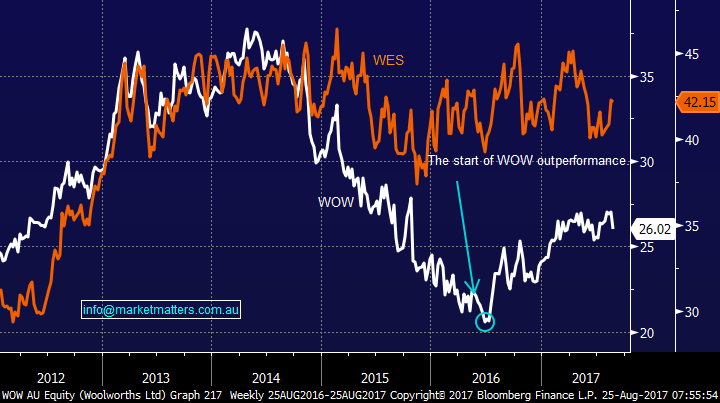
Since early 2016 many investors have been looking to pick the bottom in WOW and often selling WES to fund the purchase – not many people want to increase their overall exposure to the sector with Amazon coming. Over this time WOW has rallied ~35% while WES has basically tracked sideways. We think investors are starting to switch back, there was a 5% differential in performance yesterday alone following this week’s poor result from WOW.
We are long WES from under $41 plus we’ve enjoyed a $1.20 fully franked dividend. We will take a healthy profit if this switch unfolds and pushes WES towards $45.
Woolworths (WOW) v Wesfarmers (WES) Chart
3. Resources simply remain on fire
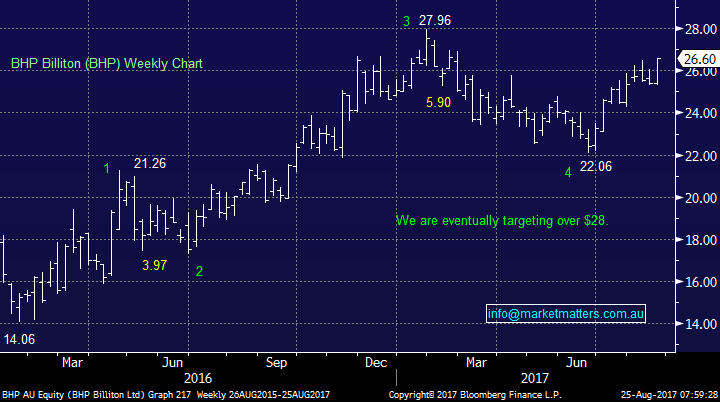
When you’re hot you’re hot! The resources are the place to be at present as high commodity prices have led to positive capital management from most major companies within the sector. Investors often have a short memory, it was only late June that the sector was under significant pressure and many were calling the end to the 1 ½ year strong rally. BHP for example has experienced a 18.7% and 21.1% retracement since mid-2016, illustrating perfectly that these are stocks you sell when the bulk of the market becomes bullish.
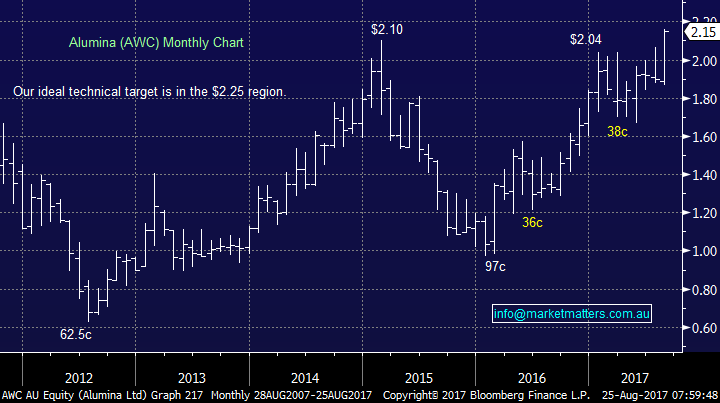
We remain very happy with our BHJP and AWC positions with targets of ~$28.50 and $2.25 respectively, but note we will have no hesitation in taking profit around these targets.
BHP Billiton (BHP) Weekly Chart
Alumina (AWC) Monthly Chart
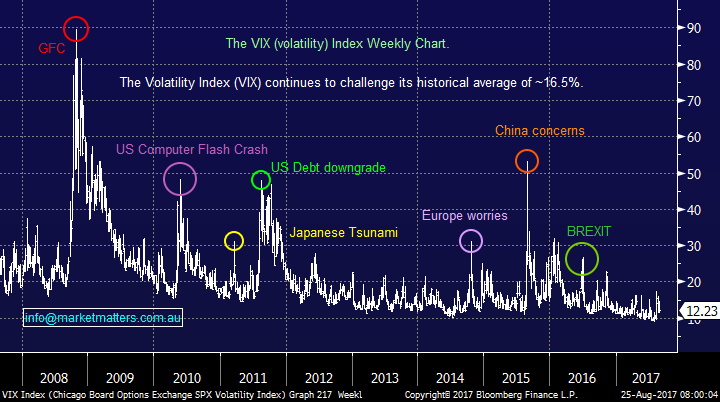
4. Volatility
North Korea is already a distant memory and Donald Trump appears to be able to do / say anything and stocks will basically ignore him hence volatility has fallen around 30% in the last 3 weeks. This fall was very evident in the local market yesterday, a potentially dangerous move with the ASX200 approaching its 15th consecutive week between 5629 and 5836. Simply, the measure of volatility is understating the current likelihood of a big move in a given direction. In the portfolio’s we manage that have an option overlay (sold calls & sold puts) we took these positions off yesterday, and will look to re-sell when volatility ticks higher – which it will at some point.
VIX “Fear Index” Weekly Chart
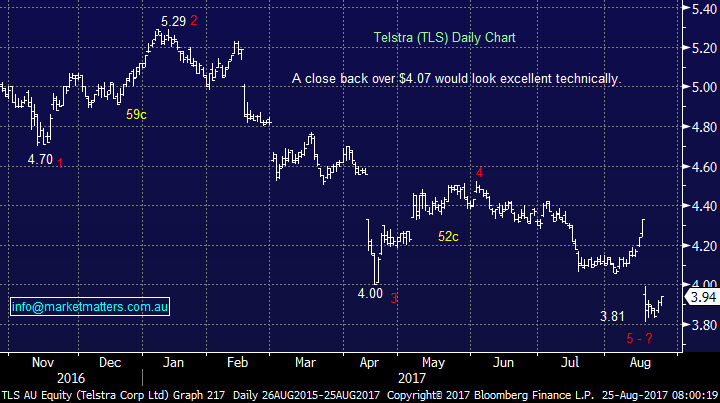
5. Telco’s
We purchased Telstra at $3.85 last week when many investors simply threw in the towel and its currently looking reasonably good although there is clearly a long journey ahead. In the short-term we are looking forward to a 15.5c fully franked dividend next week. Importantly we only allocated 5% of the MM Growth Portfolio to TLS at $3.85 allowing room to average ~$3.60 if it trades there.
Technically TLS will look excellent back over $4.07.
Telstra (TLS) Daily Chart
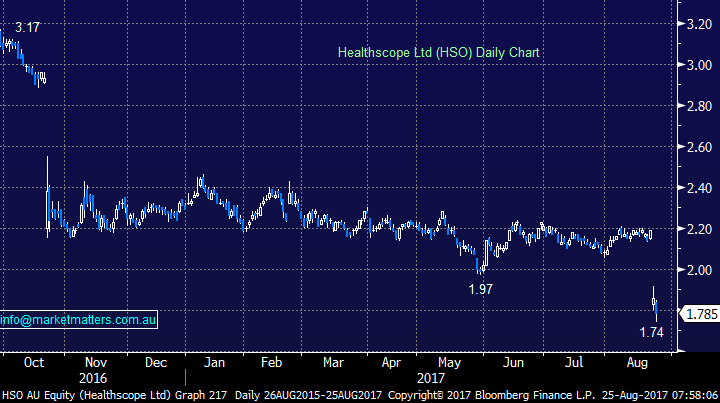
6 Healthscope (HSO) $1.85
We purchased HSO yesterday at $1.77, over 23% below where we sold it in February. We outlined the reasons we like the stock down here in yesterday’s morning report, now it’s time to sit back and see if the market agrees!
We are currently bullish HSO under $1.80.
Healthscope (HSO) Daily Chart
Conclusion (s)
The ASX200 is certainly not moving as one, investors need to remain very open-minded as stocks and sectors are pulling in very different directions. Some examples over the last month:
Winners – Flight Centre +11%, IOOF Holdings (IFL) +12%, Origin Energy (ORG) +11%, Alumina (AWC) +12.6% and Fortescue (FMG) +17.6%.
Losers – Domino’s (DMP) -25%, Magellan (MFG) -9.4%, Healthscope (HSO) -15.4%, Vocus (VOC) -20.6% and QBE Insurance (QBE) -9.8%
Overnight Market Matters Wrap
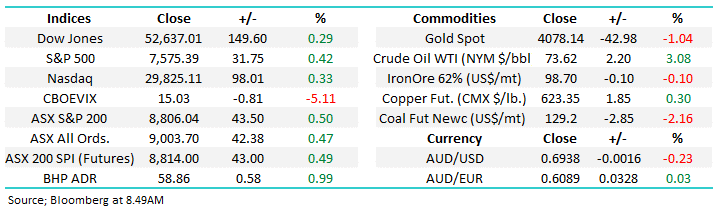
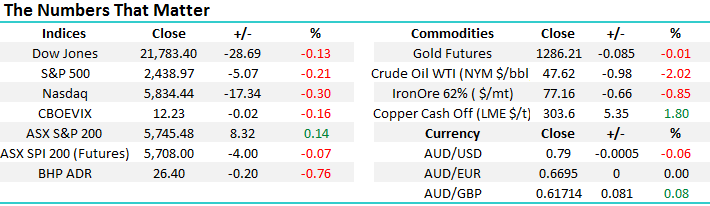
· The US closed with little change towards the downside as investors sit in the sideline for comments from US Fed Chair, Janet Yellen currently at Jackson Hole.
· Iron Ore was lower, down 0.85%, while crude oil gave back the previous session’s gains and more overnight.
· Friday’s corporate earnings are AHG, AWE, FLT, MPL, MYX, QAN, REG, SGM &SHV.
· The September SPI Futures is indicating the ASX 200 to open marginally lower, testing the 5745 area this morning.
Disclosure
Market Matters may hold stocks mentioned in this report. Subscribers can view a full list of holdings on the website by clicking here. Positions are updated each Friday.
Disclaimer
All figures contained from sources believed to be accurate. Market Matters does not make any representation of warranty as to the accuracy of the figures and disclaims any liability resulting from any inaccuracy. Prices as at 25/08/2017. 8.00AM.
Reports and other documents published on this website and email (‘Reports’) are authored by Market Matters and the reports represent the views of Market Matters. The MarketMatters Report is based on technical analysis of companies, commodities and the market in general. Technical analysis focuses on interpreting charts and other data to determine what the market sentiment about a particular financial product is, or will be. Unlike fundamental analysis, it does not involve a detailed review of the company’s financial position.
The Reports contain general, as opposed to personal, advice. That means they are prepared for multiple distributions without consideration of your investment objectives, financial situation and needs (‘Personal Circumstances’). Accordingly, any advice given is not a recommendation that a particular course of action is suitable for you and the advice is therefore not to be acted on as investment advice. You must assess whether or not any advice is appropriate for your Personal Circumstances before making any investment decisions. You can either make this assessment yourself, or if you require a personal recommendation, you can seek the assistance of a financial advisor. Market Matters or its author(s) accepts no responsibility for any losses or damages resulting from decisions made from or because of information within this publication. Investing and trading in financial products are always risky, so you should do your own research before buying or selling a financial product.
The Reports are published by Market Matters in good faith based on the facts known to it at the time of their preparation and do not purport to contain all relevant information with respect to the financial products to which they relate. Although the Reports are based on information obtained from sources believed to be reliable, Market Matters does not make any representation or warranty that they are accurate, complete or up to date and Market Matters accepts no obligation to correct or update the information or opinions in the Reports.
If you rely on a Report, you do so at your own risk. Any projections are estimates only and may not be realised in the future. Except to the extent that liability under any law cannot be excluded, Market Matters disclaims liability for all loss or damage arising as a result of any opinion, advice, recommendation, representation or information expressly or impliedly published in or in relation to this report notwithstanding any error or omission including negligence.
To unsubscribe. Click Here