The Australian Stock Market feels Short / Underweight
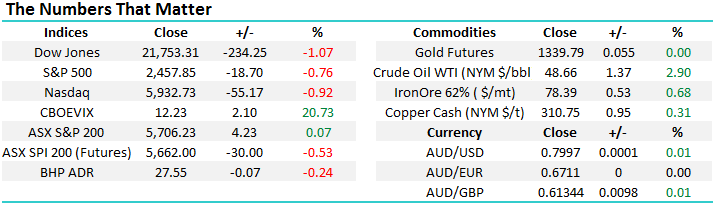
The story remains the same, it’s just almost 3-months old - the ASX200 gets sold down pretty aggressively until around 11am and then it rallies all day – now we’ve said it for a second time an afternoon capitulation is probably close at hand! If we consider the geo-political noise that greets local investors most mornings it’s not surprising that the sellers take control for the first hour but fund managers continue to buy any early weakness, yesterday’s initial 35-point drop was steadily bought and we finally closed up 4-points on the day – Alex on the desk made a very good point yesterday saying that “you can’t be short late mornings until further notice” – the trends are just too clear intra-day however as suggested above, a reasonable size sell off into the close does feel like it’s just around the corner.
On this subject, it’s important to remember the numbers that came out of the recent Bank of America (BOFA) Merrill Lynch’s Fund Manager Survey:
1. 46% of fund managers see US equities as overvalued, the largest number ever.
2. Only 33% of these professional investors believe company profits will rise, the lowest since November2015.
3. Global investors average cash holdings are 4.9%, above the 10-year average of 4.5%.
4. European investors are holding 5.3% in cash, the highest level since 2003.
When we take the above 4 points into consideration it’s easy to understand why there are plenty of sellers on strong days and conversely buyers emerge on days of weakness due to raised cash levels and therefore we find ourselves in a very defined trading range. As you’d know, we think the range breaks to the downside however if it does, we want cash available to buy weakness given the above stats.
ASX200 Daily Chart
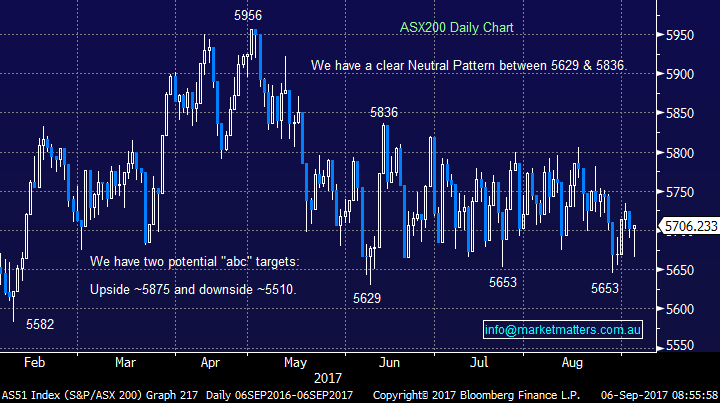
Professional investors don’t want to be caught too exposed to stocks if conflict breaks out with North Korea, especially as they certainly cannot claim it came as a surprise. Furthermore, we all know most global indices are close to all-time highs and as you can see from the BOFA survey fund managers believe stocks are overpriced.
The point we are attempting to make is that if we see a decent spike down on North Korea the likelihood is the market will be higher by Christmas as many fund managers have already done most of their selling and are now buyers of weakness.
Secondly any fall might not be as deep as many, including ourselves, have been anticipating perhaps only reaching say 5550, or even just around the psychological 5600 area.
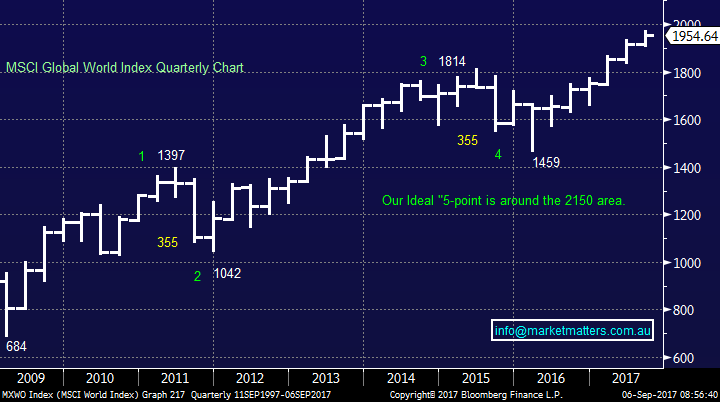
MSCI Global World Index Quarterly Chart
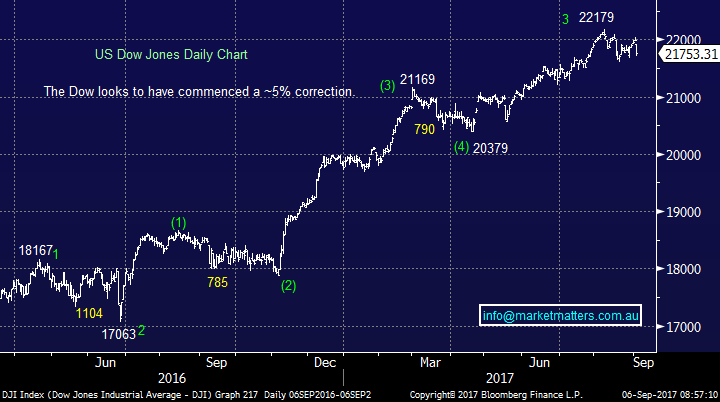
US Stocks
US equities tumbled overnight on renewed North Korea fears with the Dow falling 234-points / over 1%.
There is no change to our short-term outlook for US stocks where are targeting a ~5% correction i.e. a further 700-points for the Dow.
US Dow Jones Daily Chart
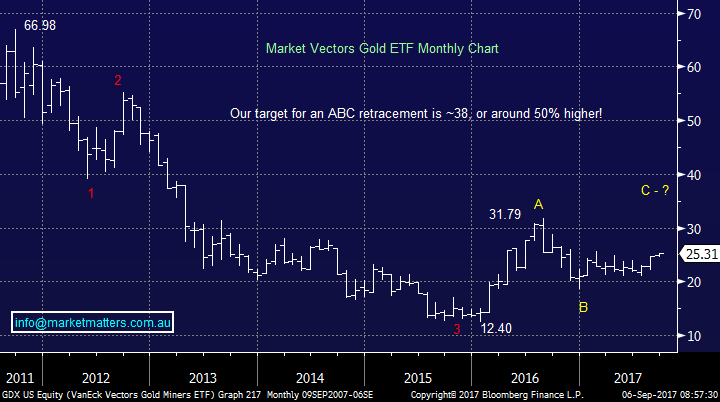
As we attempt to envisage how markets will unfold over the coming weeks / months the gold ETF chart which we have been following closely keeps flashing short-term warning signals into our subconscious. Last night the gold ETF rallied over 2% to its highest level since February. However, we are targeting significantly higher levels which will probably require one, or both of the below to unfold:
1. North Korea conflict does escalate leading to panic by stocks and a flight to safety assets i.e. bonds and gold.
2. The US economy will not improve as economists are expecting leading to a lower $US and bond yields i.e. no rate rises.
Vaneck Vectors Gold ETF (GDX) Monthly Chart
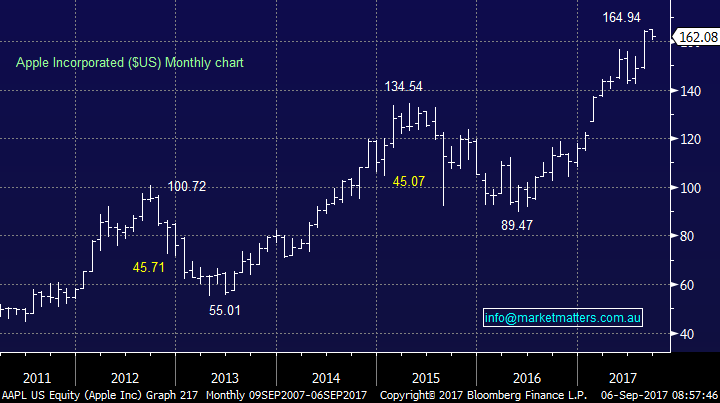
Two interesting stories caught our eye this morning on Bloomberg news, firstly APPLE are again returning to the bond market to borrow money to buy back their own shares. APPLE shares have rallied 50% in 2017 and the directors have decided it’s a good time to borrow money to buy their stock. We all know what an amazing technology company APPLE is but they are not necessarily great investors / traders, although we of course acknowledge that interest rates are currently very low on an historical basis.
The US stocks have rallied phenomenally since the GFC with company buybacks one of the main buyers / drivers, at MM we believe the music will stop playing at least for a while in the coming months / year and the average price of many of these such buybacks will look poor.
APPLE Inc (US) Monthly Chart
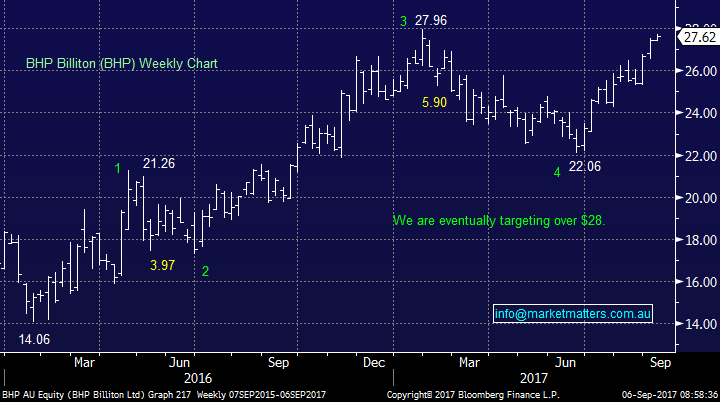
Secondly, China Investment Corp. (CIC) last night sold a significant portion of its holding in Canadian miner Teck Resources sending the Vancouver based company down 6.7%. Taking a decent profit after a stock has rallied 33% in one year makes sense on an investment level, they have simply locked in some profit on part of their holding but it reminds us of BHP / RIO this year both of whom have rallied significantly since early 2016 and are currently flavour of the month.
While we see a little further upside from our large cap. mining stocks, we do intend to sell this strength, similar to CIC.
BHP Billiton (BHP) Weekly Chart
Conclusion (s)
Remain open-minded and flexible the current volatility in share markets is likely to increase providing excellent opportunities for those who are ready and informed.
We are conscious of our cash levels, and believe some better buying opportunities will prevail at lower levels – therefore we may look to sell a holding or two to generate cash
Overnight Market Matters Wrap
· The US equity markets started their week lower overnight as geopolitical tensions continue and 2 US Fed officials noted they would not like to rush with any further interest rate hikes in the near term.
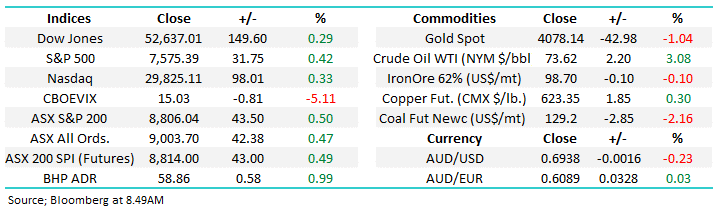
· The Aussie Battler (AUD) continues to climb above the US80c level, after comments from the RBA of the strength of Australia’s economic growth.
· The Financial sector linked with the US such as Macquarie Group (MQG) is expected to underperform after two US Fed policy makers suggested recent rate rises may have hurt the economy and that further tightening should only occur when inflation picks up.
· The September SPI Futures is indicating the ASX 200 to open 27 points weaker this morning, towards the 5680 area.
Disclosure
Market Matters may hold stocks mentioned in this report. Subscribers can view a full list of holdings on the website by clicking here. Positions are updated each Friday.
Disclaimer
All figures contained from sources believed to be accurate. Market Matters does not make any representation of warranty as to the accuracy of the figures and disclaims any liability resulting from any inaccuracy. Prices as at 06/09/2017. 8.00AM.
Reports and other documents published on this website and email (‘Reports’) are authored by Market Matters and the reports represent the views of Market Matters. The MarketMatters Report is based on technical analysis of companies, commodities and the market in general. Technical analysis focuses on interpreting charts and other data to determine what the market sentiment about a particular financial product is, or will be. Unlike fundamental analysis, it does not involve a detailed review of the company’s financial position.
The Reports contain general, as opposed to personal, advice. That means they are prepared for multiple distributions without consideration of your investment objectives, financial situation and needs (‘Personal Circumstances’). Accordingly, any advice given is not a recommendation that a particular course of action is suitable for you and the advice is therefore not to be acted on as investment advice. You must assess whether or not any advice is appropriate for your Personal Circumstances before making any investment decisions. You can either make this assessment yourself, or if you require a personal recommendation, you can seek the assistance of a financial advisor. Market Matters or its author(s) accepts no responsibility for any losses or damages resulting from decisions made from or because of information within this publication. Investing and trading in financial products are always risky, so you should do your own research before buying or selling a financial product.
The Reports are published by Market Matters in good faith based on the facts known to it at the time of their preparation and do not purport to contain all relevant information with respect to the financial products to which they relate. Although the Reports are based on information obtained from sources believed to be reliable, Market Matters does not make any representation or warranty that they are accurate, complete or up to date and Market Matters accepts no obligation to correct or update the information or opinions in the Reports.
If you rely on a Report, you do so at your own risk. Any projections are estimates only and may not be realised in the future. Except to the extent that liability under any law cannot be excluded, Market Matters disclaims liability for all loss or damage arising as a result of any opinion, advice, recommendation, representation or information expressly or impliedly published in or in relation to this report notwithstanding any error or omission including negligence.
To unsubscribe. Click Here