Subscriber’s Questions
The markets have received limited fresh news over the weekend, with Donald Trump unfortunately preoccupied with Hurricane Irma as it descends on Florida – all our thoughts and prayers are with those whose lives are being impacted by this huge category 4 storm. Trying to comprehend an amazing ~6 million people were forced to evacuate their homes, incredibly the equivalent to a quarter of our entire population!
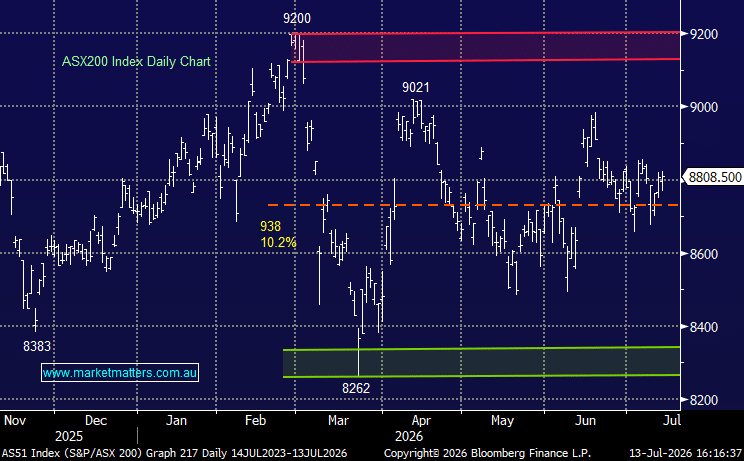
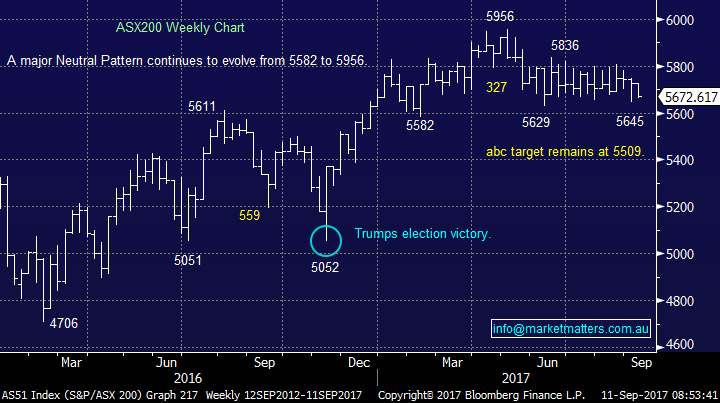
The ASX200 closed on Friday only ~1% above its major long-term support and with BHP, the recent backbone of our market falling 2.3% on Friday night in the US, a break to the downside feels like a now or never scenario. We remain short-term bearish stocks targeting ~5525 for the local market, approximately 2.5% lower.
ASX200 Weekly Chart
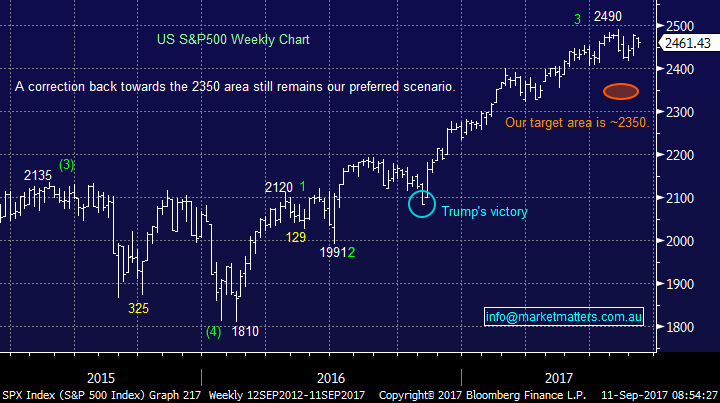
With regard to US stocks, we still anticipate an eventual pullback towards the 2350 area for the S&P500, or around 4.5% from Friday’s closing level.
US S&P500 Weekly Chart
Question 1
“What are your thoughts on MQG?” Thanks Patrick S.
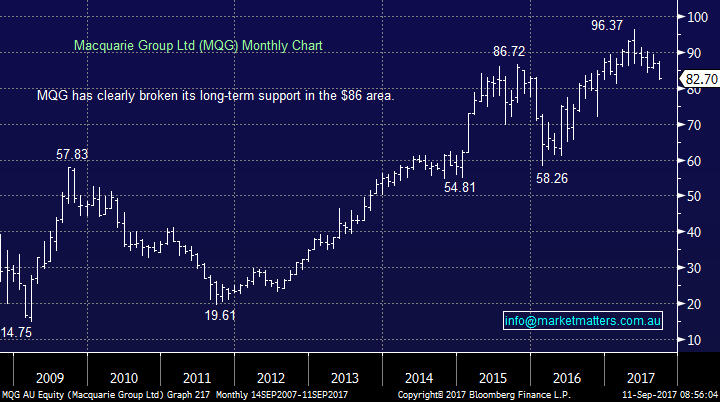
Morning Patrick, a timely question given Macquarie Group (MQG) has just released an outlook update this morning saying that ‘we continue to expect the Groups result for FY18 to be broadly in-line with FY17’ – which is what they’d previously stated, however the market was positioned for some growth (i.e., thinking MQG was guiding conservatively). This is a stock most analysts like at the moment, but it’s been under pressure like both the banking and diversified financial sectors. MQG has recently corrected 14.2%, compared to say the banking sector at 7.2% and the financial sector at 7.5%, this is a probably more an illustration that investors were long and grabbing some profits, as opposed to issues within the company itself – however, the substantial fall in the $US during 2017 is working against MQG, who generate ~30% of their earnings from the US.
A test of the psychological $80 support in the next 1-2 weeks would definitely not surprise, but more importantly we prefer Challenger (CGF) and IOOF Holdings (IFL) within the sector.
Macquarie Group (MQG) Monthly Chart
Question 2
“Hi Team, Worried about SUN, QBE, GMA, CBA, and now BOQ starting to slide
Also TLS, HVN. All in ‘big’ negative. Should I sell and salvage those whatever I can?
I realise that I bought those too high and did not sell when I should have.” Kind Regards Frank W.
Hi Frank, an excellent but very broad question covering 5-7 stocks. There’s a saying in trading which you and your question has nailed perfectly!
“Look after your losses and the profits will look after themselves” – unsure of the initial source.
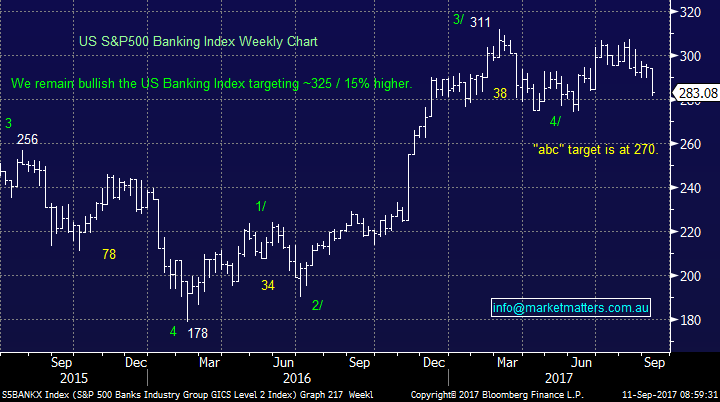
The first five stocks you have mentioned are in the financial space, which we have been discussing in detail recently with our view probably best illustrated by the US banking sector, which has actually underperformed are own over recent times.
The important points around the MM view are:
1. We remain bullish both US / local banks from current levels in 2017, but a further 4-5% drop would not surprise and we are looking to increase our exposure if such a retracement unfolds.
2. Hence we are accumulators of financials into weakness, as opposed to sellers at current levels. Please note; a number of these stocks have recently traded ex-dividend putting added pressure on the share price
3. QBE has become our least preferred stock on the list following their poor result but they are currently being hit from both barrels with regard to a weakening $US and drifting bond US yields. We remain bullish bond yields at least, which should help QBE over the rest of 2017 hence we will look for a better opportunity to exit.
4. We are buyers of both HVN and TLS at lower levels so again would not sell here, but we are sellers of TLS closer to $4 if it bounces that high.
US S&P500 Banking Sector Weekly Chart
Question 3
“Dear MM, would you mind going through the rationale of taking up the MCP Master Income Trust, given that the target rate/distribution is only about 4+% and that you have also indicated some hybrids are giving us a yield of about 6%?” -Thanks, and best regards Victor K.
Hi Victor, when assessing all investments, it pretty much comes down to a consideration between risk and return. To have a handle on this, we need to understand the underlying exposures to make a call on the risk side of the equation. With a Hybrid, the yields are higher because they are reflective of a higher risk security, which stems from the conditions within the structure of the securities (convertibility – non viability etc.). We wrote a review of these securities in last week’s income report – click here. The MCP Income Trust offers different exposures and is targeting a more modest return (MXT is targeting a minimum yield equal to the RBA cash rate plus 3.25% per annum which is currently around 4.75%, net of fees and costs. Distributions will be paid monthly). In terms of MCP, this is an exposure to corporate lending – the underlying investments are secured loans over Australian corporates rather than listed or Over the Counter debt securities. It’s a diversified exposure (50 credits loan initially – moving to 75-100).
Here’s a reasonable chart which outlines the risk / return spectrum .
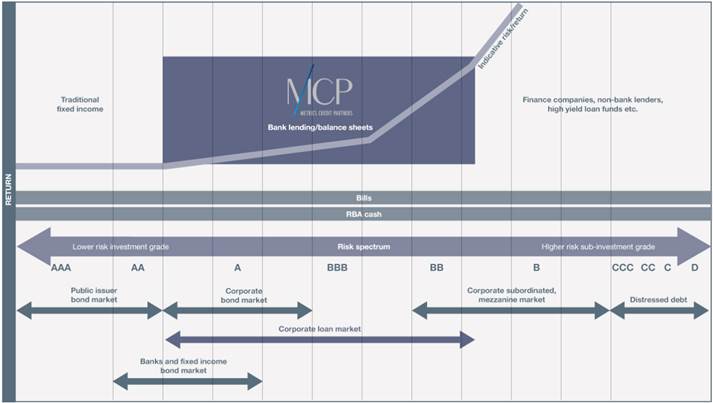
You are right, the MCP offering is a lower return security than others out there, however is seems to us, that the risks are lower as well. For the MM Income Portfolio, a combination of equities, hybrids, corporate loans & cash is a sensible blend for us. As always, each subscriber must consider if this is relevant for them.
Question 4
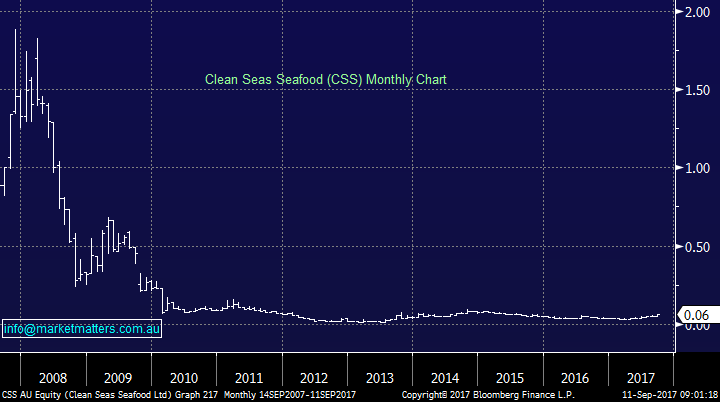
“Just wondering whether Market Matters is able to provide any commentary on Clean Seas Ltd (CSS). I am particular keen on the Sector and reinvested in CSS back in July 2017 after moving out of the stock in 2015. CSS recently released their half year results and released an Investor Presentation on 5/9/17 which indicates that CSS is delivering on their strategy, is turning the corner and there appears to be lots of blue sky ahead. Your thoughts would be greatly appreciated. “ Regards, Ian P.
Hi Ian, CSS has clearly been on a rollercoaster ride since the GFC, although from a percentage point of view it’s had a great 2017. Like yourself, we love the idea of sustainable healthy food and this commercial kingfish producer clearly ticks this box, but the question is can it be financially viable / exciting?
As you say, the recent results have been solid and we’ve been impressed with the management’s turnaround of CSS. Importantly if they hit next year’s targets. they are trading at a meaningful discount to other market players - Tassel Group (TGR) and Huon Agriculture (HUO).
We like CSS at current levels as speculative play which appears to have limited downside.
Clean Seas Seafood (CSS) Monthly Chart
Question 5
“Greetings Team, could you explain how you calculate the current yield for a stock when including Franking Credits and Dividends paid. Also: Any thoughts on ANZ CAPITAL NOTES 5 please.” - Cheers, Michael H.
Assuming that the company tax rate is 30% and that the dividend is fully franked, the formula is: Dividend Yield divided by 0.7.
So, if the dividend yield is 4%,
The grossed up yield is: / 0.7 = 5.71%
If the dividend is partly franked the easiest way is to split the dividend into two parts: The part that is unfranked and the part that is franked.
For example, if the dividend is only 50% franked, your calculation would be:
(4 x 0.5) + (4 X 0.5 /0.7) = 4.85%
Question 6
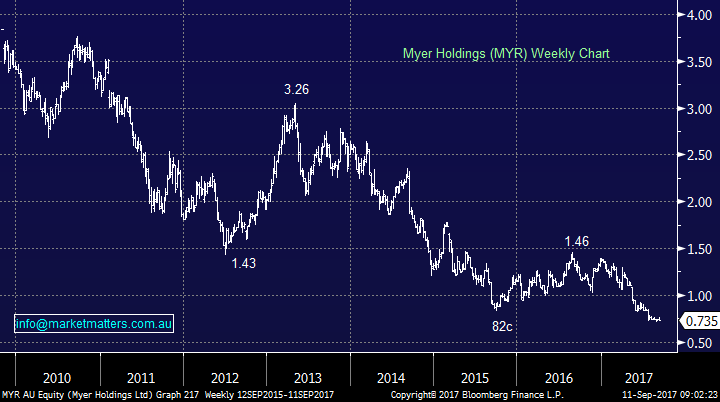
“Hi! unfortunately I still have a few MYR shares, purchased $1.80 some time back, what are your thoughts? is a takeover a possibility or should I dump now before Amazon strikes and their worth nothing, “- Tom A.
Hi Tom, a very tricky question, but obviously we can only look at MYR today as opposed to what you should do with shares you have previously purchased at higher levels. The only definable reason we can see to buy MYR is if you believe Solomon Lew will mount a full takeover, following his 10.8% purchase way up at $1.15 back in March. He’s losing big money at present and may of course decide to cut his losses, it’s definitely not just a question of if / when he will try and mount a full takeover. Obviously, he may of course launch a full takeover, but this is pure guess work.
We believe this is one for the traders and not the investors, you can buy around the current 73c area but we would be out under 70c, overall not for us at this point in time.
Myer Holdings (MYR) Weekly Chart
Question 7
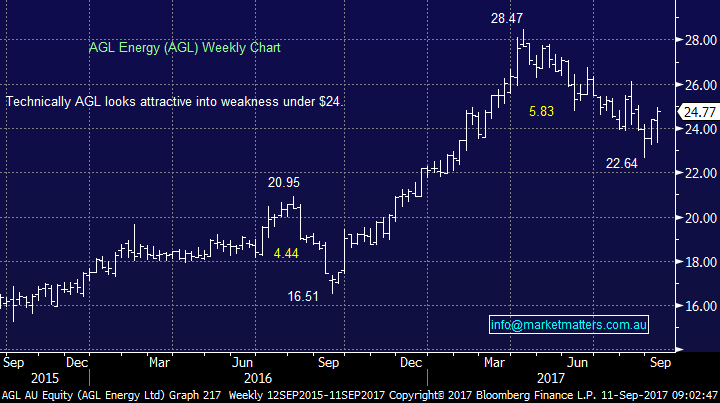
“I have a trade on AGL so I hope it continues to improve. Today is one of the best days I have had in the market. I hope the momentum continues as I am holding all my stocks.” – Barry F.
Hi Barry, great to hear, we agree with your position in AGL Energy which as a stock now looks healthy following its 20% correction. The current yield is ok, but not exciting if global interest rates again start to rally.
We like AGL around $24 technically targeting an initial test of $26. This is not a stock on our investment radar at present.
AGL Energy (AGL) Weekly Chart
Overnight Market Matters Wrap
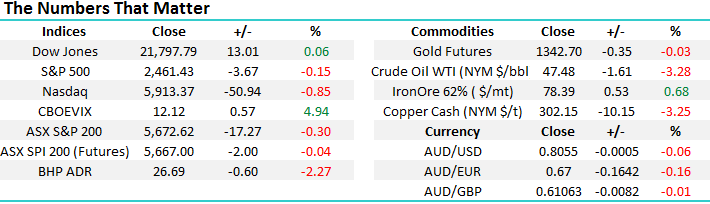
· The US closed mixed overnight, with both the Dow and S&P 500 ending Friday’s session with little change, while the NASDAQ 100 underperformed the most as investors brace for the impact from Hurricane Irma currently on its US path.
· On the commodities side, oil slid 3.28% lower as the hurricane pressured to shut the refineries, leading BHP in the US to close an equivalent pf 2.27% lower from Australia’s previous close and will likely underperform the broader market today.
· The September SPI Futures is indicating the ASX 200 to open with little change this morning, hovering near the 5670 area, however upside risk may be seen today as we note the US futures this morning being higher.
Disclosure
Market Matters may hold stocks mentioned in this report. Subscribers can view a full list of holdings on the website by clicking here. Positions are updated each Friday.
Disclaimer
All figures contained from sources believed to be accurate. Market Matters does not make any representation of warranty as to the accuracy of the figures and disclaims any liability resulting from any inaccuracy. Prices as at 11/09/2017. 8.00AM.
Reports and other documents published on this website and email (‘Reports’) are authored by Market Matters and the reports represent the views of Market Matters. The MarketMatters Report is based on technical analysis of companies, commodities and the market in general. Technical analysis focuses on interpreting charts and other data to determine what the market sentiment about a particular financial product is, or will be. Unlike fundamental analysis, it does not involve a detailed review of the company’s financial position.
The Reports contain general, as opposed to personal, advice. That means they are prepared for multiple distributions without consideration of your investment objectives, financial situation and needs (‘Personal Circumstances’). Accordingly, any advice given is not a recommendation that a particular course of action is suitable for you and the advice is therefore not to be acted on as investment advice. You must assess whether or not any advice is appropriate for your Personal Circumstances before making any investment decisions. You can either make this assessment yourself, or if you require a personal recommendation, you can seek the assistance of a financial advisor. Market Matters or its author(s) accepts no responsibility for any losses or damages resulting from decisions made from or because of information within this publication. Investing and trading in financial products are always risky, so you should do your own research before buying or selling a financial product.
The Reports are published by Market Matters in good faith based on the facts known to it at the time of their preparation and do not purport to contain all relevant information with respect to the financial products to which they relate. Although the Reports are based on information obtained from sources believed to be reliable, Market Matters does not make any representation or warranty that they are accurate, complete or up to date and Market Matters accepts no obligation to correct or update the information or opinions in the Reports.
If you rely on a Report, you do so at your own risk. Any projections are estimates only and may not be realised in the future. Except to the extent that liability under any law cannot be excluded, Market Matters disclaims liability for all loss or damage arising as a result of any opinion, advice, recommendation, representation or information expressly or impliedly published in or in relation to this report notwithstanding any error or omission including negligence.
To unsubscribe. Click Here