How long will the Switch to Value Stocks from Growth last? (ORG, STO, WPL)
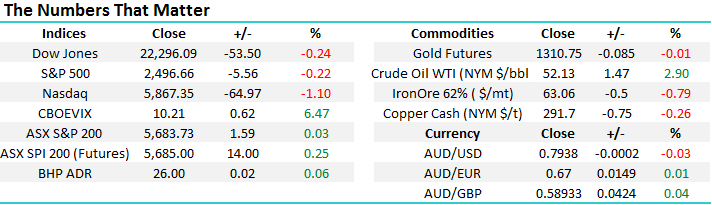
Last night was 11 out of the last 12 days that value stocks have outperformed growth stocks in the US. The relative performance was a much larger standout within stock markets than the muted reaction to North Korea claiming that the US had declared war, which only led to minor 0.2% correction by the Dow. In simple terms, fund managers have been switching to companies / sectors which are ranked “cheap” on an historical basis, compared to those who are trading on the more expensive side of the ledger.
1. Value stocks – banks and energy sectors.
2. Growth stocks – technology sector.
As we have discussed over recent months, 2017 has all been about sector rotation. When one sector gets sold off, funds are simply being reallocated into another, hence avoiding a general market sell-off – this makes sense when fund managers are sitting on relatively large cash holdings. Last night saw a $50bn sell-off in the likes of Amazon, Apple, Google and Netflix as the market lost confidence in their ability to grow at a pace to warrant their current valuations, but again the indices held relatively firm. The fact that the press is starting to focus on this recent market characteristic, leads to us focus on when we believe it may be time to go the other way!
We believe this current relative pullback in growth stocks is the warning period for investors that growth stocks have rallied too hard, just consider only 4 tech companies have accounted for 22% of the S&P 500’s 11.5% gain in 2017. Clearly not a traditional healthy broad based rally. Markets usually give investors a warning, followed by renewed optimism prior to a decent downturn, hence our view at MM remains that this is a healthy pullback by the high P/E growth stocks as opposed to time to “get off the train”. However, in the bigger picture when the growth stocks do give up the ghost, it’s likely to coincide with a major top for stocks.
Today we are also going to also consider 3 of the local energy plays to see if we can find any value.
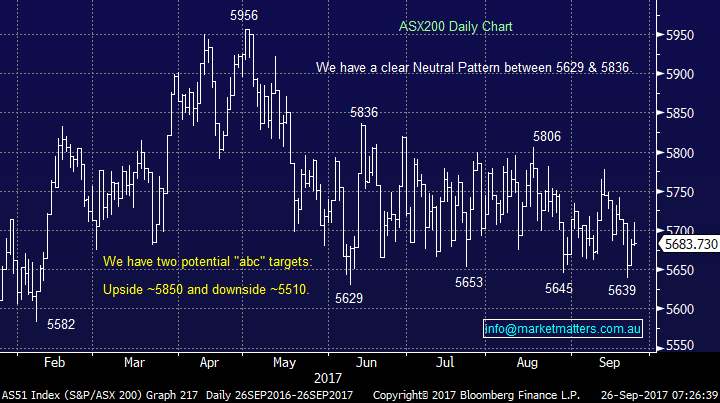
ASX200 Daily Chart
US Stocks
Last night the broad based S&P500 slipped 0.22%, but the energy stocks gained +1.44% offsetting most of the -1.18% decline by the technology sector.
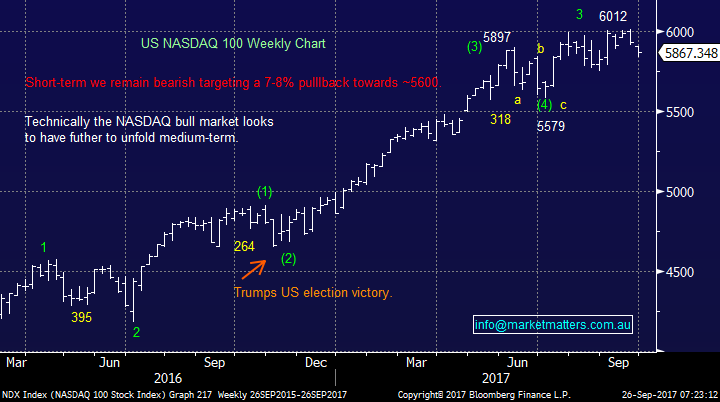
There is no change to our short-term outlook for US stocks, we are targeting a further ~4.5% correction for the tech NASDAQ back towards the 5600 area.
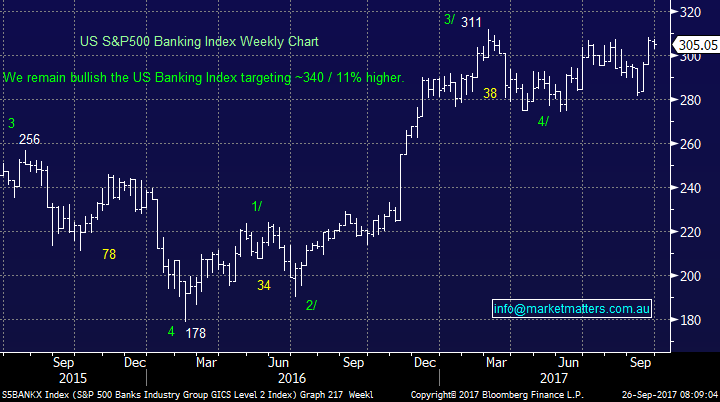
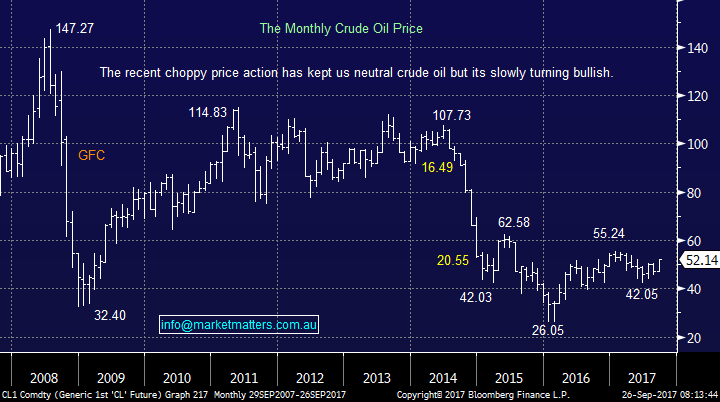
Also, it should be remembered that we are bullish the US banking sector, targeting ~10% higher prices over the coming weeks / months. Plus, crude has broken up to 4-month highs turning us bullish, unless we see failure back under $US50/barrel which represents excellent risk / reward.
Hence we feel the current switch from growth to value looks likely to be fairly early into its cycle.
US NASDAQ Weekly Chart
US S&P500 Banking Index Weekly Chart
Crude Oil Monthly Chart
3 Australian energy plays
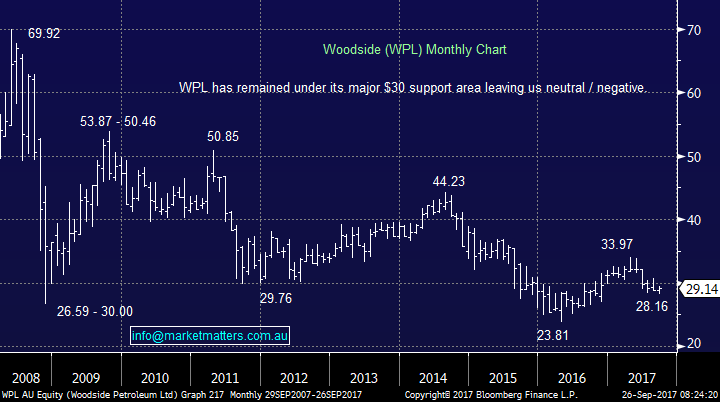
Woodside Petroleum (WPL) $29.14
We have not hidden the fact that at MM we are not long-term fans of crude oil as clean energy advances in leaps and bounds, but if crude oil is going to advance back over $US60/barrel, there is likely to be some money on the table in 2017 from within our energy sector – definitely active investing.
However we must not ignore the risks to our energy sector around the Australian gas deficit increasing dramatically leading to likely LNG export curbs – again in the news today.
WPL is Australia’s largest pure energy play, but like the entire sector, it’s been an awful investment since the GFC.
WPL remains down -0.9% over the last month, but now looks capable of bouncing back towards the $30.50 region i.e. 5% higher which overall is not particularly exciting.
Woodside Petroleum (WPL) Monthly Chart
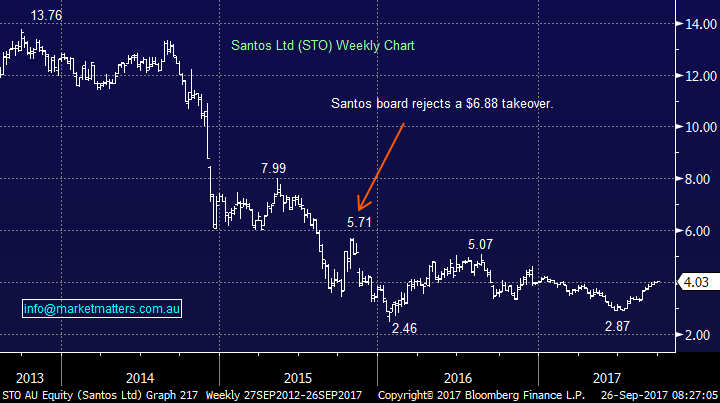
Santos (STO) $4.03
STO has enjoyed the best returns of the sector, gaining over 10% this month. Over the years STO has been a stock we have often been very anti, but it’s now looking very interesting while it can hold over $3.40.
Technically STO looks good targeting close to $5.50 which is excellent risk / reward.
Santos (STO) Weekly Chart
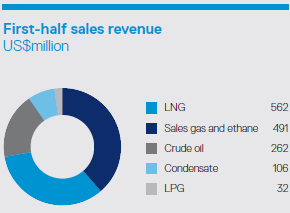
Santos First Half Year Revenue Breakdown
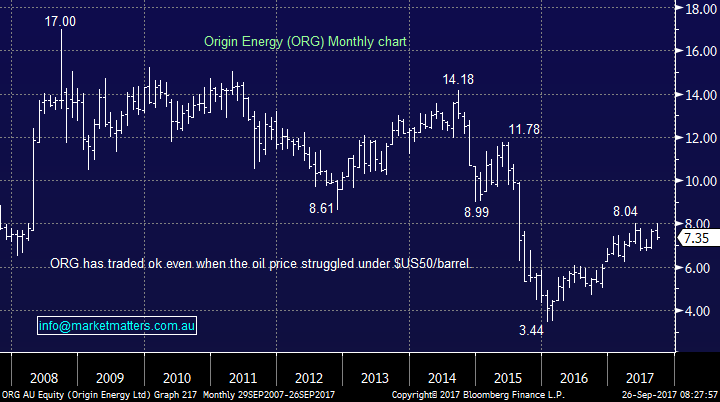
Origin Energy (ORG) $7.35
ORG is the worst performer of the majors over the last month falling over 3%.
Technically we are sellers over $8.10 and buyers around $6.50 but alas were neutral just here.
Origin Energy (ORG) Monthly Chart
Conclusion (s)
We feel the current switch from growth to value looks likely to be fairly early into its cycle.
We also like STO as an aggressive play within the energy sector on a risk / reward basis.
Overnight Market Matters Wrap
A negative start for the week was experienced overnight in the US share markets, as geopolitical tensions amplified between US and North Korea, again, with the tech. heavy, NASDAQ underperforming the most.
As tensions increased, investors again reduced their risk exposure and switched back into the safe haven treasuries.
Although Iron Ore has entered in bear market territory, diversified miner BHP is equivalently up marginally in the US, contributed by the 2.9% increase of crude oil overnight.
The ASX 200 is expected to test the 5700 level this morning, up 17 points as indicated by the December SPI Futures.
Disclosure
Market Matters may hold stocks mentioned in this report. Subscribers can view a full list of holdings on the website by clicking here. Positions are updated each Friday.
Disclaimer
All figures contained from sources believed to be accurate. Market Matters does not make any representation of warranty as to the accuracy of the figures and disclaims any liability resulting from any inaccuracy. Prices as at 26/09/2017. 7.30AM.
Reports and other documents published on this website and email (‘Reports’) are authored by Market Matters and the reports represent the views of Market Matters. The MarketMatters Report is based on technical analysis of companies, commodities and the market in general. Technical analysis focuses on interpreting charts and other data to determine what the market sentiment about a particular financial product is, or will be. Unlike fundamental analysis, it does not involve a detailed review of the company’s financial position.
The Reports contain general, as opposed to personal, advice. That means they are prepared for multiple distributions without consideration of your investment objectives, financial situation and needs (‘Personal Circumstances’). Accordingly, any advice given is not a recommendation that a particular course of action is suitable for you and the advice is therefore not to be acted on as investment advice. You must assess whether or not any advice is appropriate for your Personal Circumstances before making any investment decisions. You can either make this assessment yourself, or if you require a personal recommendation, you can seek the assistance of a financial advisor. Market Matters or its author(s) accepts no responsibility for any losses or damages resulting from decisions made from or because of information within this publication. Investing and trading in financial products are always risky, so you should do your own research before buying or selling a financial product.
The Reports are published by Market Matters in good faith based on the facts known to it at the time of their preparation and do not purport to contain all relevant information with respect to the financial products to which they relate. Although the Reports are based on information obtained from sources believed to be reliable, Market Matters does not make any representation or warranty that they are accurate, complete or up to date and Market Matters accepts no obligation to correct or update the information or opinions in the Reports.
If you rely on a Report, you do so at your own risk. Any projections are estimates only and may not be realised in the future. Except to the extent that liability under any law cannot be excluded, Market Matters disclaims liability for all loss or damage arising as a result of any opinion, advice, recommendation, representation or information expressly or impliedly published in or in relation to this report notwithstanding any error or omission including negligence.
To unsubscribe. Click Here