The ASX200 is not that bad! (ALL, TLS, CGF, HSO RRL)
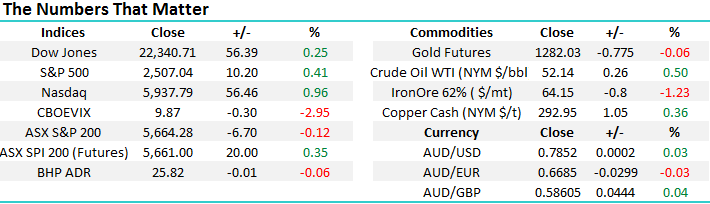
The ASX200 was described in yesterday’s Financial Review as the “the most hated index in Asia” not very encouraging for investors to read but I guess we should all be getting used to negative press – how many times have we read that the local housing market is poised to crash? However journalists often just utilise the surface numbers when writing these articles searching for eye catching headlines, as opposed to considering the bigger picture / all the factors, let’s take a simple look at the ASX200:
1. At yesterday’s close the ASX200 was unchanged for 2017 in Australian Dollar terms, before dividends i.e. to you and I.
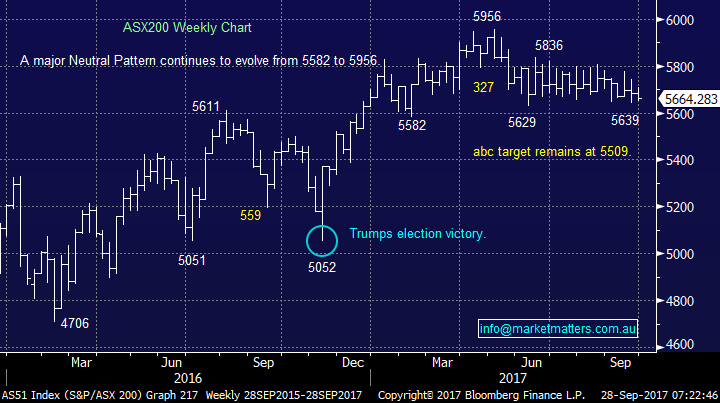
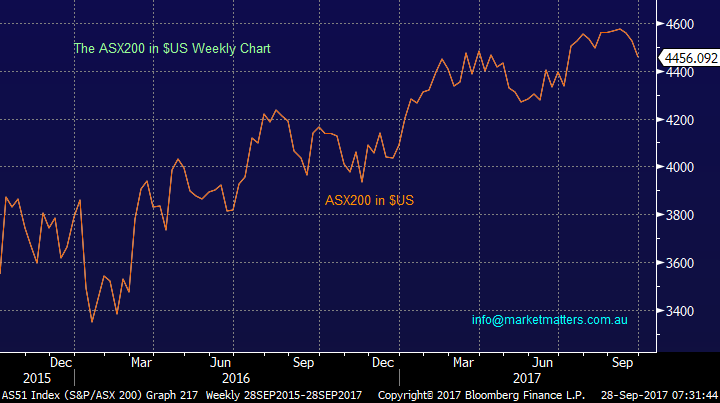
2. However in $US terms which most global fund managers use to invest overseas and benchmark against we closed up 9% for 2017 yesterday, before dividends – see the second chart below.
We have been describing over recent weeks how our market has been hit with selling most mornings with the feeling that its originated from overseas and point 2 above should shine some light on the reason why. Three weeks ago when the aggressive selling hit our market we were actually up over 13% for 2017 in $US terms as the “ Little Aussie Battler” was trading comfortably above 80c. Remember the US S&P500 is only up 12% in 2017 after last night’s rally so we are most certainly performing excellently for overseas investors.
Considering 3 weeks ago the ASX200 was actually outperforming US stocks in $US it’s not surprising that we’ve seen some profit taking from overseas investors, the below 4 points would certainly be influencing their decision making process:
- The $A is feeling “toppy” over 80c after rallying strongly from sub 70c.
- The Australian resources sector has run hard since early 2016 and may be ready for a pullback, an important sector as we are one of the few indices where investors can get quality resources exposure.
- The investing community does remain concerned about Australia’s housing market.
- Australia is one of the most indebted nations in the world which is likely to hamper our economic position moving forward.
Taking these points into account it’s easy to understand the recent activity especially as international investors are often more active, like ourselves at MM – there is method in our madness e.g. consider BHP is down -44% since mid-2011, CBA -22% since mid-2015 and Telstra (TLS) -48% since early 2015. There would be very few portfolios in Australia that have not worn some of this pain whereas over the last 4-years MM has made healthy returns from these 3 household names.
Today we are going to update our plans for the coming days as volatility feels just around the corner. Yesterday was very busy on the MM desk and it’s important to us that all subscribers understand our plans / logic at times of movement.
ASX200 Weekly Chart
ASX200 in US$ Weekly Chart
US Stocks
Last night the broad based S&P500 closed up 0.4% at an all-time high but it’s now been given the very bullish “Tax cuts” plan by Donald Trump which has helped support stocks since the US election last November - the risk now is the good news is probably over for 2017.
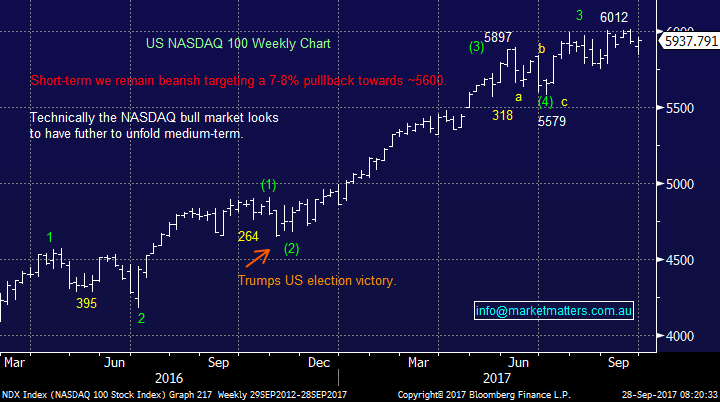
There is no change to our short-term outlook for US stocks, we are targeting a further ~5% correction for the tech NASDAQ back towards the 5600 area.
US NASDAQ Weekly Chart
The story remained the same last night following Trumps tax cuts announcement and bullish comments on the economy from the Fed Chair Janet Yellen, but overall we feel the market looks tired considering the Dow could only rally 56-points / 0.25%.
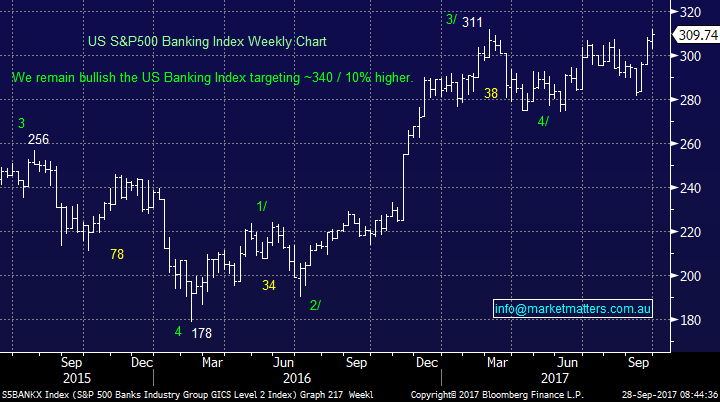
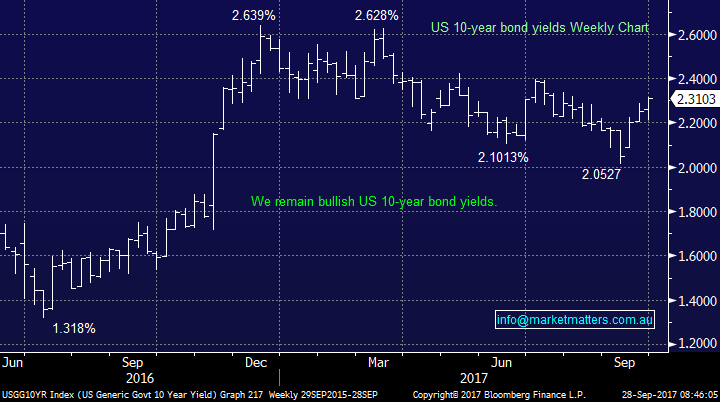
The US banking Index rallied and is now only 0.6% below its high for 2017 as it followed US bond yields north – the 10-years are testing their 8-week highs. While we remain bullish looking for ~10% further upside for US banks the “easy money” has gone – Australian banks are likely to be supported by this move for now at least.
US S&P500 Banking Index Weekly Chart
US 10-year bond yield Weekly Chart
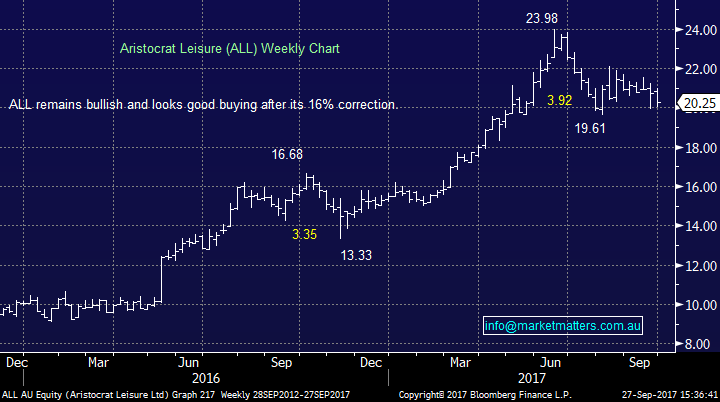
1 Aristocrat Leisure (ALL) $20.25 – We are initially targeting ALL around $19.95 for a 3% allocation but will be happy to at least double this position size into further weakness..
NB Sorry for the typo in yesterday’s PM report, buying at $11.95 would be very optimistic indeed!
*Watch for alerts.
Aristocrat Leisure (ALL) Weekly Chart
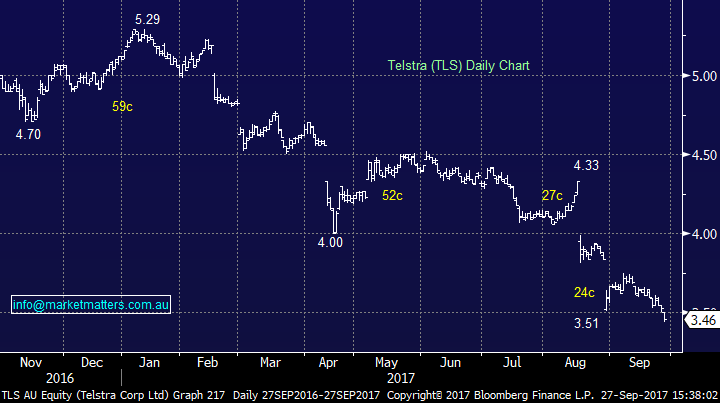
2 Telstra (TLS) $3.47 - We added 2.5% to our TLS at $3.48 yesterday. While we have no intention of increasing this position size we like our average entry price and are very probably one of very few investors who are down only a few % from buying Telstra (TLS) over recent years – not counting our previous profits from the stock.
Our selling back on the 26th of June at $4.34 looks pretty good today.
Telstra (TLS) Daily Chart
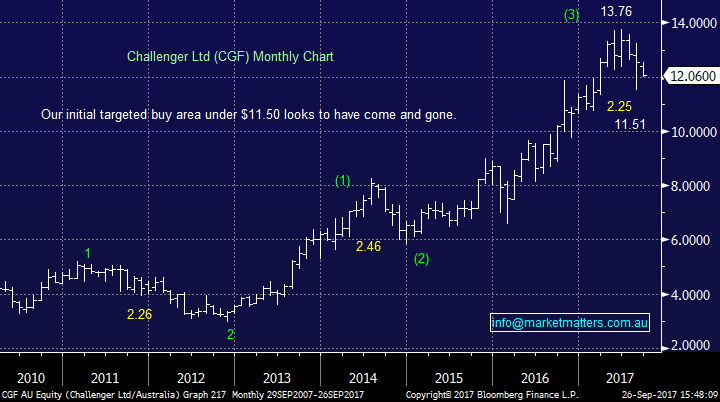
3 Challenger (CGF) $12 - We allocated 3% into CGF yesterday at $11.95 and remain keen to increase our exposure into any further weakness.
*Watch for alerts.
Challenger Financial (CGF) Monthly Chart
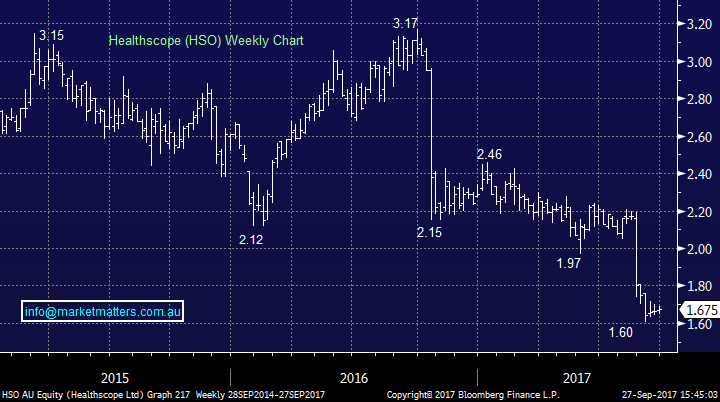
4 Healthscope (HSO) $1.68 - We are currently losing a few cents on our position in HSO and are contemplating selling out around the $1.70 area, especially as solid buying opportunities are slowly appearing elsewhere..
Healthscope (HSO) Weekly Chart
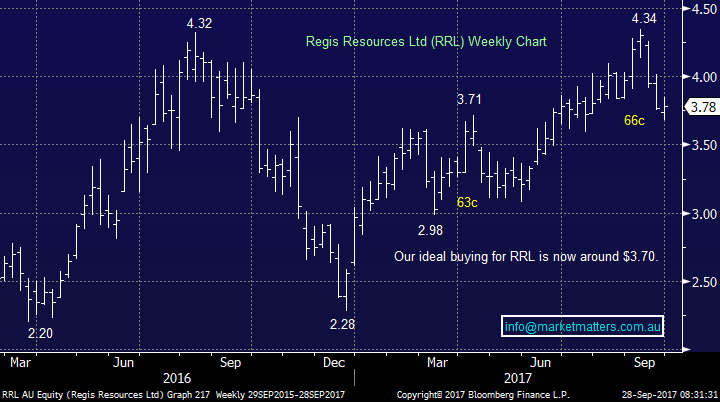
5 Regis Resources (RRL) - Gold was smacked $US16/oz. overnight which led to a 1.5% fall by the Market Vectors Gold ETF (GDX). While we are remaining patient on our gold stocks accumulation RRL will certainly be considered under $3.70 for a initial “dip of the toe”.
Regis Resources (RRL) Weekly Chart
Conclusion (s)
We remain keen to increase our market exposure into weakness but see reason to chase stocks at current levels, especially with our overweight banking position feeling correct.
We remain buyers of ALL around $19.95 in-line with yesterday’s alert.
Overnight Market Matters Wrap
· US markets rallied overnight as investors focussed on President Trump’s proposed tax reform, which is expected to lead to a simplified corporate tax structure with the top rate lowered from 35% to 20%.
· A surge in technology shares and smaller cap stocks saw the Nasdaq rally 1%, while the Russell 2000 small cap index jumped 1.9% to hit record levels. Smaller companies in the US are expected to be big winners from tax reform as they tend to pay towards the higher rates.
· The US$ also continued to strengthen as investors focussed on any potential tax cuts fuelling growth and inflation – Bonds sold off to recent highs of 2.31% while the A$ traded at US78.5c.
· Gold continued its pullback to us$ 1285 (from $1315 earlier in the week) as did the Brent oil price (US$57.60), while other commodities were mixed – nickel fell 2%, iron ore -1.2% to US$64.15/t while copper and aluminium were slightly stronger.
· The December SPI Futures is indicating the ASX 200 to open 15 points higher testing the 5680 level this morning, with September Equity Options expiry this afternoon.
Disclosure
Market Matters may hold stocks mentioned in this report. Subscribers can view a full list of holdings on the website by clicking here. Positions are updated each Friday.
Disclaimer
All figures contained from sources believed to be accurate. Market Matters does not make any representation of warranty as to the accuracy of the figures and disclaims any liability resulting from any inaccuracy. Prices as at 28/09/2017. 8.00AM.
Reports and other documents published on this website and email (‘Reports’) are authored by Market Matters and the reports represent the views of Market Matters. The MarketMatters Report is based on technical analysis of companies, commodities and the market in general. Technical analysis focuses on interpreting charts and other data to determine what the market sentiment about a particular financial product is, or will be. Unlike fundamental analysis, it does not involve a detailed review of the company’s financial position.
The Reports contain general, as opposed to personal, advice. That means they are prepared for multiple distributions without consideration of your investment objectives, financial situation and needs (‘Personal Circumstances’). Accordingly, any advice given is not a recommendation that a particular course of action is suitable for you and the advice is therefore not to be acted on as investment advice. You must assess whether or not any advice is appropriate for your Personal Circumstances before making any investment decisions. You can either make this assessment yourself, or if you require a personal recommendation, you can seek the assistance of a financial advisor. Market Matters or its author(s) accepts no responsibility for any losses or damages resulting from decisions made from or because of information within this publication. Investing and trading in financial products are always risky, so you should do your own research before buying or selling a financial product.
The Reports are published by Market Matters in good faith based on the facts known to it at the time of their preparation and do not purport to contain all relevant information with respect to the financial products to which they relate. Although the Reports are based on information obtained from sources believed to be reliable, Market Matters does not make any representation or warranty that they are accurate, complete or up to date and Market Matters accepts no obligation to correct or update the information or opinions in the Reports.
If you rely on a Report, you do so at your own risk. Any projections are estimates only and may not be realised in the future. Except to the extent that liability under any law cannot be excluded, Market Matters disclaims liability for all loss or damage arising as a result of any opinion, advice, recommendation, representation or information expressly or impliedly published in or in relation to this report notwithstanding any error or omission including negligence.
To unsubscribe. Click Here