Subscriber Questions (RFG, ALF, COH, A2M, SM1, MXT, Z1P, ORE, KDR, GXY, NAB, WBC, RRL)
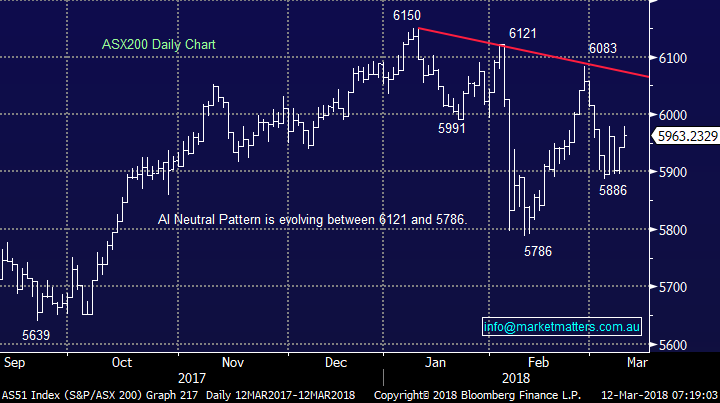
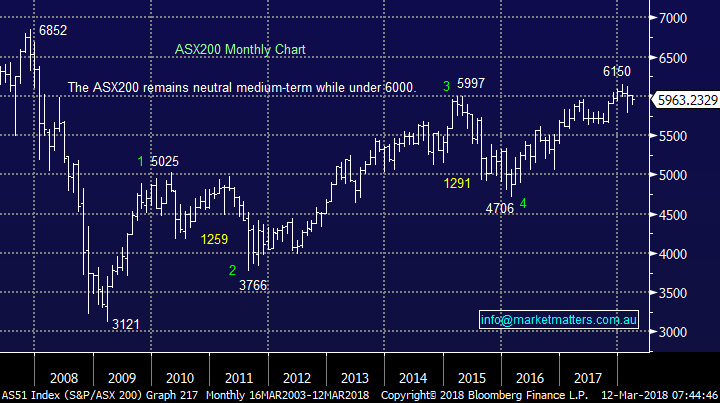
The ASX200 should open with a bang this morning, up around 60-points / 1% courtesy of a surging US market. We remain bullish local stocks targeting 6250-6300 in March / April with the initial major resistance coming into play around 6060. We would now need to see the local market fail and break back down below 5960 for us to lose our short-term bullish bias.
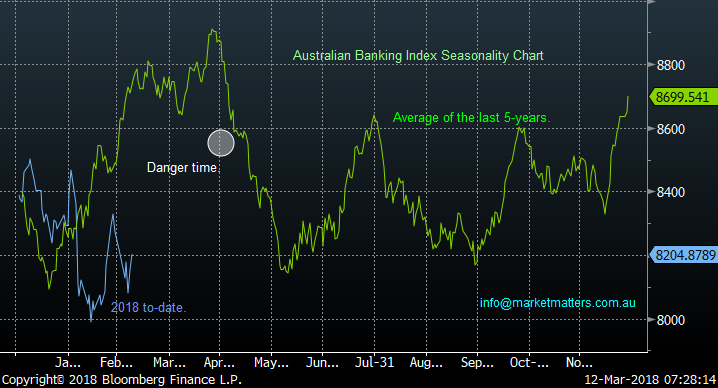
Seasonally our hugely influential Banking Sector is due a springboard style lift off into late April which would / will be very bullish for the overall index.
Our view at MM remains Februarys aggressive sell-off by global equities is the warning sign we have anticipated for what will follow over the coming years but the time to jump off the stock market train has not arrived, just yet.
ASX200 Chart
Australian Banking Index Seasonality Chart
The US market has given us both a positive lead and great statistical / structural indicators for the coming weeks.
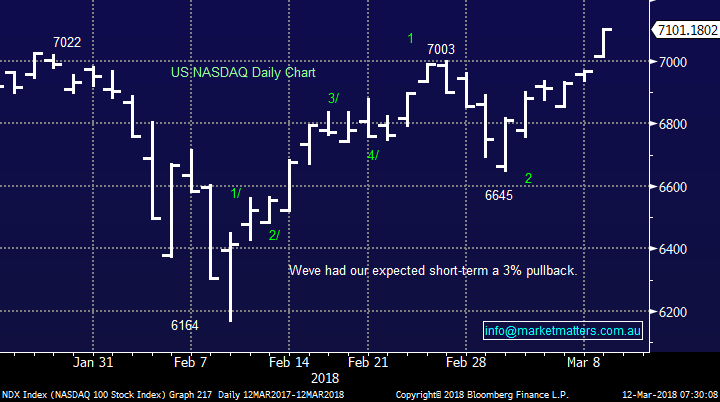
- The NASDAQ made fresh all-time highs on Friday, our preference is for further acceleration higher during this week.
US NASDAQ Chart
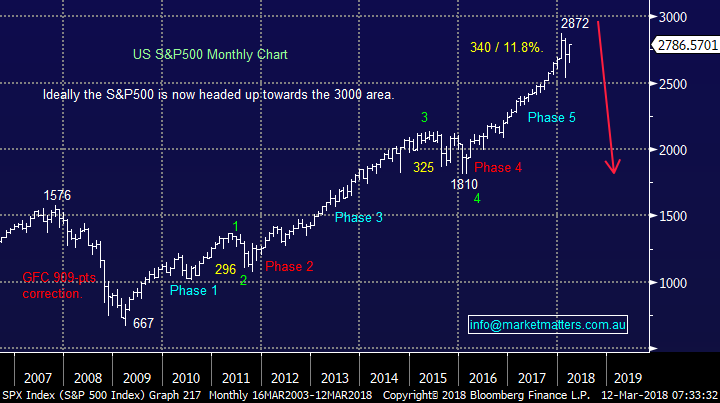
In the bigger picture unfortunately we continue to believe it’s almost “bon voyage” for the bulls as MM targets an eventual test of the 2015 lows as global share markets are positioning themselves almost perfectly to correct the 9-year bull market, following the GFC.
- Corrections are a healthy facet of markets but certainly scare many investors when they are significant, say greater than -20% which has already occurred 3 times since Sydney hosted the Olympics.
US S&P500 Chart
This week we have again received a record number of questions which addresses some excellent topics / issues. Today I have answered 14 in total with 2 wrapped into one answer. Thanks for the questions / engagement, please keep them coming!
Question 1
“Morning James, Good read this morning with pertinent ideas for my portfolio going forward. Would appreciate your thought on the liquidity of the two ETF's discussed this morning especially amidst high volatility situations/market routes etc.” – Regards Paul G.
Thanks Paul, for clarity, Paul is referring to the 2 negative facing ETF’s we covered last week, one on the ASX 200 (BEAR) and one on the S&P 500 (BBUS). In short, liquidity is not an issue here given the underlying exposures are extremely liquid. For the BEAR, the underlying exposure is the SPI Futures contract while in the US, it is the S&P Futures contract, both are amongst the most liquid markets around. In terms of getting set in volume on both, there is the ‘screen’ volume but for any reasonable size it is always best to have your broker call the Market Maker that creates the market. They can then facilitate a price based on where the futures are trading at the time (which allows the MM to hedge their exposures). Market Makers are obligated to make markets in these products even during volatile times. A link here to the ASX showing the market makers that trade in different ETFs. https://www.asx.com.au/products/etf/market-making.htm. We also covered liquidity on ETFs discussed in the Income Report on Wednesday – available here – with specific reference to equity ETFs and the concept of implied liquidity – which is a Bloomberg calculated number based on the liquidity of the underlying shares.
Question 2
“Morning James and Team, Thank once again for alerting me to the dangers RFG given the continued disaster it has become. I have a concern about the continued decline of ALF. Given its NTA and the buyback one would have expected it to being doing a lot better than it is. Their recent update to the market also was very unclear (I suspect deliberately) as to whether they would pay a dividend or make a capital return this half. What is your current view of the stock?” - Regards, Jeff C.
Morning Jeff,
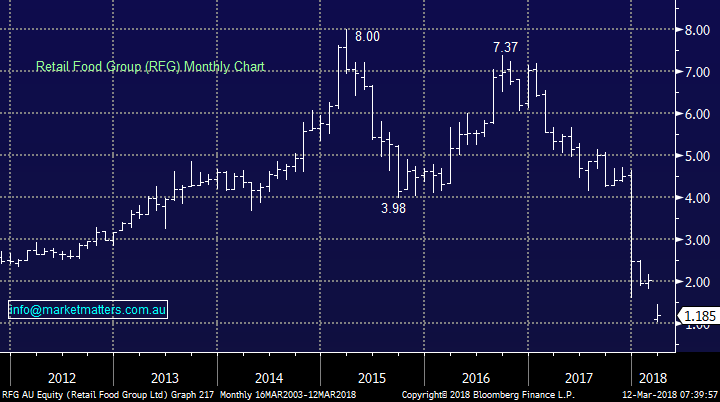
Firstly, Retail Food Group (RFG) has clearly been an unmitigated disaster leading to enormous wealth destruction, I’m glad we helped you there., however it is a very different scenario to ALF which is a listed investment
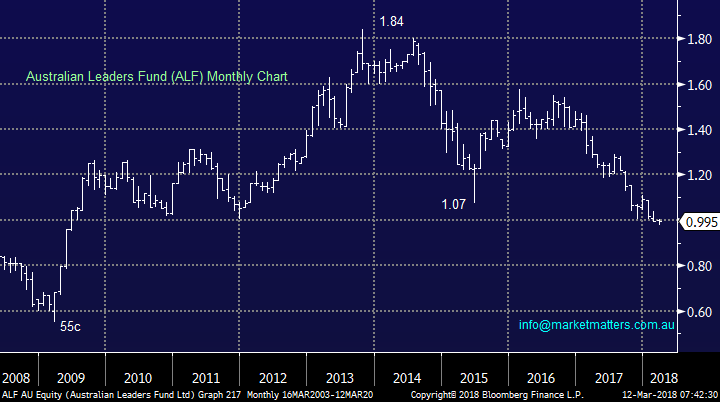
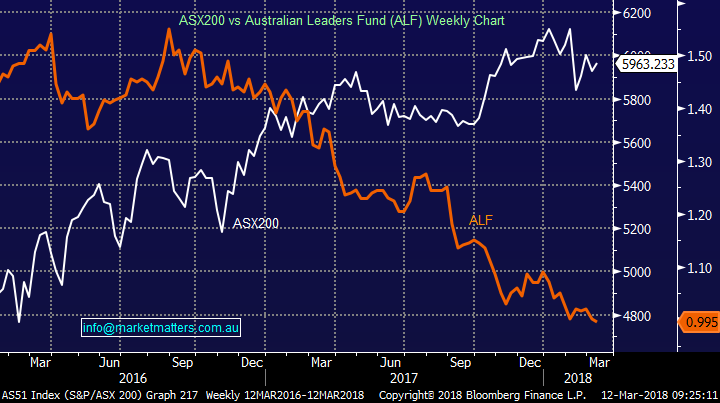
Secondly, the Australian Leaders Fund (ALF) performance has been disappointing but their mandate does allow a pretty flexible investment position i.e. up to 50% in liquid assets and may short sell up to 30% of equity – they’re a long short fund in simple terms. Their performance has been woeful however they typically underperform in strong market and outperform in a weak market, this was certainly the case in February when volatility rose it’s head. We have it in the income portfolio as a value opportunity with the likelihood of capital returns over time. It trades a long way below the value of its assets and it remains our expectation that as markets became more suited to their approach (volatile with a down bias) this fund would start to outperform.
Retail Food Group (RFG) Chart
Australian Leaders Fund (ALF) Chart
Australian Leaders Fund (ALF) Chart v ASX 200 – showing inverse correlation
Question 3
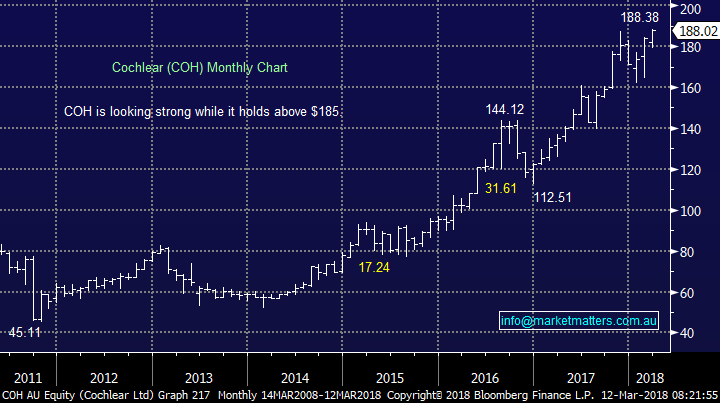
“I would have thought COH is still technically bullish. Guppy MMA is bullish with diverging short and long MMAs; Ichimoku is bullish with Tenkan sen and Kijun sen and price above the cloud; EMA9 is above EMA26 and also diverging which is also bullish.” – Thanks David R.
Morning David, statistically a stock breaking to fresh all-time highs, as COH currently has, is usually a bullish sign – no surprises there.
However when we look at markets from a technical perspective we’re more focussed on structures / statistics as opposed to following other “text book methods” – simple pattern recognition built up from years of staring at my Blomberg screen.
COH is undoubtedly a great company but we can easily see another ~$30 pullback within the current uptrend, similar to that in 2016 after it makes a new high. Hence from a risk / reward perspective we are only buyers at this point in time ~$160 and will get bearish warning lights on a break back under $184 – which may not happen of course.
Cochlear (COH) Chart
ASX200 Chart
Question 4
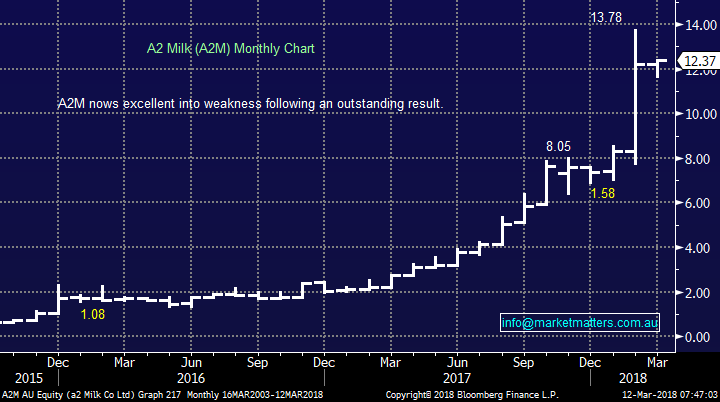
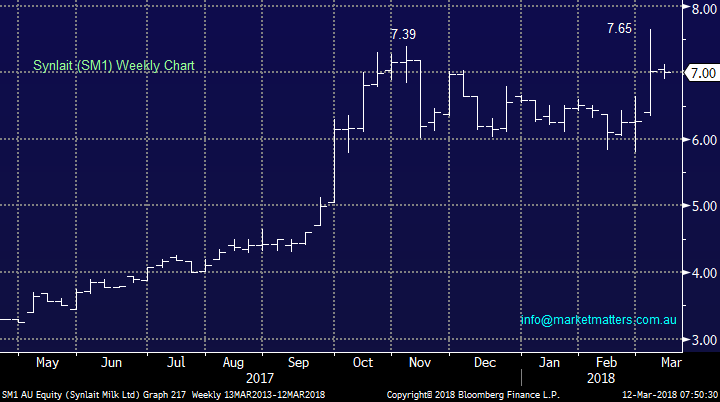
“Good morning MM, In today’s report you are interested in accumulating A2M between $11 and $11.50, what are your thoughts regarding SM1 (Synlait). As the major supplier to A2M and with its recent expansion to meet increased demand is this another way of investing in this space? SM1 also are due to release their results on 21st of March. I have a small holding in both and would be interested in your thoughts.” – Thanks Graeme.
Morning Graeme, a great laterally thinking question!
SM1’s performance is clearly very correlated to that of A2M but there are 2 reasons we prefer A2M :
- A2M trades with greater liquidity providing better / easier to identify risk /reward opportunities.
- Secondly A2M looks significantly healthier technically trading 50% above its 2017 high whereas SM1 is actually below the equivalent milestone – buying the relative strength is often the best action with investing.
A2 Milk (A2M) Chart
Synlait (SM1) Chart
Question 5
“Hi James and Team. As a subscriber I really appreciate the information and insights you provide. I have just read the recent MM Income report (07 Mar) in which you provide detail on the new CBA hybrid and compare it to the recent Westpac offer. I have a question I would appreciate your thoughts and feedback on... Q) if you were looking to invest $20K in only one of the following three options....the new CBA hybrid or the WBC hybrid or MXT - which would be your preference? My question stems from reading the following article "The difference between bonds and shares in a severe correction" on the FiiG website (URL provided). I found the graph of particular interest. http://thewire.fiig.com.au/article/commentary/opinion/2018/03/06/the-difference-between-bonds-and-shares-in-a-severe-correction “ - Thanks & Regards, Jan
Hi Jan – thanks for the comprehensive question. Unfortunately we don’t provide advice on what ‘you’ should do, we simply provide general advice on markets, stocks and the like. If you are looking for a more personal approach, my team over at Shaw can help. Turning to the 3 investments mentioned. The WBC and CBA hybrids are similar in structure and concept. A buyer of those securities is simply lending money to CBA or Westpac at a given rate. The rate CBA has paid is 0.20% per annum higher than the Westpac rate (3.40% v 3.20%) over the bank bill rate, so CBA will trade marginally higher than WBC on market, although both are around about fair value given current market pricing.
The MXT is something different. This is a fund that makes loans to Australian corporates alongside banks. Or in simple terms, a holder of these securities is acting more like a bank than a lender to the bank as is the case with a Hybrid. The MXT loans typically sit higher in the capital structure than a hybrid security however the underlying corporates are clearly not as regulated as a major bank. It’s a different security, different exposures and that is one of the key reasons we like it. In terms of bonds v shares in the downturn, the article is certainly correct however it is coming from a ‘Bond Broker’. Bonds too have risks, the main one being the continued viability of the issuer. One recent example is with Silver Chef (SIV), a company that issued bonds (through said bond broker) and is now in trouble. The outcome in circumstances like this can often be binary, meaning you get your money back at maturity - or you don’t get anything at all. The other aspect from a retail perspective is the liquidity of over the counter bonds. Paul made a very good point above around ETFs however the same concept is relevant here – there is often an opaque market with very little transparency and in my experience, questionable liquidity at times in some issues.
Question 6
“Hi, James could you explain a little about the WPL and MXT capital raising process. I am interested in take the offer however, how can I do to take the offer, I didn't received any letter or email regarding to those offer yet from them. I don't want to miss that.” – Thanks Michael S.
Hi Michael, the WPL rights issue closed last week. There are a few components to it. Existing holders of Woodside shares received the ‘right’ but not the obligation to buy 1 new share for each 9 they owned at a price of $27.00. The institutions are tapped here first and over 90% of institutions took up that right. Of the ~10% that did not, their rights went into a book build process and were sold at $29.60 per share. The institutions that sold their rights through the book build process would receive $2.60 per share in cash. The same applies to the retail offer. Existing retail shareholder have the right to buy more stock, sell their rights on market given they are ‘renounceable’ or if they do no nothing, their rights will be automatically be put into a book build process and the difference between the prevailing book build price and $27.00 of the rights will be paid back to the retail shareholder. Through a broker, there is the ability to participate in the shortfall book build processes however as we saw with the institutional book build, this landed at $29.60 which was well above the $27 rights price.
In terms of MXT, the same process will apply although the rights in this case are non-renouncable, which means they cannot be sold on market. For this raise, existing holders will have the ability to buy 1 new unit in the trust for every 1.7 they own, so this is a bigger raise relative to existing size of the fund given the ratio of 1 for 1.7 at $2.00 per unit. In this instance, the shortfall is expected to be larger and there will be the capacity for ‘non-existing’ unit holders to but in at or around the $2.00 issue price through this book build process. Through Shaw and Partners, we will have access to this process and can accept bids into this book. We will provide details closer to the time .
Question 7
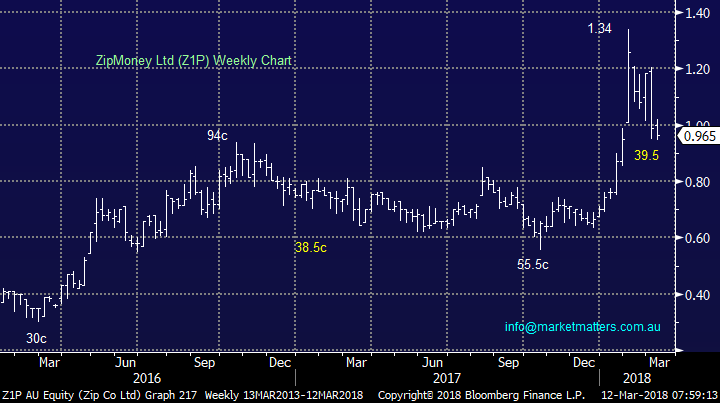
“Hi There, Just a question for you regarding Zip Co (Z1P) which seems to have disappeared from your Radar. Any Thoughts.” Thanks – Peter W.
Morning Peter, your correct we have not mentioned Z1P for a few weeks primarily because its price action has felt “wrong”. However from a risk / reward perspective Z1P money is looking pretty good at current levels:
- We could buy Z1P around 96c with stops under 90c targeting $1.15 minimum – over 3:1 risk / reward.
ZIP Money (Z1P) Chart
Question 8
“Dear James, outstanding commentary; the best paid advise in Australia I think. No one knows whether the stocks will go up or down tomorrow, however sticking one’s neck to make these predictions rather than walking on both sides of the street (as many analysts do) takes courage.” - Take care Jay M.
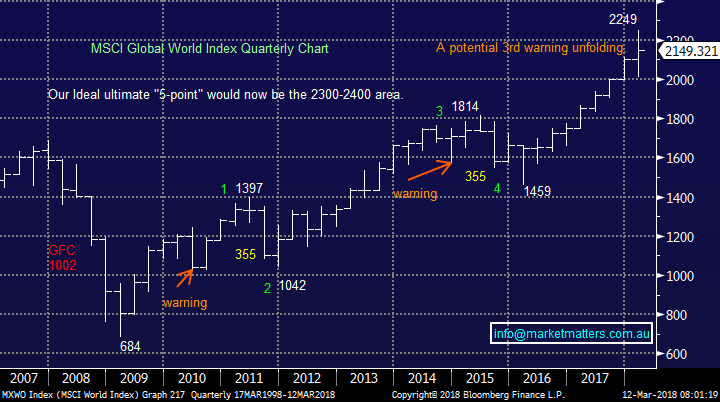
Thanks Jay, the “big one” as my friends in California believe is always around the corner we at MM believe is extremely close for global stocks.
· We are looking for +20% correction by global equities over 2018/9, perhaps into 2020.
· If this “big call” is correct the ASX200 is likely to again flirt with the 5000 area.
MSCI Global World Index Chart
Question 9
“Hi James, not a negative facing EFT as such, but you could consider shorting the two cash markets for ASX200 and SP500 via CFDs, obviously if they had access to a CFD account.” - thanks Paul S.
“Thanks for the ETF background and BEAR as well as BBUS. Please now tell us how they go short - futures, options? Also what are the major risks - lack of liquidity?” - Thanks Frances
Hi Paul / Frances, When it comes to shorting, just as with buying, we simply believe it’s important to use vehicles that are efficient and liquid. The futures market is basically as liquid as the underlying equity market itself with arbitrage quickly brings any price anomalies back into line.
Hence vehicles like BEAR and BBUS (through market makers) can easily go short in the futures market to balance their ETF hence liquidity should not be a concern – SPI futures (the ASX200 futures contract) actually trades around 22-hours a day way longer than stocks
CFD’s are another vehicle that can easily be used to short the market and again the issuers will more than likely hedge with futures against index CFD positions which should have no issues with liquidity.
Question 10
“Hi MM, It would be very helpful if you could give an analysis opinion for these 3 Lithium Shares (as it might apply to your perspective). The increased volatility with Galaxy Resources is clearly visible, but the different price responses and timeline events would make an interesting news article.
- Does this mean that different types of investors or traders are buying ORE and KDR instead of GXY?
- At what stage might GXY become popular with those who buy more longer term?
- Perhaps less visual chart volatility,
- or perhaps when GXY reaches a certain production stage?
Regards and Thanks, Phil.”
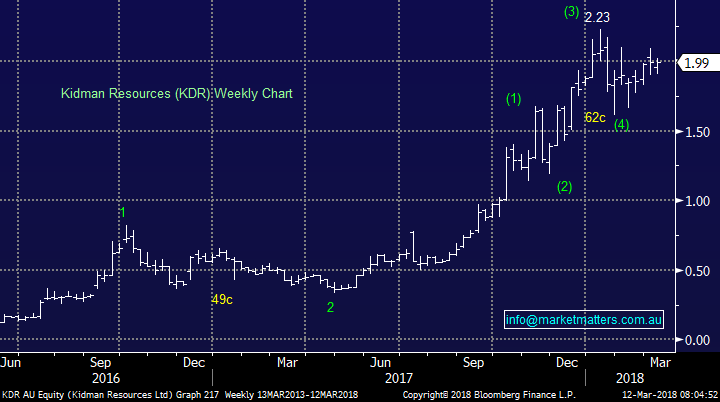
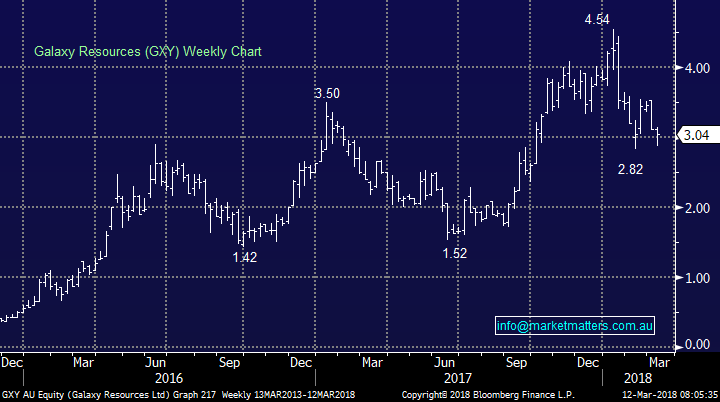
Morning Phil, the lithium space is a very volatile sector as is common with new technology sectors i.e. lithium is a key ingredient in electric car batteries. Overall our view is the market is voting with its $$ around company quality when we look at their respective performance:
- KDR – Our favourite stock in the sector which we currently own still looks solid and on track to reach ~$2.30.
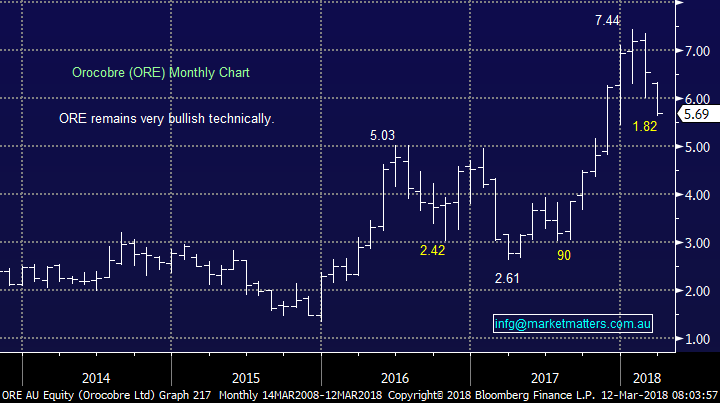
- ORE – our second favourite stock in the sector but has been a touch heavy of late with February’s capital raising probably an issue – we think the stocks great buying around $5.60.
- GXY – the speculative end of town and it looks to have topped out in 2018, we have no interest buying GXY for now.
Orocobre (ORE) Chart
Kidman Resources (KDR) Chart
Galaxy Resources (GXY) Chart
Question 11
Hi Market Matters, Currently a subscriber to MM, i wish to know if you offer managed funds? if you do, can you please advise how do we invest?” - Thanks, Jacky
Morning Jacky, a very timely question! MM are launching two SMA’s next month, we will keep all subscribers posted.
Question 12
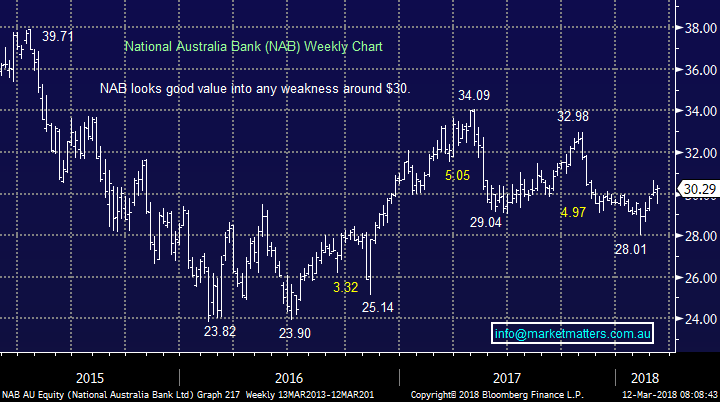
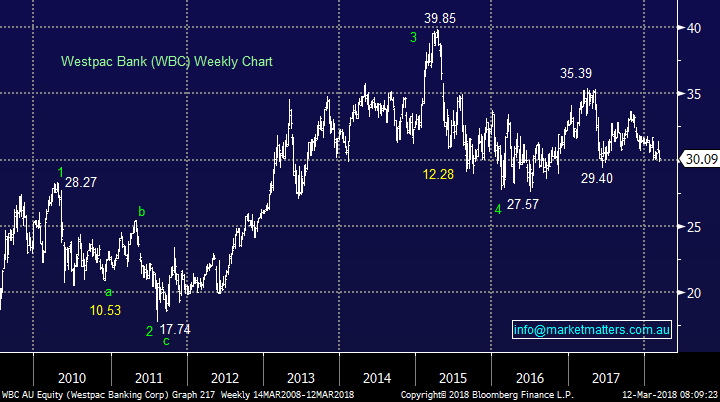
“Good Morning Great work guys. Looking forward to April do you have target sell prices for NAB and WBC. On Mon 09 you gave around $80 for CBA. Which banks would you sell if they reach these?” – Thanks Chris.
Morning Chris, I hope you’re ok with guesstimates:
- We can see NAB reaching $31.75 and WBC a slight laggard ~$31.50.
National Australia Bank (NAB) Chart
Westpac Bank (WBC) Chart
Question 13
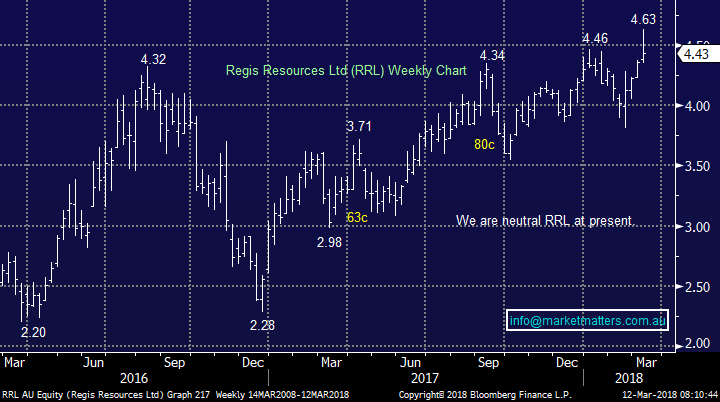
“Hi does MM have a view on RRL? If aligning with your view that there will be a +-20% correction and looking to move to cash, is this one that you would hold onto through this correction or take gains now? I picked it up at $3.90 in Dec 17 with a target price of 4.50, which it has now hit, including Div of 0.08 on Mar 8th.” – Thanks James D.,
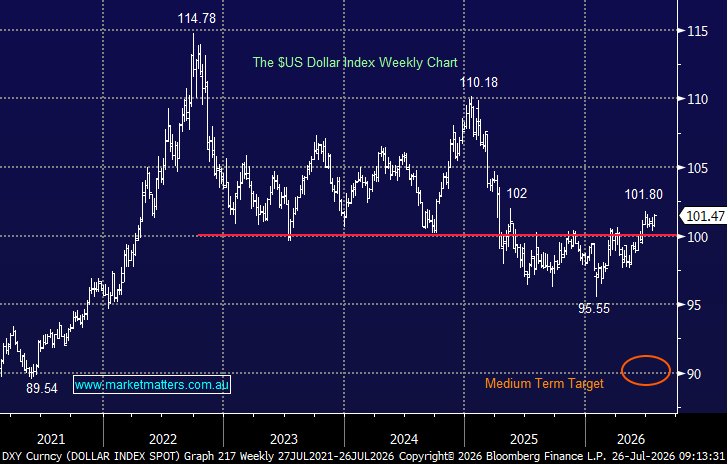
Hi James, gold stocks can often move in a different direction to the overall ASX200 depending on the reason for moves e.g. If stocks fall on interest rate concerns it’s bad for gold but conversely if it’s because of panic around North Korea then gold is likely to surge. We are bullish US interest rates and and think the $US is close to a major swing low, both usually negative for gold / gold stocks.
We are happy on the sidelines at present – a point of interest is July and Nov-Dec is seasonally the best times for gold.
Regis Resources (RRL) Chart
Overnight Market Matters Wrap
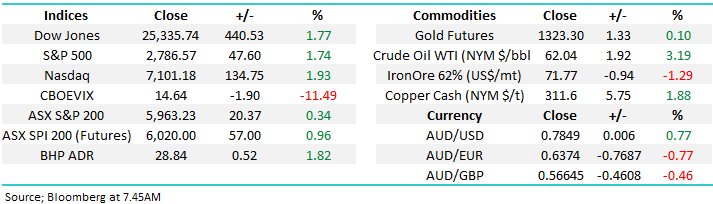
· US Risk was certainly back on the table over the weekend following the February non-farm payrolls data, with the major indices rallying over 1.7% led by the financial sector.
· Iron Ore however lost ground, down over 1% however, BHP is expected to outperform the broader market, after ending its US session up an equivalent of 1.82% to $28.84 from Australia’s previous close.
· The March SPI Futures indicating the ASX 200 to open 58 points higher towards the 6020 area this morning.
Disclosure
Market Matters may hold stocks mentioned in this report. Subscribers can view a full list of holdings on the website by clicking here. Positions are updated each Friday, or after the session when positions are traded.
Disclaimer
All figures contained from sources believed to be accurate. Market Matters does not make any representation of warranty as to the accuracy of the figures and disclaims any liability resulting from any inaccuracy. Prices as at 12/03/2018. 8.13AM
Reports and other documents published on this website and email (‘Reports’) are authored by Market Matters and the reports represent the views of Market Matters. The MarketMatters Report is based on technical analysis of companies, commodities and the market in general. Technical analysis focuses on interpreting charts and other data to determine what the market sentiment about a particular financial product is, or will be. Unlike fundamental analysis, it does not involve a detailed review of the company’s financial position.
The Reports contain general, as opposed to personal, advice. That means they are prepared for multiple distributions without consideration of your investment objectives, financial situation and needs (‘Personal Circumstances’). Accordingly, any advice given is not a recommendation that a particular course of action is suitable for you and the advice is therefore not to be acted on as investment advice. You must assess whether or not any advice is appropriate for your Personal Circumstances before making any investment decisions. You can either make this assessment yourself, or if you require a personal recommendation, you can seek the assistance of a financial advisor. Market Matters or its author(s) accepts no responsibility for any losses or damages resulting from decisions made from or because of information within this publication. Investing and trading in financial products are always risky, so you should do your own research before buying or selling a financial product.
The Reports are published by Market Matters in good faith based on the facts known to it at the time of their preparation and do not purport to contain all relevant information with respect to the financial products to which they relate. Although the Reports are based on information obtained from sources believed to be reliable, Market Matters does not make any representation or warranty that they are accurate, complete or up to date and Market Matters accepts no obligation to correct or update the information or opinions in the Reports.
If you rely on a Report, you do so at your own risk. Any projections are estimates only and may not be realised in the future. Except to the extent that liability under any law cannot be excluded, Market Matters disclaims liability for all loss or damage arising as a result of any opinion, advice, recommendation, representation or information expressly or impliedly published in or in relation to this report notwithstanding any error or omission including negligence.
To unsubscribe. Click Here