The UK / Europe seem to be moving on from BREXIT, but have stocks? (CYB, JHG)
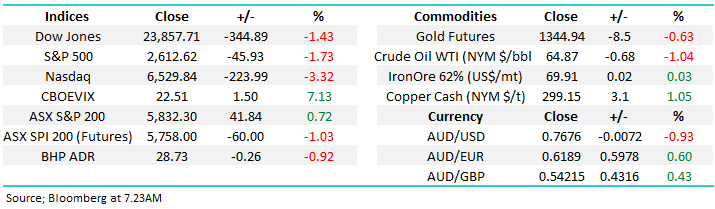
The ASX200 enjoyed a solid day yesterday rallying +0.7%, a decent performance considering we haven’t fallen as far as the US since the highs in January. The overall market was strong but again the heavyweight banking sector dragged the chain only gaining +0.2%, the sector remains down -2.9% for the last 5-days and down -6.9% for the month – the Royal Banking Commission is clearly hurting investors for now.
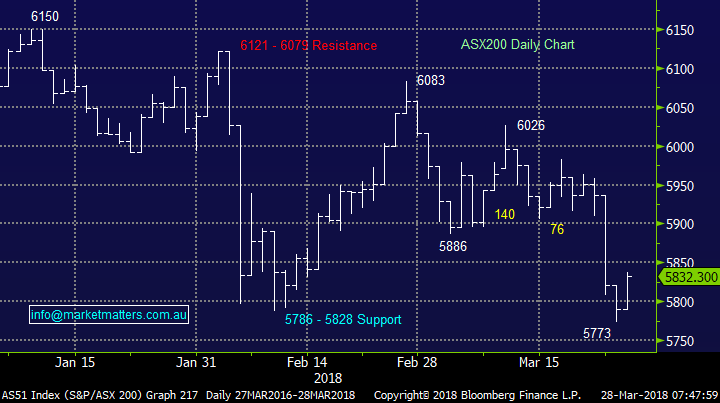
While we can envisage an ongoing bounce by the ASX200 to the 5850 area a close above 5900 is still required for MM to become bullish short-term.
Unfortunately following a sharp selloff in the last few hours by the US tech sector, which dragged the Dow down -344-points, all of yesterday’s gains locally are set to be lost early this morning. This time the damage was caused by a report that the Trump administration is considering a crackdown on Chinese companies investing in technologies which are considered sensitive to the US. The timing of this consideration following hot on the heels of the Facebook debacle is pretty optimum for the most dramatic impact on stocks but on balance this simply illustrates to us how vulnerable US stocks are to any negative news flow at these elevated levels.
Conversely European shares rallied the most in 6-weeks last night with both the UK’s FTSE and German DAX closing up +1.6%. This pretty dramatic differential in relative strength of stock markets across the Atlantic has renewed our thoughts around which is the best continent to be invested for Australians looking for some overseas exposure following BREXIT. Please note Europe did miss most of the US markets weakness overnight given the selloff was late.
Hence today’s report is going to focus on BREXIT and the related stocks on the ASX200.
ASX200 Chart
As mentioned previously US stocks had a poor session after promising so much early on, the S&P500 closed down -1.7% after being up +0.6% early in the day.
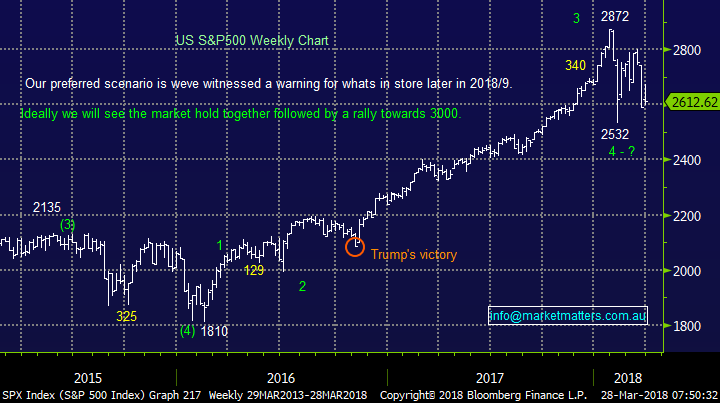
We currently remain neutral just here but our preferred scenario moving forward is still a doomed attempt to break upwards towards the psychological 3000 area.
The big “million dollar” question from a technical perspective is which structure is now “controlling” the market:
1. The Neutral Pattern between 2872 and 2532.
2. The bullish advance up from 1832.
3. The bearish decline from 2872.
US S&P500 Chart
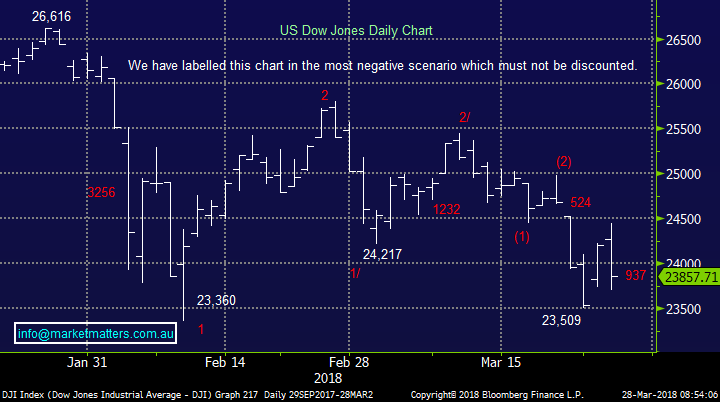
US Dow Jones Chart
The US or Europe?
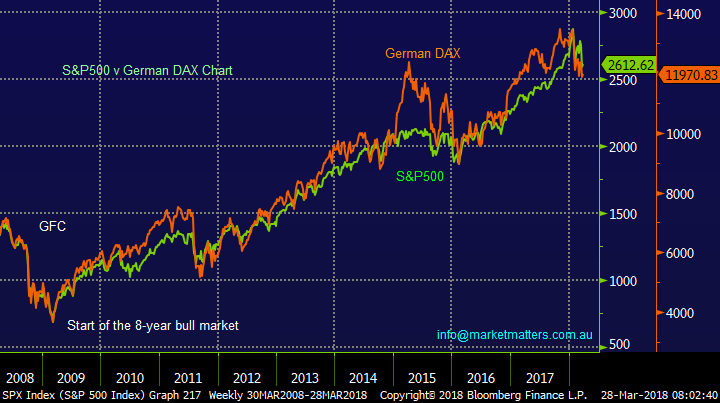
When we look at the comparison in performance of the US market and German DAX since the GFC the strong correlation is clearly evident, however right now one market does not look relatively cheaper / better than the other. In that environment, and for an Australian based investor, currency then becomes an important component to consider. Given our expectation that the $US is close to bottoming and has more upside versus the AUD than the Euro does our bias would be a slight skew towards the US, but only marginally and it’s only currency related.
S&P500 v German DAX Chart
BREXIT & our related stocks
Seasoned traders / investors regularly refer to the FX markets as the smartest because its where the most volume of $$ exchanges hands plus it’s not directly regulated hence people in the “know” can get set without as much fear of facing retribution.
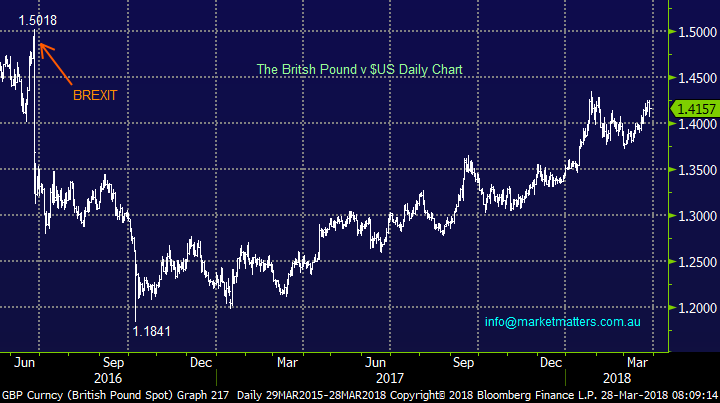
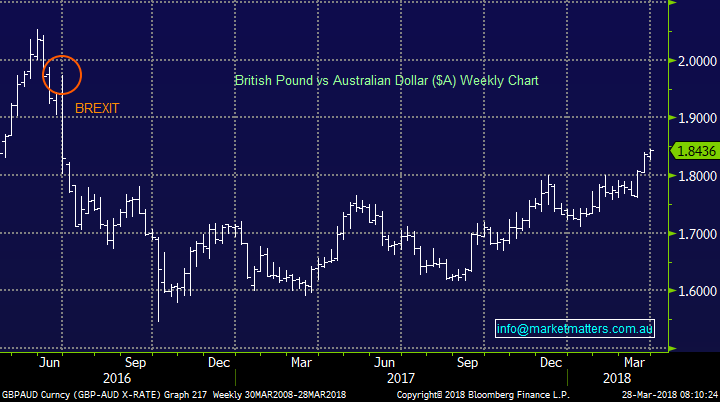
• The British Pound has regained over 80% of its losses versus the $US and just over 50% against the $A.
Undoubtedly the risks are very real with BREXIT but the outlook is improving with both Europe and the UK fighting towards the same ultimate goal - the main question being how much the UK pay to get there.
Also worth mentioning that there remains an outside possibility of another vote especially as it appears the result of the last one was influenced by social media – some saying this was illegal.
It seems clear that despite the result the UK would rather be part of the EU and no doubt this will be factored into the negotiations. In short, the closer to how things were previously the better for markets with immigration the only issue that most Brits talk about over there warm beer, the rest is simply noise to the average Brit!
British Pound v $US Chart
British Pound v $A Chart
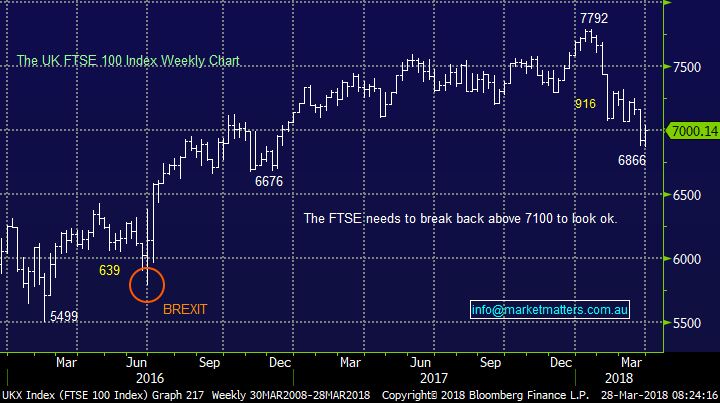
Firstly when we look at the FTSE its recovered pretty well closing 20% above its panic BREXIT lows of June 2016, significantly better than us with the ASX200 only up ~11% over the same timeframe.
• Hence we can conclude that both the UK’s currency (British Pound) and stock market (FTSE) have well and truly moved on from BREXIT.
We thus ask ourselves have the Australian stocks with the greatest links to the UK / BREXIT also moved on, especially considering the generally negative cloud hovering over our market. We own 2 stocks that are extremely correlated to BREXIT, especially considering their respective plunges following the vote back in June 2016.
The UK FTSE Chart
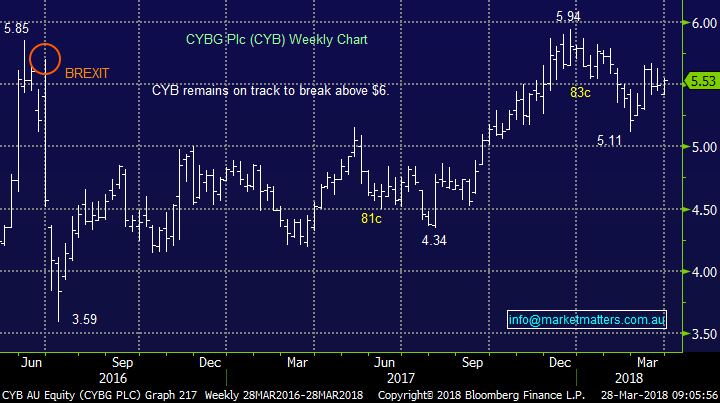
CYB has been a great bank investment on the local market rallying +23% for the year to yesterday while the ASX200 Banking Index is down a painful -8.2%.
However over the same period the UK FTSE’s banking sector has rallied +67% making the UK based CYB feel like a dog! CYB on the local market has regained most of its BREXIT losses and continues to look on track to again test the psychological $6 region. We feel its valuation of 13x 2018 earnings is not too onerous in today’s market.
• CYB is certainly one of our favourite 3 banks on the ASX200 and we remain comfortable with our holding.
CYBG Plc (CYB) Chart
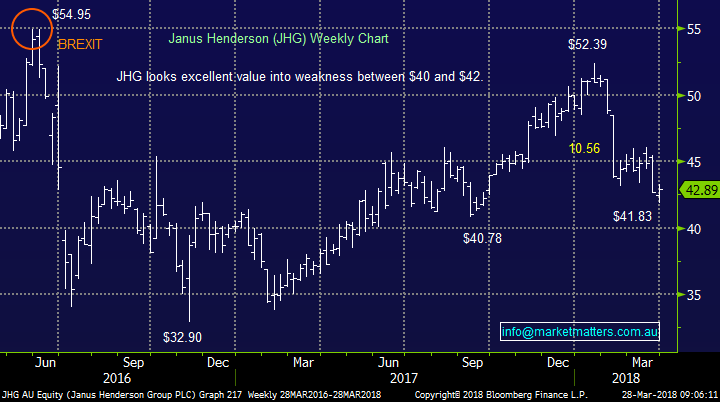
Janus Henderson (JHG) has endured a tough year in line with most local money managers e.g. over the last month JHG is -5.5%, Challenger (CGF) -7.6% and Perpetual (PPT) -9.3%.
The stock remans over 20% below its BREXIT high, significantly underperforming the equivalent stocks in the UK and globally. The stock is trading on a valuation of 11.3x which we believe is on the cheap side assuming global stock markets / assets can hold together – which remains a big ‘if’ at the stage.
• In today’s market, considering our medium-term bearish outlook, we are a buyer of JHG between $41 and $41.50 but a seller around $46-47.
Janus Henderson (JHG) Chart
Conclusion
We are comfortable both of our CYB and JHG holdings at present with sell targets around $6 and $47 respectively.
In terms of BREXIT generally, we see the chance of more positive news flow as opposed to negative – a refreshing feeling compared to Trump and the US!
Overnight Market Matters Wrap
• The US sold off overnight, led by the tech sector and notably Facebook (FB.US) being the laggard as the CEO is now expected to testify before the US House Energy and Commerce Committee.
• The defensives were the clear outperformers overnight, led by the utilities and telcos sector.
• On the commodities front, crude oil slid 1.04% lower, while copper gained back some confidence, up 1.05%.
• BHP in the closed down an equivalent of 0.92% from Australia’s previous close and we anticipate its rival, RIO to outperform after completing its sale of its coal assets this week.
• Local data today is the ANZ March business confidence, where we see investors to look over this and focus on the global macro picture.
• The June SPI Futures is indicating the ASX 200 to open 60 points lower, back sub the 5800 handle towards the 5770 area this morning.
Have a great day!
James & the Market Matters Team
Disclosure
Market Matters may hold stocks mentioned in this report. Subscribers can view a full list of holdings on the website by clicking here. Positions are updated each Friday, or after the session when positions are traded.
Disclaimer
All figures contained from sources believed to be accurate. Market Matters does not make any representation of warranty as to the accuracy of the figures and disclaims any liability resulting from any inaccuracy. Prices as at 28/03/2018. 8.26AM
Reports and other documents published on this website and email (‘Reports’) are authored by Market Matters and the reports represent the views of Market Matters. The MarketMatters Report is based on technical analysis of companies, commodities and the market in general. Technical analysis focuses on interpreting charts and other data to determine what the market sentiment about a particular financial product is, or will be. Unlike fundamental analysis, it does not involve a detailed review of the company’s financial position.
The Reports contain general, as opposed to personal, advice. That means they are prepared for multiple distributions without consideration of your investment objectives, financial situation and needs (‘Personal Circumstances’). Accordingly, any advice given is not a recommendation that a particular course of action is suitable for you and the advice is therefore not to be acted on as investment advice. You must assess whether or not any advice is appropriate for your Personal Circumstances before making any investment decisions. You can either make this assessment yourself, or if you require a personal recommendation, you can seek the assistance of a financial advisor. Market Matters or its author(s) accepts no responsibility for any losses or damages resulting from decisions made from or because of information within this publication. Investing and trading in financial products are always risky, so you should do your own research before buying or selling a financial product.
The Reports are published by Market Matters in good faith based on the facts known to it at the time of their preparation and do not purport to contain all relevant information with respect to the financial products to which they relate. Although the Reports are based on information obtained from sources believed to be reliable, Market Matters does not make any representation or warranty that they are accurate, complete or up to date and Market Matters accepts no obligation to correct or update the information or opinions in the Reports.
If you rely on a Report, you do so at your own risk. Any projections are estimates only and may not be realised in the future. Except to the extent that liability under any law cannot be excluded, Market Matters disclaims liability for all loss or damage arising as a result of any opinion, advice, recommendation, representation or information expressly or impliedly published in or in relation to this report notwithstanding any error or omission including negligence.
To unsubscribe. Click Here


