Does the market look / feel like a typical top?
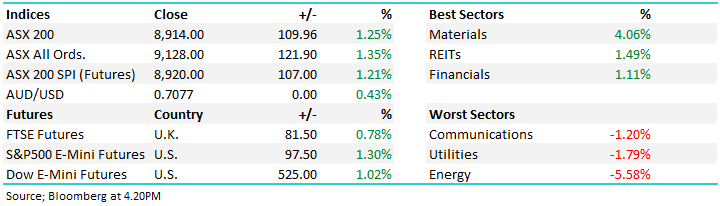
Up 40-points and then down 40-points, our market is feeling more like a yoyo at present as opposed to a healthily appreciating asset class. I feel like a broken record but the banks were again the major weight on the local market falling 1% while real estate had the best of a bad day rallying 0.4%.
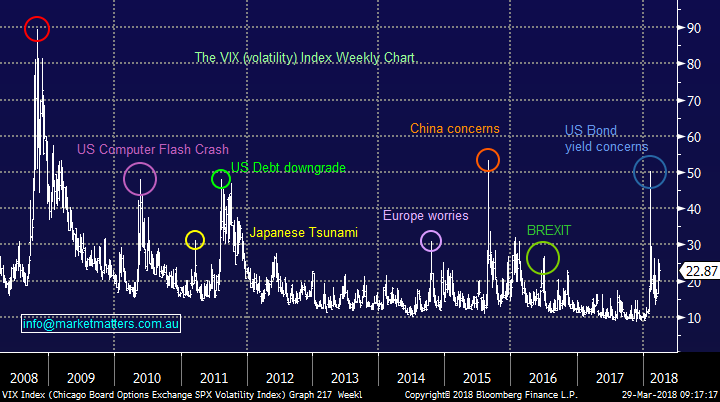
The volatility in equity markets is undoubtedly rising and last nights close by the Fear Index (VIX) around 23% is noticeably above the mean since the GFC. However, its what’s happening under the hood that’s catching our eye with one day’s golden stock rapidly becoming the target for aggressive selling the next e.g. yesterday A2 Milk (A2M) fell -7.5% and our own Orocobre (ORE) -4.7% after rallying strongly the prior session.
Volatility (Fear Index) VIX Chart
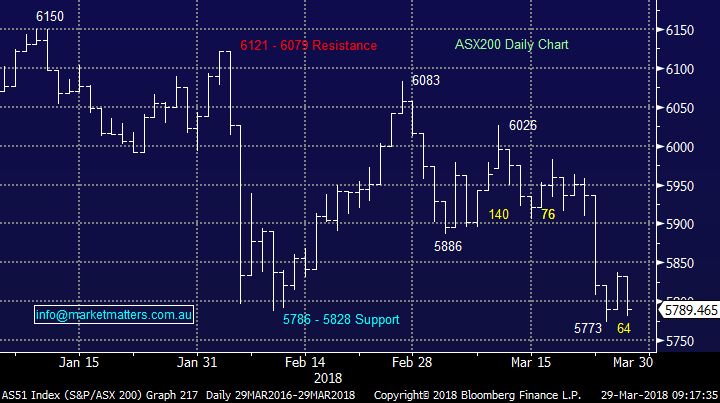
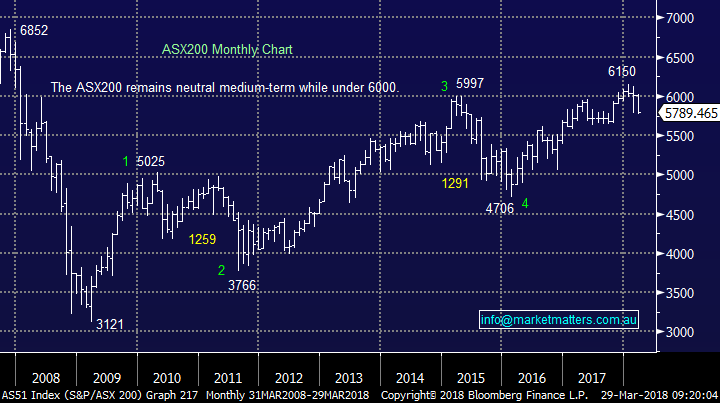
Following the failure of the ASX200 to hold above 5950 we’ve moved short-term neutral / negative stocks and we require a close back above 6030 to regain our bullish stance – not surprisingly there is no change to this view.
- MM remains currently a net seller of strength not a buyer of weakness.
In the short-term we can see the ASX200 trading in a choppy manner similar to the US market last night, in our case between 5850 and 5750.
Today’s report will look at some of the characteristics of significant market tops to weigh up the risks of staying on board this 9-year old bull market.
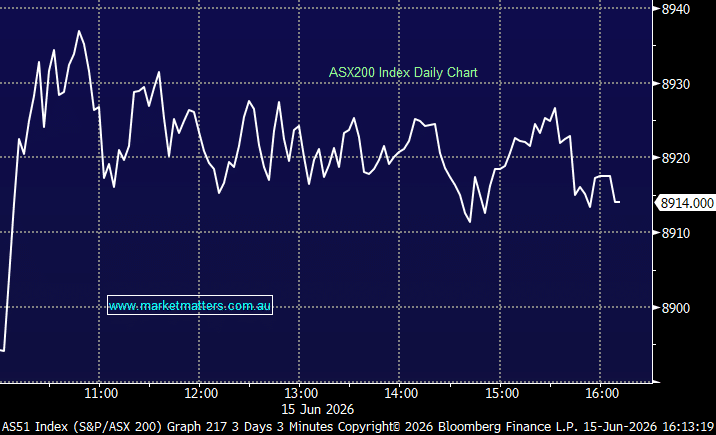
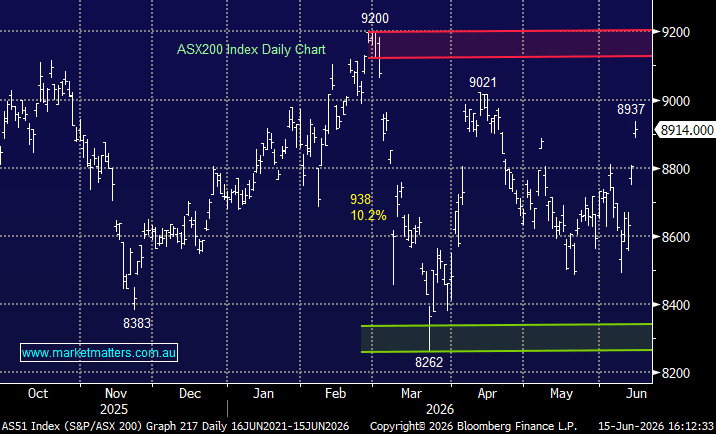
ASX200 Chart
Overnight the US market chopped around in a fairly wide 1.5% range however the main action was again concentrated in the previously high performing tech sector which closed down over 1% compared to the Dow which was unchanged.
The data fiasco at Facebook has led to an aggressive 24% correction in the social media giant, although it did bounce last night, the potential risks and escalating costs of data storage are rippling through the entire tech sector – the NASDAQ has now corrected -10.8%.
Markets simply hate government / regulators getting involved irrespective of the sectors – simply look at our banks although negative price in the last week has probably been driven by a rise in short term funding costs – a theme we discussed yesterday in the Income Report.
The Facebook front man, Mark Zuckerberg is due to testify to the US Senate next month about the companies “data scandal”, markets are rattled about the looming costs to protect data moving forward – again just think of the escalating compliance costs in Australian banking and finance!
As we’ve said before, historically when we see stocks plunge as they did in February, with an accompanied spike in volatility, the lows of the initial sell-off are usually tested. This morning the broad-based S&P500 is currently sitting less than 3% above the panic February low.
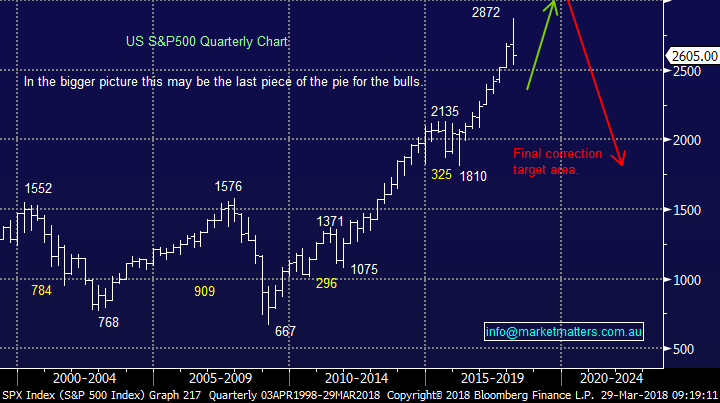
- The S&P500 remains in a neutral Pattern between 2532 and 2872.
US S&P500 Chart
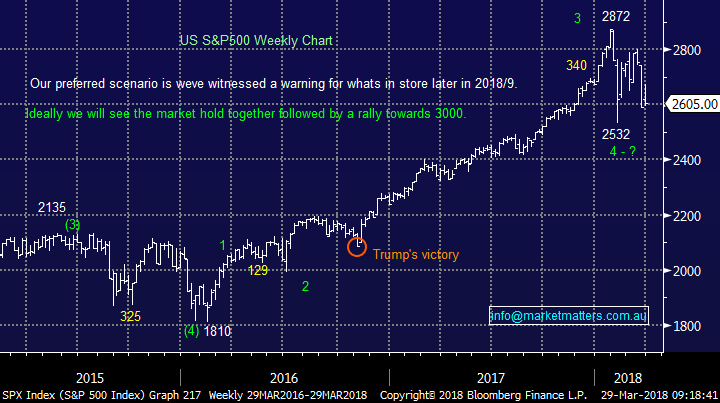
Our medium/long-term outlook for stocks remains pretty bearish targeting a +20% correction hence the current weakness / volatility is certainly testing our resolve with regards to our short-term view, for a final spike up in stocks to position ourselves defensively / negatively equities – hence the topic of today’s report.
US S&P500 Chart
Have we witnessed a stock market top?
Market tops should theoretically share a large degree of similarities because they are created by human emotions with the obvious cliché “Fear & Greed” jumping to mind. Over the 65-years before the GFC the average bull market in the US lasted just 56-months hence any investor who looks at statistics should have a degree of concern with the post GFC bull market which has been rolling along for 108-months.
At the start of the year, I read a lot of market outlook pieces (and put together one of our own) and simply, no one else that I read was calling equities lower in both 2018/9. That’s all well and good however but we have been looking for one more blow-off style top first, hence we’re low on cash (now) at a time when markets are looking vulnerable. Therefore, the question we must ask ourselves is what chance is there that January was as good as it gets in 2018?
Firstly, there are 2 very important points to remember from our analysis:
- We believe the ASX200 will break back under 5000 during the bear market that follows the GFC bull market, this move may have commenced i.e. at least 15% lower from yesterdays close.
- This pullback will provide the best buying opportunity in a decade for the prepared investor.
ASX200 Chart
We believe that when a bull market does come to an end it will have been preceded by an entirely different set of warnings to the previous ones but we have to work with what pieces of the jigsaw are available to us to make informed and reasonable risk / reward decisions.
Generally speaking, the stock market is an excellent leading economic indicator and we’ve been expecting rising interest rates to eventually break the back of the asset price explosion that the world has enjoyed especially since the GFC e.g. stocks, property, art, classic cars and even Bitcoin!
- Interest rates have actually been in a pronounced bear market since the heady 1980’s, we believe this market has bottomed for years to come.
US Fed Funds Rate Chart
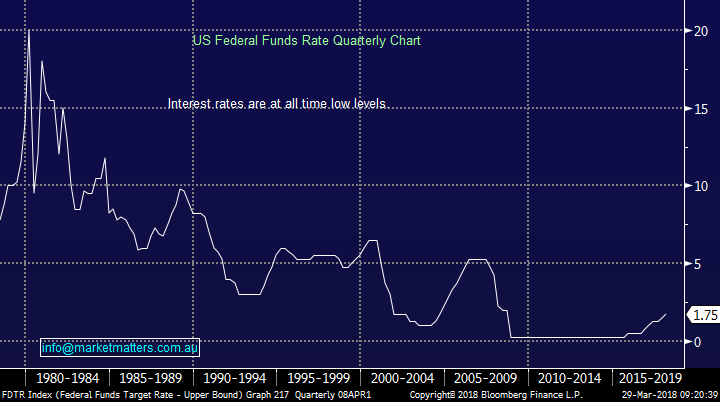
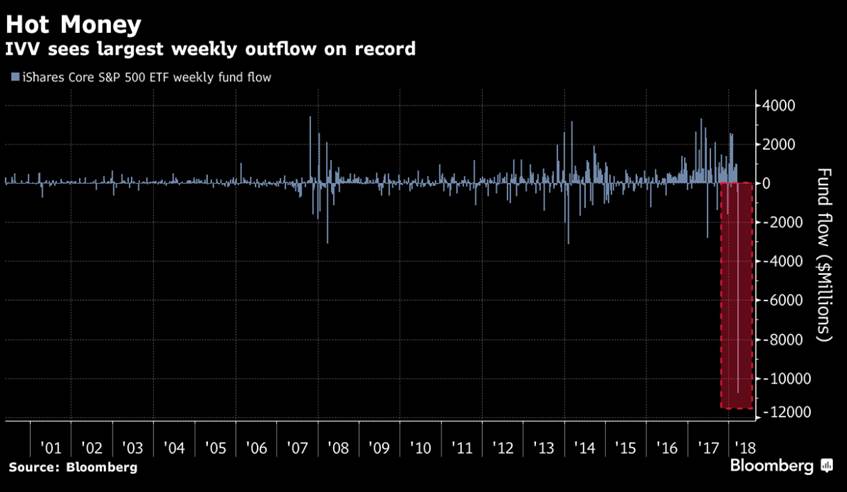
MM is sticking with our view at the start of 2018 that rising interest rates will break the back of global equities but the market volatility created by the antics of Trump, data leaks etc illustrates to us that stocks have become very vulnerable to bad news at these elevated levels. Just look at the flow out of the S&P 500 Index Fund in the US last week as markets came under pressure! Highlights the level of HOT money in the market.
The rotation of money from sector to sector during a bull market is quite normal and one that MM has benefitted from over recent years i.e. we see periods where different sectors come in and out of vogue, feels like we’re getting that day to day at present!
History shows us that during bull markets the defensive sectors - Healthcare (XLV), Consumer Staples (XLP) and Utilities (XLU) - normally under perform.
- Over the last 6-months these stocks have underperformed with only the utilities garnering some love over the last month.
Hence overall no alarm bells here.
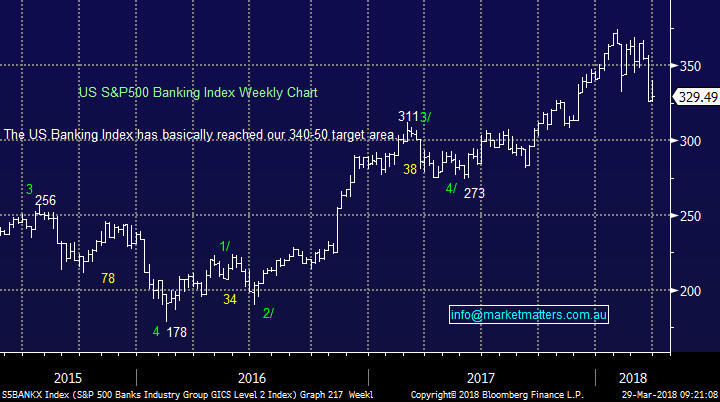
Personally, I look at the relative performance of financials as one of the most important and influential signs in evaluating the likely sustainability of a bull market, no surprise that the health of banks is important. Financials don't need to spearhead the market, but they should certainly not be a significant drag. In the US courtesy of Donald Trumps relaxation of regulations on the US banking / financial services the respective sectors have actually led the charge gaining +15.7% over the last year compared to the S&P500 which is up 11.6%.
- Similar to the overall market if the S&P500 banking Index can close above this week’s high moving forward the index will again look bullish i.e. +3% higher.
Unfortunately, as we all know the story is very different here in Australia where regulators are hammering our banks e.g. -7% this month alone.
S&P500 Banking Index
Two of our favourite indicators are sentiment and market reaction and to me these are giving mixed signals at present:
- Market sentiment – the press / market commentators alike are all rapidly turning bearish, this to us is usually a bullish indicator.
- Markets reaction to news – Stocks are reacting in-line with news i.e. bad news and stocks are tumbling and vice versa, a neutral indicator.
However, I would say stocks feel like they are falling easier than they rally which is no great surprise with fund managers holding relatively low cash levels.
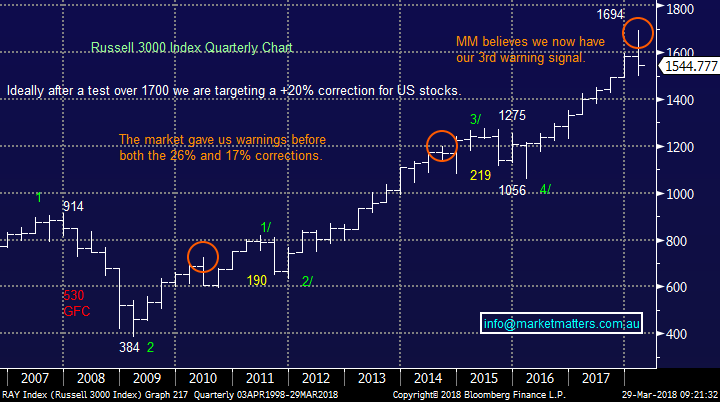
At the start of 2018 in our Outlook piece we predicted a sharp correction as a warning before one final rally by stocks to “jump off the train”. So far, the pullback has been a touch more aggressive than we anticipated but it has not deviated from our expected path although the local market is suffering badly because of the Royal Banking Commission and important, the weight of the banking sector on our broader index.
- As global equities have followed our anticipated path in our Outlook Piece we are not panicking - yet!
Russell 3000 Chart
Conclusion (s)
- We believe it’s now a 30% chance that we have seen a major market top for a few years.
- MM remains in overall “sell mode” and is unlikely to be net buyers in the foreseeable future from a simple risk / reward basis.
Overnight Market Matters Wrap
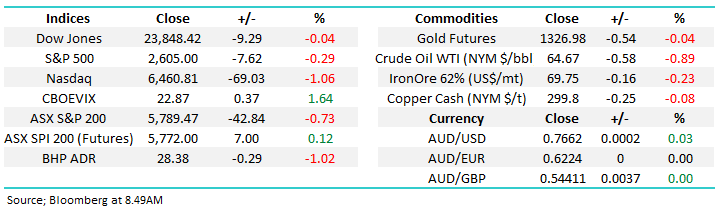
· A quiet session was seen overnight, with the broader market ending the day with little change, while the tech heavy, Nasdaq lost a further 1.06%.
· US oil stockpiles rose, nearly doubling analyst expectations. Oil fell to $US69.75/barrel.
· Iron ore lost further ground, while metals on the LME were mostly stronger.
· A quiet session is expected to be seen today ahead of the Easter long weekend, with the June SPI Futures is indicating the ASX 200 to open marginally lower, still testing the 5785 level this morning.
Have a great day!
James & the Market Matters Team
Disclosure
Market Matters may hold stocks mentioned in this report. Subscribers can view a full list of holdings on the website by clicking here. Positions are updated each Friday, or after the session when positions are traded.
Disclaimer
All figures contained from sources believed to be accurate. Market Matters does not make any representation of warranty as to the accuracy of the figures and disclaims any liability resulting from any inaccuracy. Prices as at 29/03/2018. 8.26AM
Reports and other documents published on this website and email (‘Reports’) are authored by Market Matters and the reports represent the views of Market Matters. The MarketMatters Report is based on technical analysis of companies, commodities and the market in general. Technical analysis focuses on interpreting charts and other data to determine what the market sentiment about a particular financial product is, or will be. Unlike fundamental analysis, it does not involve a detailed review of the company’s financial position.
The Reports contain general, as opposed to personal, advice. That means they are prepared for multiple distributions without consideration of your investment objectives, financial situation and needs (‘Personal Circumstances’). Accordingly, any advice given is not a recommendation that a particular course of action is suitable for you and the advice is therefore not to be acted on as investment advice. You must assess whether or not any advice is appropriate for your Personal Circumstances before making any investment decisions. You can either make this assessment yourself, or if you require a personal recommendation, you can seek the assistance of a financial advisor. Market Matters or its author(s) accepts no responsibility for any losses or damages resulting from decisions made from or because of information within this publication. Investing and trading in financial products are always risky, so you should do your own research before buying or selling a financial product.
The Reports are published by Market Matters in good faith based on the facts known to it at the time of their preparation and do not purport to contain all relevant information with respect to the financial products to which they relate. Although the Reports are based on information obtained from sources believed to be reliable, Market Matters does not make any representation or warranty that they are accurate, complete or up to date and Market Matters accepts no obligation to correct or update the information or opinions in the Reports.
If you rely on a Report, you do so at your own risk. Any projections are estimates only and may not be realised in the future. Except to the extent that liability under any law cannot be excluded, Market Matters disclaims liability for all loss or damage arising as a result of any opinion, advice, recommendation, representation or information expressly or impliedly published in or in relation to this report notwithstanding any error or omission including negligence.
To unsubscribe. Click Here