A quick stock market overview following the Easter break
The local market enjoyed a 4-day break as we all celebrated Easter in our own ways – mine was spent with the family and a group of good friends up the coast, with a huge contingent of chocolate infused kids! However the US just kept on trundling along, with markets open on both Good Friday and Easter Monday, and the volatility was huge in the relatively thin markets:
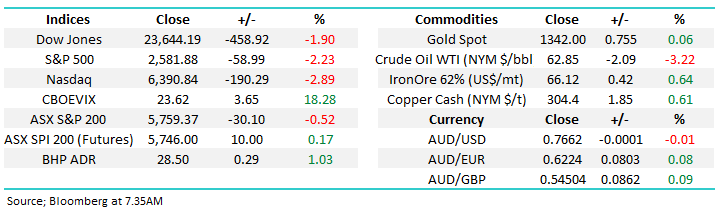
- Good Friday – The Dow rallied 255-points, although it was up 465-points at one stage.
- Easter Monday – The Dow fell 458-points but was down a significant 768-points at one stage.
I was thinking about today’s note driving back to Sydney in the torrential rain last night however last night’s trade in the US was again dominated by the creation of short term uncertainty and they currently have to fret for the next 3-days until the US President announces the details of his $US60bn tariffs “attack” on China.
Donald Trump enjoyed a family gathering at the White House over Easter, but it didn’t stop him rattling markets with his ongoing Tweets around China / trade plus Amazon has now became his new target. I’m not sure if he’s jealous of Jeff Bezos whose worth well over $100bn as Amazon goes from strength to strength but the content of much of his tweets around the cost to Amazon to deliver parcels etc. seemed simply misguided! His attacks on the goliath on-line retailer was reflected by the tech NASDAQ leading the weakness overnight with Amazon falling -5.2% - the US president is moving stocks and the market around more than Gordon Gecko – and I reckon he’s probably liking it.
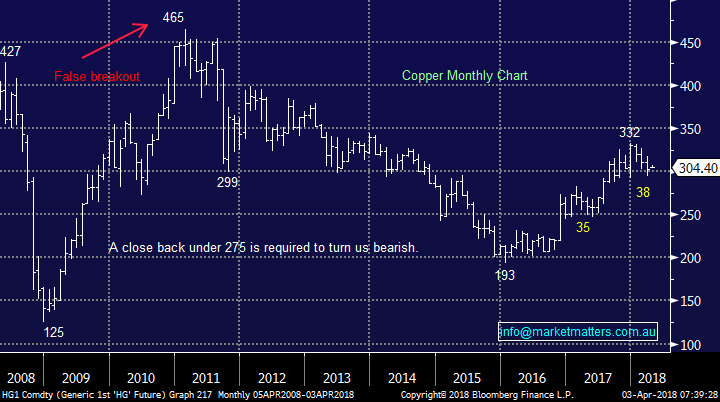
It’s hard this morning to gauge where the local market will open as the SPI futures have been closed for Easter but our best guess is down ~60-points to test the psychological 5700 area. Over the last few nights the moves in commodities, led by copper, has been constructive and we note BHP closed up over 1% last night in the US compared to its local close last Thursday.
- We are bullish copper at current levels targeting ~$US340/lb, or 10% higher.
A bullish looking copper chart is clearly very promising for our resources stocks and outperformance by the ASX200 compared to the US. OZ Minerals (OZL) should theoretically be significant benefactor with gold also rallying close to $US20/oz last night – we remain long OZL with our target still ~$10.
Yesterday China announced its first manufacturing growth since November as the world’s strongest economic engine kicked back into gear following the Chinese New Year. The strength of the growth well and truly beat analysts’ estimates and along with the economic strength in the US it’s easy to lay the strong foundations for a bullish fundamental argument for stocks with the exception of a trade war wildcard.
Copper Chart
1 Time to go out on a limb:
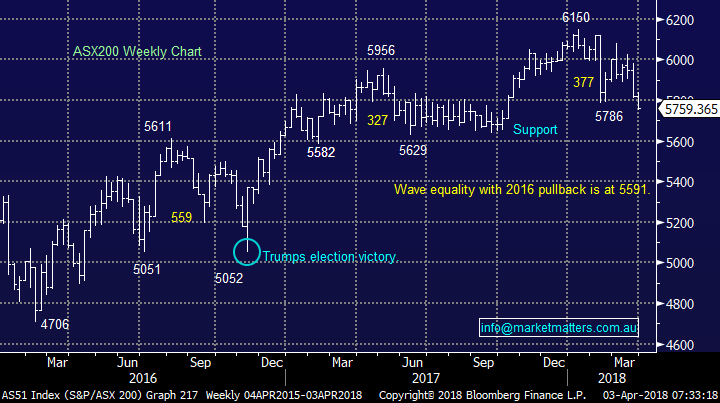
- We are short-term bullish local stocks liking the ASX200 between 5650 and 5700 and especially if it tests major support ~5600.
The current correction in the ASX200 resembles extremely closely to that experienced by the local market in 2016 prior to the market finding a significant low in November, following the surprise US election result. If the pattern similarity continues a spike down towards 5650/5700 will become a buying opportunity which will be confirmed by a close back above 5800.
*Hence be prepared we may well be small buyers early this week...
Not surprisingly today’s report is going to focus on both how we see stock markets at present and more importantly how we plan to “play” them into the end of the financial year – above is the first clue.
As subscribers know MM was the only market pundit we could find who was calling stocks lower in 2018 but after buying Februarys spike down below 5800 we now arguably find ourselves too long stocks which we believe will correct back well under 5000 over the coming few years. However there’s a big difference between our view over the next 1-2 months and the next 1-2 years.
ASX200 Chart
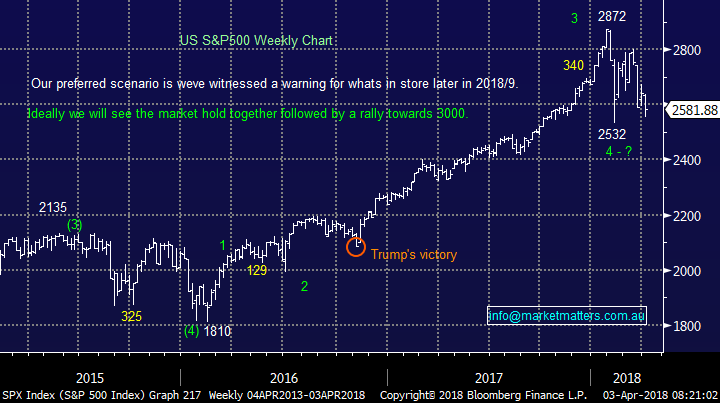
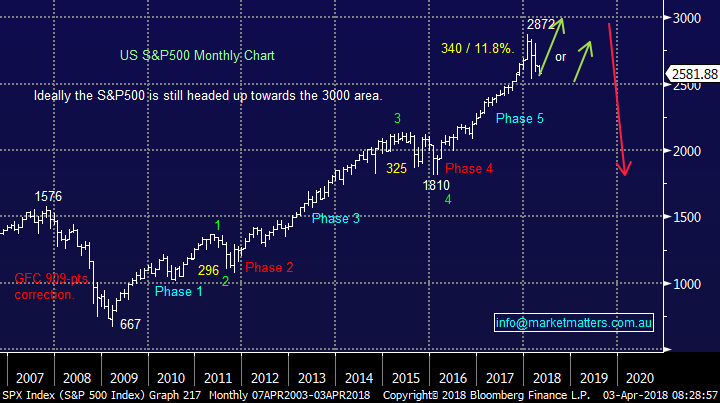
As mentioned previously US stocks had a poor session after looking so good on Friday. We currently remain neutral just here but our preferred scenario moving forward is still a doomed attempt to break upwards towards the psychological 3000 area.
The big “million dollar” question from a technical perspective remains which structure in now “controlling” the market:
- The Neutral Pattern between 2872 and 2532.
- The bullish advance up from 1832.
- The bearish decline from 2872.
US S&P500 Chart
2 Time to go out on a limb again:
We are bullish short-term with 2 anticipated scenario’s moving forward:
- The broad based S&P500 will bounce soon and rally towards fresh all-time highs, ideally towards the psychological 3000 area before tumbling well over 20%.
- The same S&P500 has already finished its post GFC bull market, in January, and a bounce from current areas will fail to make fresh all-time highs before falling over 20%.
Obviously it’s a critical time for stocks but from a risk / reward perspective we are bullish at current levels while remaining very wary of our more dominate thesis moving forward.
US S&P500 Chart
Conclusion
We are short-term buyers and medium-term sellers of stocks.
Overnight Market Matters Wrap
· Risk remained on the table yet again as the selloff resumed in the US, particularly in the tech stocks thanks to DT
· On the commodities front, gold futures rallied 1.32 %, while crude oil slid 3.22%.
· BHP is expected to outperform the broader market after rallying in the US up an equivalent of 1.03% from Australia’s previous close.
· M&A activity – Santos (STO) has reportedly been approached by Harbour Energy again, for a cash bid of $6.50 a share, a premium of ~29.50% from its previous close of $5.02.
· The RBA meets today with no change expected at 1.50%
Have a great day!
James & the Market Matters Team
Disclosure
Market Matters may hold stocks mentioned in this report. Subscribers can view a full list of holdings on the website by clicking here. Positions are updated each Friday, or after the session when positions are traded.
Disclaimer
All figures contained from sources believed to be accurate. Market Matters does not make any representation of warranty as to the accuracy of the figures and disclaims any liability resulting from any inaccuracy. Prices as at 03/04/2018. 7.35AM
Reports and other documents published on this website and email (‘Reports’) are authored by Market Matters and the reports represent the views of Market Matters. The MarketMatters Report is based on technical analysis of companies, commodities and the market in general. Technical analysis focuses on interpreting charts and other data to determine what the market sentiment about a particular financial product is, or will be. Unlike fundamental analysis, it does not involve a detailed review of the company’s financial position.
The Reports contain general, as opposed to personal, advice. That means they are prepared for multiple distributions without consideration of your investment objectives, financial situation and needs (‘Personal Circumstances’). Accordingly, any advice given is not a recommendation that a particular course of action is suitable for you and the advice is therefore not to be acted on as investment advice. You must assess whether or not any advice is appropriate for your Personal Circumstances before making any investment decisions. You can either make this assessment yourself, or if you require a personal recommendation, you can seek the assistance of a financial advisor. Market Matters or its author(s) accepts no responsibility for any losses or damages resulting from decisions made from or because of information within this publication. Investing and trading in financial products are always risky, so you should do your own research before buying or selling a financial product.
The Reports are published by Market Matters in good faith based on the facts known to it at the time of their preparation and do not purport to contain all relevant information with respect to the financial products to which they relate. Although the Reports are based on information obtained from sources believed to be reliable, Market Matters does not make any representation or warranty that they are accurate, complete or up to date and Market Matters accepts no obligation to correct or update the information or opinions in the Reports.
If you rely on a Report, you do so at your own risk. Any projections are estimates only and may not be realised in the future. Except to the extent that liability under any law cannot be excluded, Market Matters disclaims liability for all loss or damage arising as a result of any opinion, advice, recommendation, representation or information expressly or impliedly published in or in relation to this report notwithstanding any error or omission including negligence.
To unsubscribe. Click Here


