Keeping our fingers on the pulse (AWC, WPL, BHP, CYB, RIO)

The ASX200 had another great day making our Weekend Report look smack on the money as we commence “hump day”, unfortunately as we know this news driven market can potentially change sentiment in a matter of a tweet. The strength in the local market was strongly driven by the “risk on” stocks as fears of a US-China trade war faded following China’s Xi’s intelligent keynote address on global trade – we saw banks, energy and resources surge while the defensive healthcare sector drifted lower.
China’s Xi in my opinion won a strategic game of political chess with Trump yesterday in his speech by warning of a return to a “cold war mentality” and pledging a “new phase of opening up”, what else was Trump to do overnight but praise President Xi to avoid looking anti global trade, this victory by Xi was clearly extremely market positive.
Our overall short-term bullish outlook for stocks based on old fashioned valuations remains on track as US reporting season looms in the near future – a good set of numbers from corporate America could easily return the markets focus to synchronised global growth leading to increased optimism and hence pushing up stocks towards their January 2018 high, now ~7.5% away for the broad US S&P500.
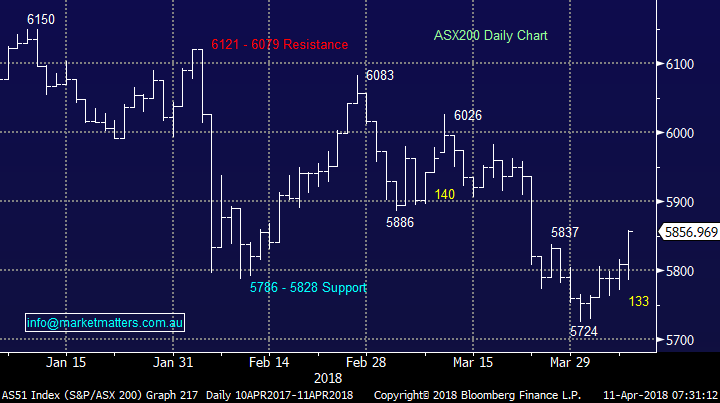
We’ve had our anticipated bounce by the ASX200 to the 5850 area but a close above 5900 is still required for MM to become bullish short-term, conversely a break back below 5800 would now be of concern technically.
Today’s report is going to take a close look at a few important aspects of today’s market to ensure we don’t miss opportunities when they present themselves. NB Remember due to our medium-term outlook for stocks we are far more likely to press the button on sell opportunities as opposed to buy ones.
ASX200 Chart
Overseas Markets
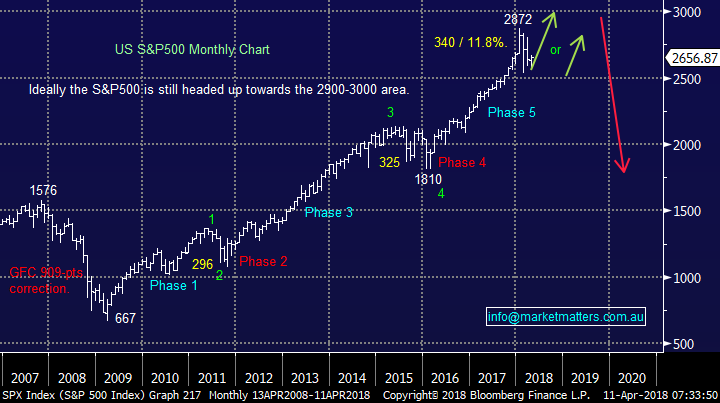
Overnight the US broad based S&P500 rallied strongly +1.67% to continue the choppy trading action since February, between 2872 and 2532. From our technical perspective the more time the S&P500 spends between 2600 and 2800 the greater the potential for a renewed rally to fresh all-time highs.
Overall we must remain neutral just here but our preferred scenario moving forward still remains a doomed attempt to break upwards towards the psychological 2900-3000 area.
US S&P500 Chart
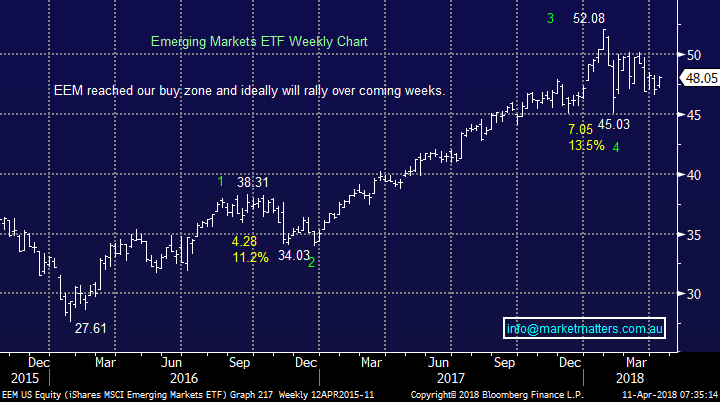
The Emerging Markets, which are highly correlated to our resources sector, also enjoyed a strong night rallying almost +2%. We remain bullish the EEM targeting fresh 2018 highs, a bullish sign for both local heavyweight BHP and RIO.
NB Overnight BHP closed at $29.50 in the US, up a healthy +2.1%.
Emerging Markets (EEM) ETF Chart
Now to again look at a number of markets / stocks who have behaved themselves during these periods of uncertainty to be within striking distance of potential “action” areas for MM moving forward.
It’s very important to keep “our fingers on the pulse” as we saw with Alumina (AWC) yesterday which fell over 2% within a few minutes of MM sending out our alert – unfortunately I’m sure a number of subscribers will have missed the sell level even though we flagged it in our Morning Report. To us this felt like a classic case of aggressive profit taking and no reason to panic out at lower levels. As I suggested yesterday afternoon, we were not filled on the bulk of the portfolio holdings simply because the market moved too quickly.
NB If we believe a market should be chased lower / higher following an alert we will send out a second alert.
1 Alumina (AWC) $2.59
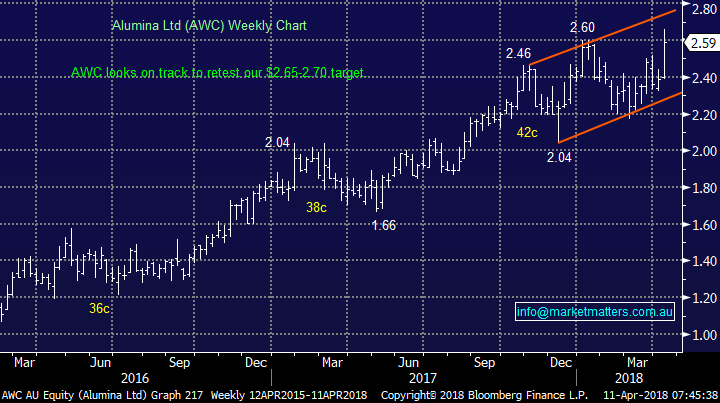
As discussed yesterday AWC is enjoying a number of tailwinds today but when everything looks the most rosy its very often the optimum time to take profit on stocks.
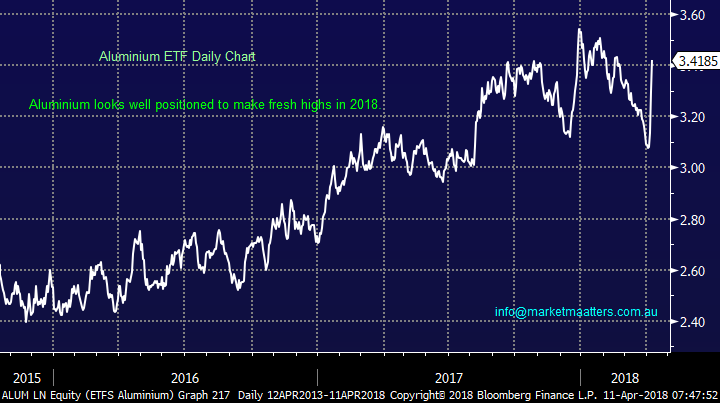
The supply disruptions caused by US sanctions on Russian oligarchs, following Trumps sanctions and China’s pollution dictated supply constraints may just be creating the final spike we are looking for i.e. only a few % higher and last night Alcoa surged almost 7%, a test of the $2.65-2.70 region again feels likely by AWC today.
Our profit target remains ~$2.65 for anyone that missed out yesterday we would still follow our plan and sell – remember we are overweight resources and are medium-term negative equities.
Alumina (AWC) Chart
Aluminium ETF Chart
2 The $US Index 89.65
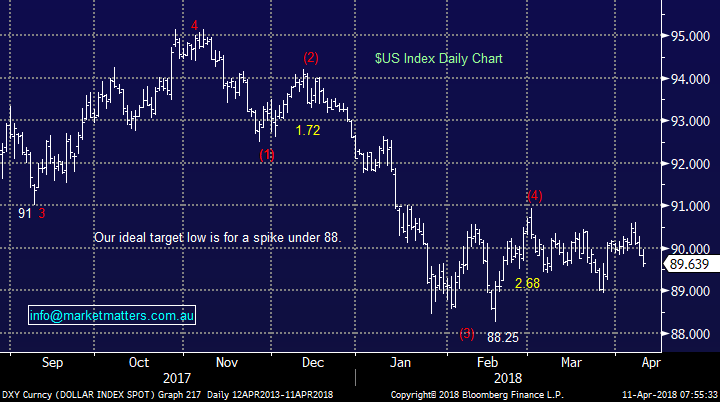
The $US continues to tread water between the 88 support and 91 resistance area.
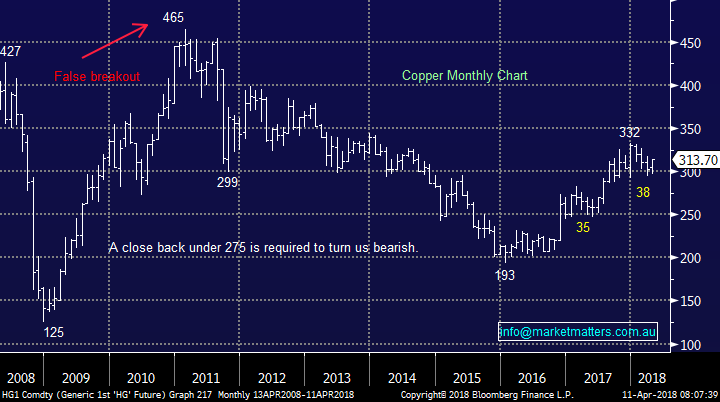
When we see a period of minor weakness in the $US, like this week, we are seeing very strong performance from the underlying $US priced commodities e.g. last night crude oil +3.4% and copper +2.1%.
- We are bullish copper targeting ~8% higher levels – theoretically good news for our OZ Minerals position.
- Hence by default a little further weakness by the $US feels likely.
MM remains a buyer of a spike down to / under the 88 support area in the $US to average our position in the Beta Shares $US ETF.
$US Index Chart
Copper Chart
3 Crude Oil
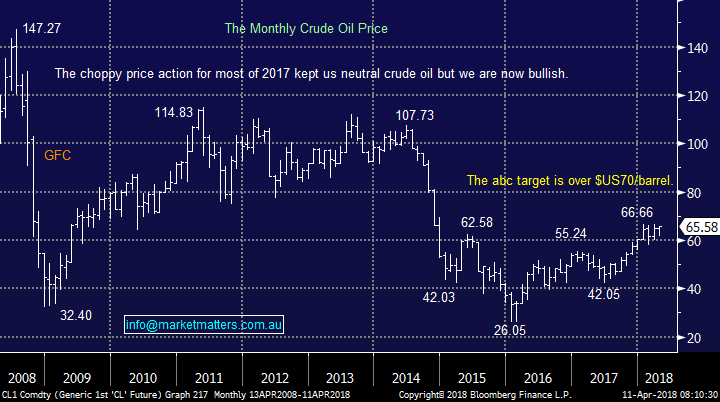
Crude Oil surged over 3% last night taking the US Energy Sector up by a similar magnitude. Saudi Arabia have started banging the drum for $80 per barrel oil, however this comes as the Arab state tries to get the most favourable valuation for the proposed IPO of state owned energy behemoth Aramco.
- MM remains bullish crude oil targeting the $US70/barrel area – I think that Saudi Arabia are being a touch optimistic while talking their book.
We have 2 positions with a strong correlation to the oil price both of which closed significantly below their 2018 high yesterday, even with crude close to 3 ½ year highs. Perhaps the pending IPO of Aramco has led to some selling in global energy stocks by fund managers to enable them to allocate cash when it comes onto the market.
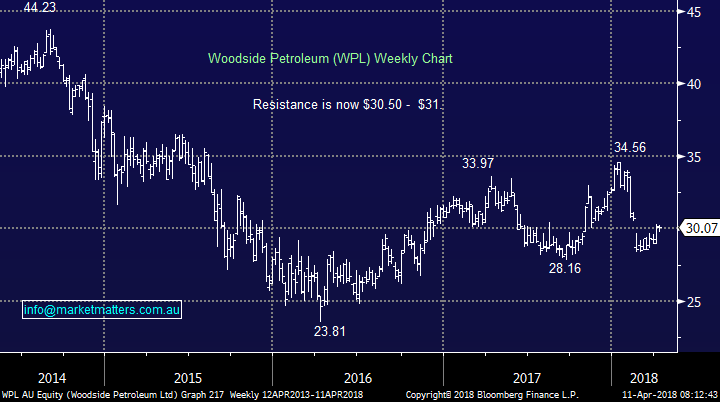
1 Woodside (WPL) closed 13% below its 2018 high, not helped by its recent large capital raising – we are seriously considering realising a small profit ~$31.
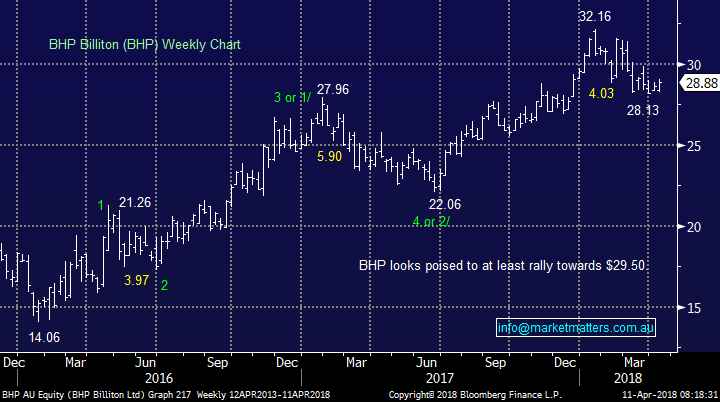
2 BHP Billiton (BHP) closed 10% below its high, we’ve been looking for the $29.50-$30 area for BHP but with the potential to make fresh 2018 highs.
We prefer BHP to WPL even after recent slight outperformance hence taking a small profit on our “trouble position” WPL, increasing our cash position as planned, will give us comfort to give the larger BHP holding some room to run.
Crude Oil Chart
Woodside Petroleum (WPL) Chart
BHP Billiton (BHP) Chart
4 CYBG Plc (CYB) $5.71
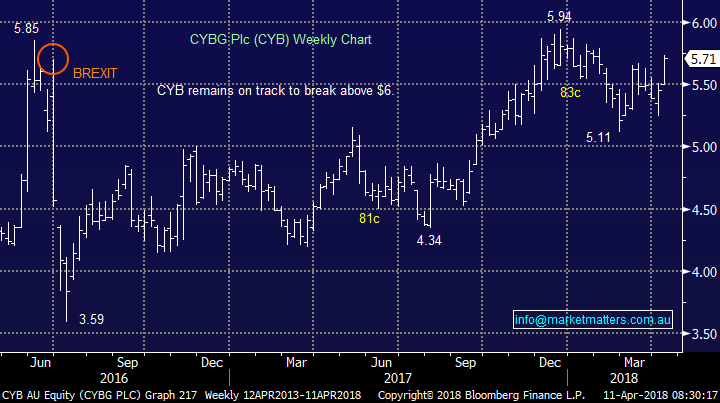
We touched on CYB in yesterday’s report but following its strong rally felt it was prudent to clarify our stance at this point in time.
We remain bullish CYB and do not intend to take profit on our position until we see a break over the psychological $6 area.
CYBG Plc (CYB) Chart
5 RIO Tinto $75.50
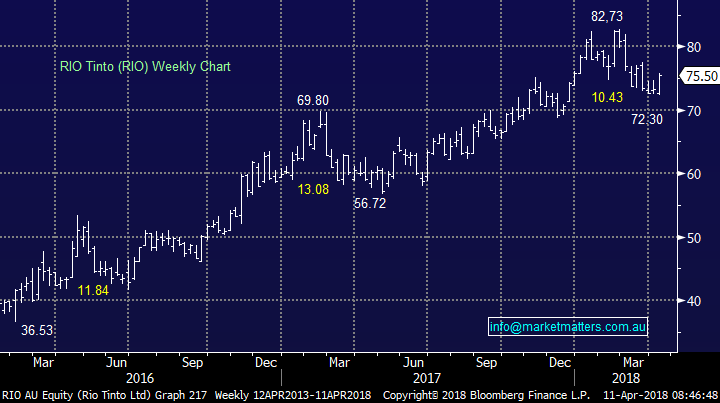
Our RIO position is still showing us a 5% paper profit after the 25% decline by iron ore which makes us feel good around our entry timing but our confidence with the bulk commodity moving forward is mixed at best.
MM is considering taking profit on our RIO position between $77.50 and $78 again giving us comfort to “run” our larger and preferred position in BHP.
RIO Tinto (RIO) Chart
Conclusion
- We remain sellers of strength in general and will be following the plans in the 5 points outlined above.
Watch for alerts.
Overnight Market Matters Wrap
· Risk is certainly back on, as US investors followed Asia’s lead and rallied over 1.5% across all 3 major indices in response to Xi Jinping’s conciliatory trade remarks on Tuesday.
· Commodities were sharply stronger on the back of moderating trade-war concerns, with iron ore, copper and aluminium all in positive territory. These stronger prices saw the AUD 0.8% higher with BHP expected to outperform the broader market today after ending its US session up an equivalent of 2.05% from Australia’s previous close.
· Both Brent and Crude oil prices appreciated some 3% after Saudi Arabia have talked up the possibility of $80 per barrel oil prices. This comes as the Arab state tries to get the most favourable valuation in the public markets for the proposed IPO of state owned energy behemoth Aramco.
· The June SPI Futures is indicating the ASX 200 to open with little change, testing the 5860 level this morning.
Have a great day!
James & the Market Matters Team
Disclosure
Market Matters may hold stocks mentioned in this report. Subscribers can view a full list of holdings on the website by clicking here. Positions are updated each Friday, or after the session when positions are traded.
Disclaimer
All figures contained from sources believed to be accurate. Market Matters does not make any representation of warranty as to the accuracy of the figures and disclaims any liability resulting from any inaccuracy. Prices as at 11/04/2018. 8.26AM
Reports and other documents published on this website and email (‘Reports’) are authored by Market Matters and the reports represent the views of Market Matters. The MarketMatters Report is based on technical analysis of companies, commodities and the market in general. Technical analysis focuses on interpreting charts and other data to determine what the market sentiment about a particular financial product is, or will be. Unlike fundamental analysis, it does not involve a detailed review of the company’s financial position.
The Reports contain general, as opposed to personal, advice. That means they are prepared for multiple distributions without consideration of your investment objectives, financial situation and needs (‘Personal Circumstances’). Accordingly, any advice given is not a recommendation that a particular course of action is suitable for you and the advice is therefore not to be acted on as investment advice. You must assess whether or not any advice is appropriate for your Personal Circumstances before making any investment decisions. You can either make this assessment yourself, or if you require a personal recommendation, you can seek the assistance of a financial advisor. Market Matters or its author(s) accepts no responsibility for any losses or damages resulting from decisions made from or because of information within this publication. Investing and trading in financial products are always risky, so you should do your own research before buying or selling a financial product.
The Reports are published by Market Matters in good faith based on the facts known to it at the time of their preparation and do not purport to contain all relevant information with respect to the financial products to which they relate. Although the Reports are based on information obtained from sources believed to be reliable, Market Matters does not make any representation or warranty that they are accurate, complete or up to date and Market Matters accepts no obligation to correct or update the information or opinions in the Reports.
If you rely on a Report, you do so at your own risk. Any projections are estimates only and may not be realised in the future. Except to the extent that liability under any law cannot be excluded, Market Matters disclaims liability for all loss or damage arising as a result of any opinion, advice, recommendation, representation or information expressly or impliedly published in or in relation to this report notwithstanding any error or omission including negligence.
To unsubscribe. Click Here


