Keeping our fingers on the pulse – Part 2 (WPL, ORE, JHG, QBE, TLS)
The ASX200 had a disappointing day if you live in the present but markets don’t, they look forward. We closed down 28-points following the Dow’s rally of well over 400-points, but we had done our work on Tuesday and most Asian markets were focusing on a likely US-Russia standoff or worse over Syria, plus the much anticipated Fed minutes outlining their likely path of rate hikes moving forward. The end result this morning shows our market was correct to show caution yesterday and importantly not to become too euphoric following the Dow’s surge on Tuesday night. Remember at MM we are cautiously bullish stocks from current levels, but definitely not chasers of strength.The initial outcome from of the overnight news / “tweets” is in 2 halves:
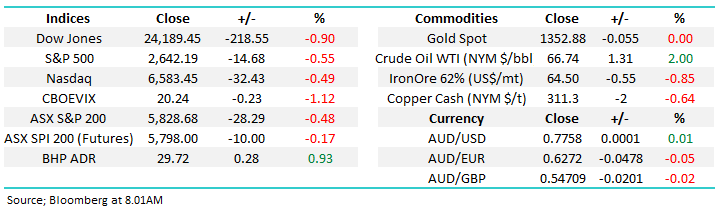
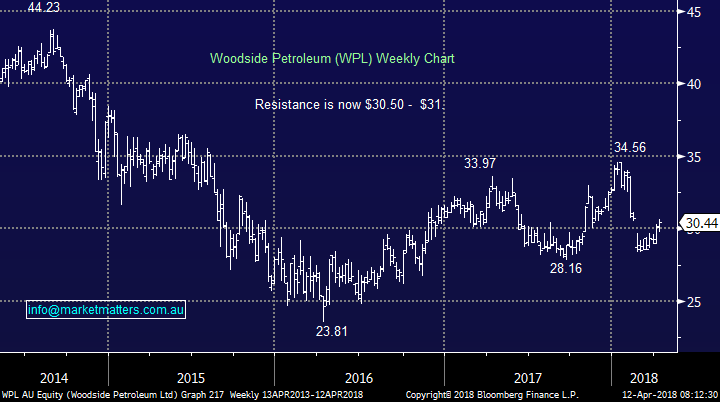
- Crude oil surged another +1.9% to its highest level since 2014 on concerns around Syria / Russia, we are still looking to sell our Woodside (WPL) holding between $30.50 and $31.00 – yesterday it closed at $30.44.
- The Fed were slightly “Hawkish” suggesting interest rates may rise faster than many have predicted – a thumbs up to the economy but some sectors are likely to struggle on this news i.e. the “yield play” stocks.
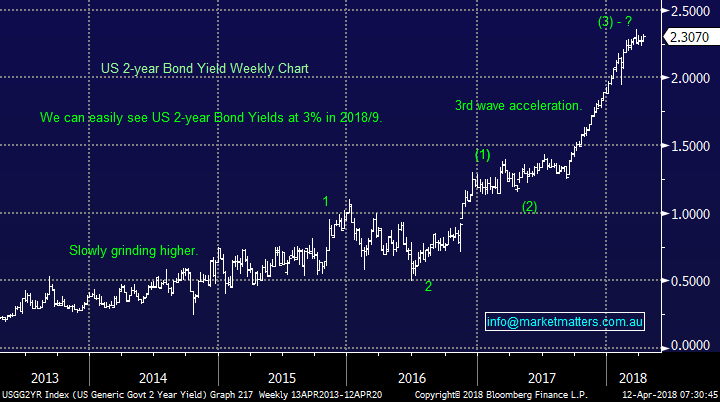
Interestingly, following the Fed minutes overnight, US 2-year bond yields did not make fresh highs for 2018 so the markets telling us there was no great surprise from the statement even though the press in most finance say otherwise. Our view is US bond yields are ready to take a breather at current levels – they want to see how all the political turmoil unfolds i.e. trade wars, Syria plus of course what Trump has in store next!
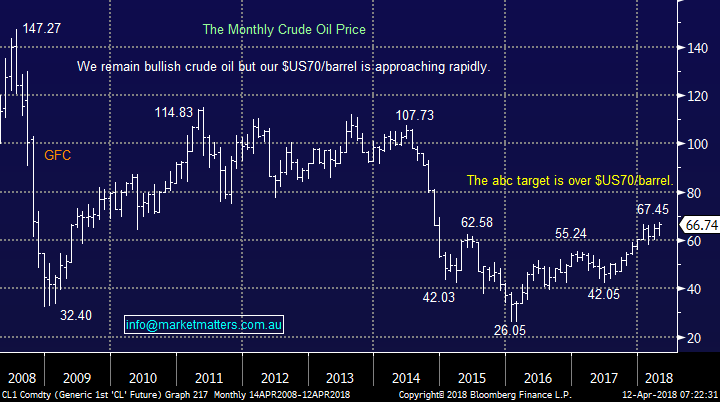
Crude Oil Chart
US 2-year bond yield Chart
Trump’s tweets overnight were extremely provocative and directed straight at Russia – the Russian Ruble is down 7% over the last 3-days. Trump does love a tweet and I continue to wonder if he’s long shares in Twitter which are up over 22% in 2018 alone. This morning, the ASX200 is looking to open marginally lower with support again likely from BHP which closed up almost 1% in the US.
Our overall short-term bullish outlook for stocks based on old fashioned valuations remains on track as US reporting season looms, the Fed has given a tick to likely outcome in its minutes last night as it talked up the strength of the US economy. However, we remain in very knee-jerk news driven market that offers plenty of opportunity for active investors, but certainly very little comfort to the long term investor.
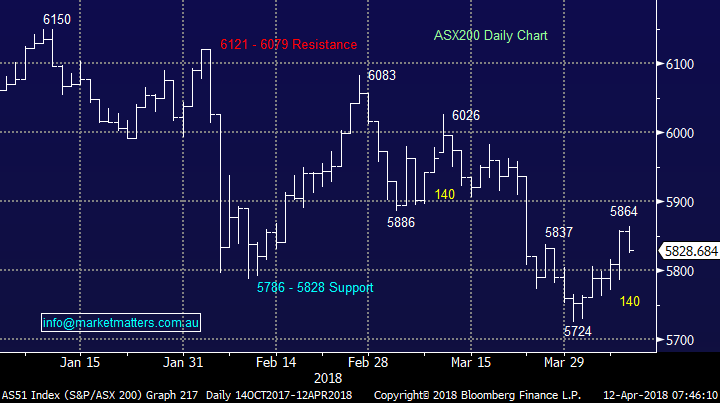
We’ve had our anticipated bounce by the ASX200 to the 5850 area, but a close above 5900 is still required for MM to become bullish short-term, conversely a break back below 5800 would now be of concern technically. A second bounce of exactly 140-points does concern us that a break below 5700 may be on the horizon making the 5790-5800 area critical to us technically short-term.
Today’s report is going to take a close look at the MM Growth Portfolio, but this time focusing on our worst 3 performers to decide if we should cut and run, average or just stay put.
N.B. Remember due to our medium-term outlook for stocks, we far more likely to press the button on sell opportunities as opposed to buy ones.
ASX200 Chart
Overseas Markets
Overnight the US S&P500 slipped -0.55% on a combination of the Syria / Fed news, not a bad result after the 1.67% surge on Tuesday. What caught our eye was the positive close by the Russell 2000 index which is perceived to have lower exposure to global markets – the Russell 2000 is the smallest 2000 stocks in the broad based Russell 3000 Index which we often use to gauge the strength of US stocks.
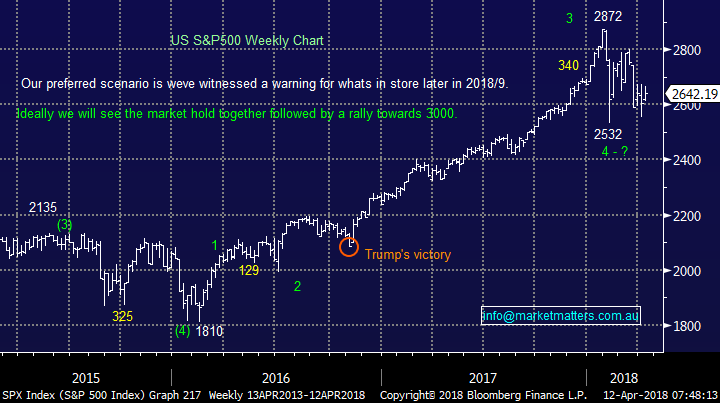
Overall we must remain neutral just here, but our preferred scenario moving forward still remains a doomed attempt to break upwards towards the psychological 2900-3000 area.
US S&P500 Chart
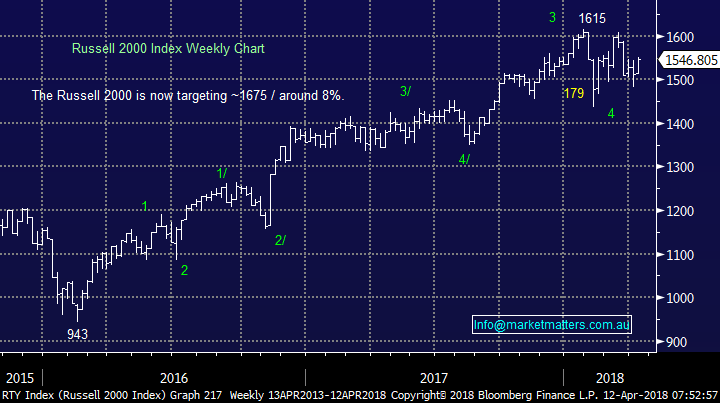
The Russell 2000 remains bullish targeting fresh 2018 highs which adds a degree of comfort to our short-term bullish view for stocks but it does also illustrate that fund managers are happy with the big engine called the American economy but remain concerned with exposure to a more global outlook.
Russell 2000 Chart
Hopefully (a dangerous word) we should see ongoing support from our resources sector today with base metals again performing well overnight e.g. In London Aluminium +2.9% and Zinc +1%.
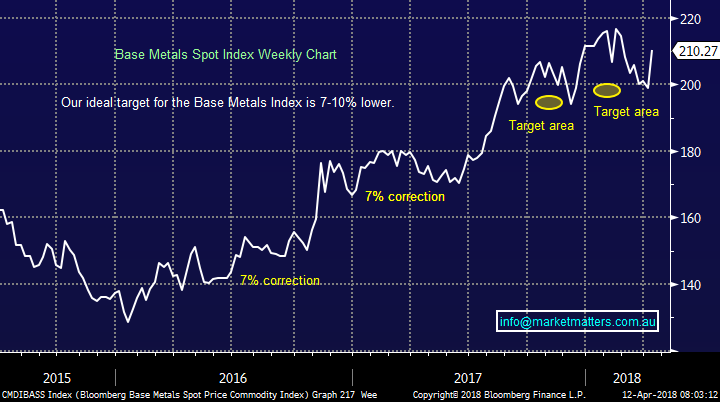
The Base Metals Spot Index has followed our expected path extremely well over recent years and we still see fresh highs in 2018 before its time to “get off the resources train”.
Base Metals Spot Index Chart
It’s very important to keep “our fingers on the pulse” as we saw with Alumina (AWC) which fell -2.7% the day after MM’s sell alert – note in this case we still like the company and if gets too “sold off” we may even buy back in, from a sellers perspective we would certainly be looking for over the $2.60 area.
The rebound by WPL discussed below should enable us to realise a small profit on a position that was well in the red a few weeks ago, this illustrates the need for a plan on positions that are hurting us – we held WPL because we remained bullish the crude oil price which has proven correct.
Now to again look at a number of markets / stocks who have not behaved themselves during these periods of uncertainty and are putting pressure on the MM Growth Portfolio.
Subscribers should remember that we are in “sell mode” and hence part of our plan moving forward is to increase our cash levels.
1 Woodside Petroleum (WPL) $30.44
Overnight, crude oil rallied another +1.9% last night taking the US Energy Sector up by +1% in a pretty weak market.
- MM remains bullish crude oil, targeting the $US70/barrel area but this level is approaching fast on supportive news, implying to us a selling opportunity is to hand.
As discussed yesterday we have 2 positions with a strong correlation to the oil price both of which closed significantly below their 2018 high yesterday, even with crude at fresh highs since 2014.
1 Woodside (WPL) $30.44 – we are looking at realising a small profit on our “problem holding” above $30.50 today.
2 BHP Billiton (BHP) $29.44 – BHP received an upgrade yesterday and we can see more on the horizon, we’ve been looking for the $29.50-$30 area for BHP but with the potential to make fresh 2018 highs.
We prefer BHP to WPL even after recent slight outperformance hence taking a small profit and increasing our cash position as planned will give us comfort to give the larger BHP holding some room to run.
*Watch for alerts.
Woodside Petroleum (WPL) Chart
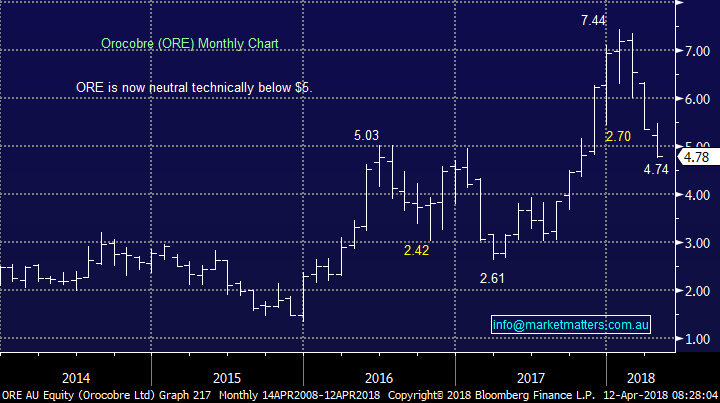
2 Orocobre (ORE) $4.78
We’ve dipped our toe into the lithium space for a 3rd time, following 2 great wins, and its feeling tough at the moment.
- We like the lithium / battery story moving forward, but as we are seeing this relatively new space is very volatile.
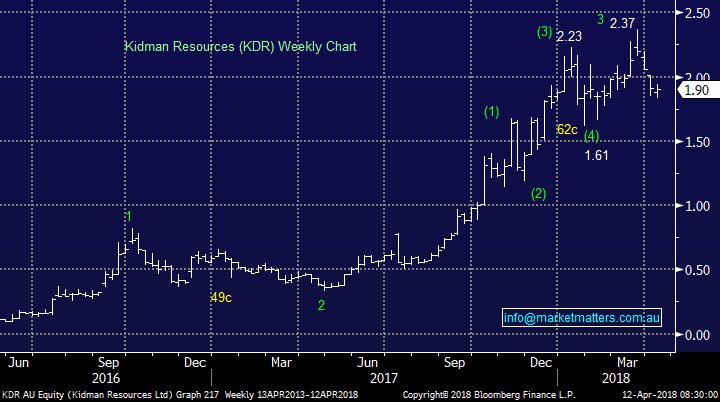
We have no interest in averaging our ORE position, but Kidman Resources (KDR) will be very tempting below $1.70.
With regard to ORE, we intend to give this speculative position some room for now because of our belief in the underlying theme.
Orocobre (ORE) Chart
Kidman Resources (KDR) Chart
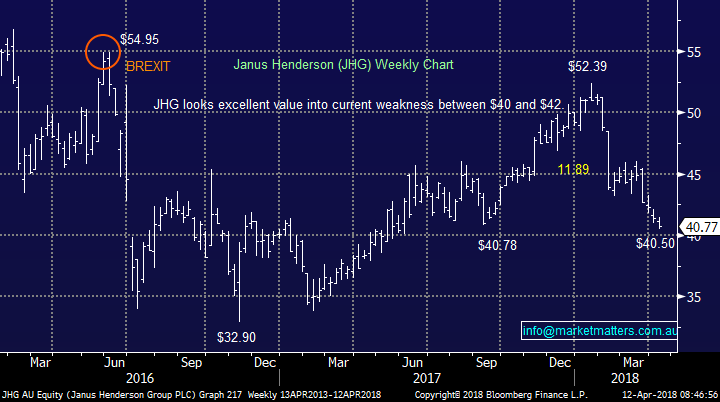
3 Janus Henderson (JHG) $40.77
JHG has been well and truly caught up in the aggressive sell off in our diversified financial sector – a sector we don’t want to own when / if the market endures the +20% correction we are looking for by stocks.
We felt that JHG was cheap (trading on 11.1x est. 2018 earnings) and well positioned because of its offshore earnings, but when a sector gets dumped everyone’s caught up in the pain i.e. the ASX200 diversified financials sector is down -10% for the month while the ASX200 is only down -2.8%.
JHG has fallen over 20% from its 2018 high, almost the exact same correction to market favourite Challenger (CGF).
Our position in JHG is now in “damage control” and we are looking for a bounce to exit – we actually believe the whole sector is ripe for a bounce and don’t yet see a reason to panic out.
Janus Henderson (JHG) Chart
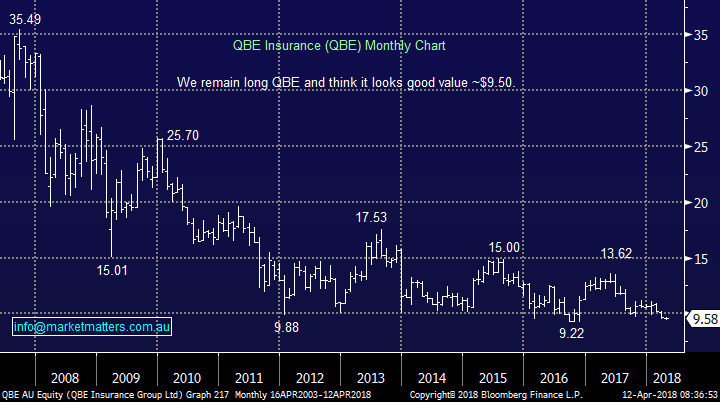
4 QBE Insurance (QBE) $9.58
QBE has arguably been the “dog” of the ASX200 since the GFC and we are paying the price at present for trying to pick a bottom.
However, in a similar manner to WPL we believe the $US is close to a decent rally and US bond yields have much further to go – both are tailwinds for QBE.
We will give QBE more room due to these fundamental views – for now!
QBE Insurance (QBE) Chart
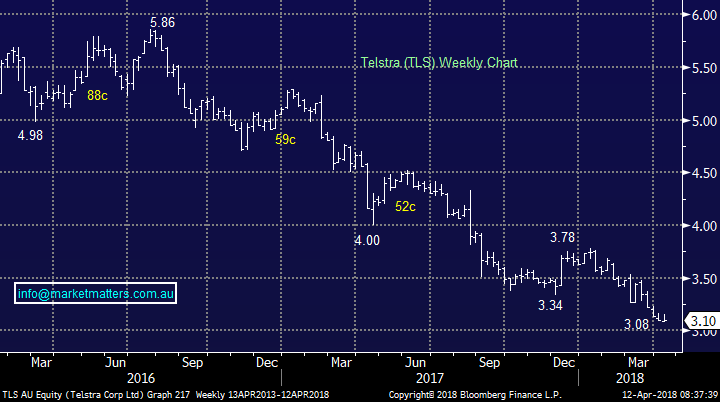
5 Telstra (TLS) $3.10
We have discussed our attraction to TLS at current levels a few times recently and the big question to us at MM is do we average, as planned, when we are looking to increase cash levels.
For now we are going with the conservative approach and not averaging – we are usually pretty aggressive / active at MM but we believe the risks / reward in the market at present are not exciting.
However, we are comfortable with our TLS holding for now.
Telstra (TLS) Chart
Conclusion
- We remain sellers of strength in general and will be following the plans in the 5 points outlined above.
Watch for alerts.
Overnight Market Matters Wrap
· The US Equities market lost some ground overnight following the release of the minutes from the March Federal Reserve meeting which appeared to indicate a more hawkish tone on the outlook for further rate rises given their views on a strong underlying economy and increasing inflation, which was also supported by a higher than expected core CPI number of 2.1% for March, the highest in a year.
· Strength was seen in the commodities front, as the oil price continued its recent rally, hitting a 3 year high - with crude oil up 2%l as Middle East tensions continued to rise on increasing expectations that the US was preparing to launch an attack on Syria, following some provocative tweets from President Trump.
· Not surprisingly, gold was also in demand as war tensions increased, rallying nearly 1%, back above the US$1350/oz. level, while aluminium continued its recent squeeze following the impact of sanctions and recent supply outages. Iron ore was about 1% lower at below US$65/t and copper flat.
· The June SPI Futures is indicating the ASX 200 to open marginally lower, down 13 points towards the 5815 area this morning.
Have a great day!
James & the Market Matters Team
Disclosure
Market Matters may hold stocks mentioned in this report. Subscribers can view a full list of holdings on the website by clicking here. Positions are updated each Friday, or after the session when positions are traded.
Disclaimer
All figures contained from sources believed to be accurate. Market Matters does not make any representation of warranty as to the accuracy of the figures and disclaims any liability resulting from any inaccuracy. Prices as at 12/04/2018. 8.26AM
Reports and other documents published on this website and email (‘Reports’) are authored by Market Matters and the reports represent the views of Market Matters. The MarketMatters Report is based on technical analysis of companies, commodities and the market in general. Technical analysis focuses on interpreting charts and other data to determine what the market sentiment about a particular financial product is, or will be. Unlike fundamental analysis, it does not involve a detailed review of the company’s financial position.
The Reports contain general, as opposed to personal, advice. That means they are prepared for multiple distributions without consideration of your investment objectives, financial situation and needs (‘Personal Circumstances’). Accordingly, any advice given is not a recommendation that a particular course of action is suitable for you and the advice is therefore not to be acted on as investment advice. You must assess whether or not any advice is appropriate for your Personal Circumstances before making any investment decisions. You can either make this assessment yourself, or if you require a personal recommendation, you can seek the assistance of a financial advisor. Market Matters or its author(s) accepts no responsibility for any losses or damages resulting from decisions made from or because of information within this publication. Investing and trading in financial products are always risky, so you should do your own research before buying or selling a financial product.
The Reports are published by Market Matters in good faith based on the facts known to it at the time of their preparation and do not purport to contain all relevant information with respect to the financial products to which they relate. Although the Reports are based on information obtained from sources believed to be reliable, Market Matters does not make any representation or warranty that they are accurate, complete or up to date and Market Matters accepts no obligation to correct or update the information or opinions in the Reports.
If you rely on a Report, you do so at your own risk. Any projections are estimates only and may not be realised in the future. Except to the extent that liability under any law cannot be excluded, Market Matters disclaims liability for all loss or damage arising as a result of any opinion, advice, recommendation, representation or information expressly or impliedly published in or in relation to this report notwithstanding any error or omission including negligence.
To unsubscribe. Click Here


